. 2024 Dec 3;4(1):258.
doi: 10.1038/s43856-024-00677-7.

Spatial omics-based machine learning algorithms for the early detection of hepatocellular carcinoma

Affiliations

Spatial omics-based machine learning algorithms for the early detection of hepatocellular carcinoma

Mengjun Wang et al. Commun Med (Lond). .

Abstract

Background: Worldwide, hepatocellular carcinoma (HCC) is the second most lethal cancer, although early-stage HCC is amenable to curative treatment and can facilitate long-term survival. Early detection has proved difficult, as proteomics, transcriptomics, and genomics have been unable to discover suitable biomarkers.

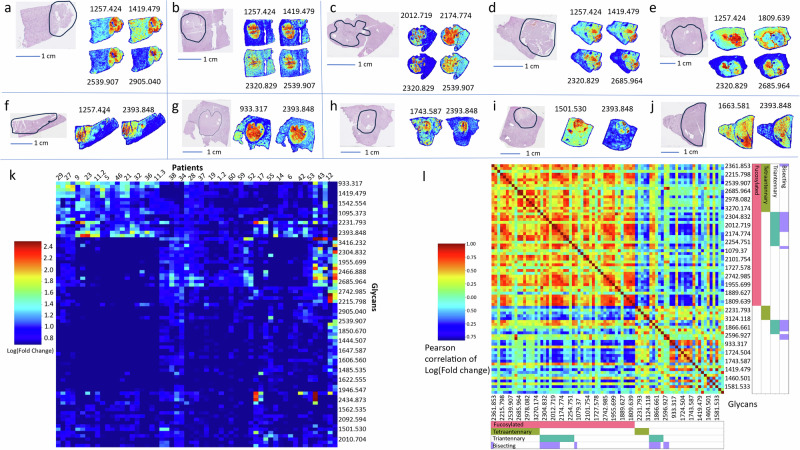
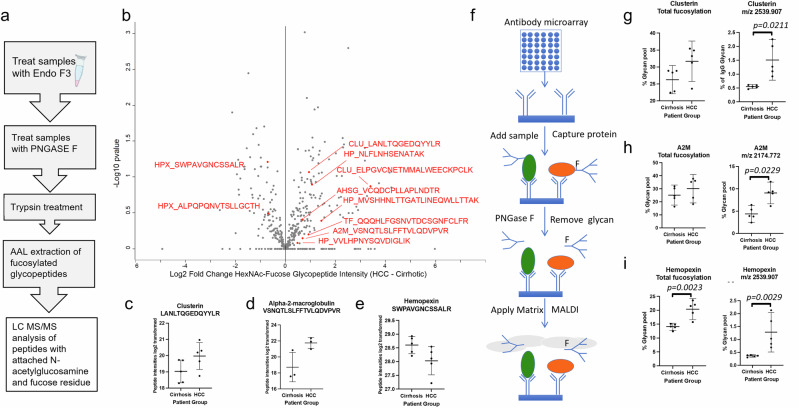
Methods: To find new biomarkers of HCC, we utilized a spatial omics N-glycan imaging method to identify altered glycosylation in cancer tissue (n = 53) and in paired serum of individuals with HCC (n = 23). Glycoproteomics identified the glycoproteins carrying these N-glycan structures, and we utilized an antibody array-based glycan imaging method to examine all the N-glycans associated with the identified glycoproteins. N-glycans from the examined glycoproteins were used to create machine learning algorithms, which were tested in a case-control sample set of 100 patients with cirrhosis and HCC and 101 matched patients with cirrhosis alone.

Results: Spatial glycan imaging identifies thirteen branched, fucosylated, and high mannose glycans as altered in HCC tissue and in matched patient serum. Glycoproteomics identifies over 50 proteins containing these changes, of which sixteen glycoproteins were selected for further testing in an independent patient set. Algorithms using a combination of glycan and glycoproteins accurately differentiate early-stage and all HCC from cirrhosis with AUROC values of 0.88-0.97.

Conclusions: In conclusion, we present the development and application of a new biomarker platform, which can identify effective biomarkers for the early detection of HCC. This platform may also apply to other diseases, in which changes in N-linked glycosylation are known to occur.

Plain language summary

Hepatocellular carcinoma (HCC) is the second deadliest cancer globally. However, it can be treated successfully if detected early. Unfortunately, finding early-stage HCC is challenging because current methods haven’t identified good biomarkers (factors to identify cancer). To discover new HCC biomarkers, we used a technique to study changes in specific sugar molecules (N- glycans) directly in HCC tissue, and blood samples from the same people. Importantly, cancer-specific changes were observed in tissue that could also be found in blood, allowing for the development of a blood test for the early detection of this cancer.


Conflict of interest statement

Competing interests: The authors declare the following competing interests: A.S.M., P.M.A., and R.R.D. are listed as inventors on a patent filed by MUSC on the technology described in this manuscript. Authors M.W., S.G., M.F.B., J.D., A.D., C.B., H.L., D.S., G.H., A.B., S.-O.R., D.L., L.B., J.B., S.C., Y.K., N.K., Y.H., L.Q., A.Y., P.G., and A.S. declare no competing interest.

Figures

Fig. 1
Fig. 1. N-glycan heterogeneity in HCC tissue.
aj H&E stain of ten individual tissue sections with the pathology annotated cancer lesion highlighted, along with four MALDI imaging images showing specific alterations in N-linked glycosylation. M/Z values are given above or below each image. ae Five individual tissues with predominantly changes in fucosylation; fj Five individual tissues with changes in branching but not fucosylation. k Heat map showing N-glycan clusters in different patient groups. l Correlation plot showing that N-glycan alteration occurs in clusters. aj Color scale is used to represent the intensity of spectra, with blue being the weakest and red being the strongest. kl, the color and size scale and associated with each panel is indicated.
Fig. 2
Fig. 2. Glycans observed in tissue are also observed in matching serum.
a Method of serum N-glycan analysis. bd Serum N-linked analysis from 14 representative HCC patients for whom matched tissue N-glycan analysis was performed. Samples were analyzed in triplicate and sample numbers are shown either above, below, or adjacent to spots. b is for the N-glycan at m/z 2320.829, c for the N-glycan at m/z 2393.848 and d for the N-glycan at m/z 2539.907. The control sample (purchased healthy serum sample) is shown in triplicate under sample #4 in the red box. e Graph showing the relationship between positively correlated tissue and serum glycans. In all figures m/z values are included. Asterisk indicates those glycans that are fucosylated. b A color scale is used to represent intensity of spectra, with blue being weakest and red being strongest.
Fig. 3
Fig. 3. Glycoproteomics for the analysis of fucosylated glycoproteins.
a Proteomic workflow. b Volcano plot showing altered glycopeptides in HCC. ce Three glycopeptides that were found to be increased in HCC samples, c is a glycopeptide from clusterin, d is a peptide from alpha-2 macroglobulin and e is a glycopeptide from hemopexin. f Workflow for the GlycoTyper, used to orthogonally confirm N-glycan alterations. g GlycoTyper analysis of clusterin, showing either changes in total fucosylation (left panel) or on a specific N-glycan (m/z 2539.907), h GlycoTyper analysis of alpha-2-macroglobulin (A2M), showing either changes in total fucosylation (left panel) or on a specific N-glycan (m/z 2174.772), i GlycoTyper analysis of hemopexin, showing either changes in total fucosylation (left panel) or on a specific N-glycan (m/z 2539.907). Where statistical difference exists, the p value is provided. Graphs include the mean and the 95% CI.
Fig. 4
Fig. 4. GlycoTyper Method for the serum analysis of specific glycoproteins.
a Slides are spotted with 16 antibodies (top to bottom in columns) to the following antibodies: (1) anti-Alpha 1 Antitrypsin, (2) anti- Alpha 1B-Glycopotein, (3) anti-alpha 1-Acid Glycoprotein, (4) anti-Alpha-2-Macroglobulin, (5) anti-Angiotensinogen II/III, (6) anti-Apolipoprotein D, (7) anti-Apolipoprotein H (ApoH), (8) anti-Ceruloplasmin, (9) anti-Clusterin, 10) anti-Fetuin, 11) anti-Haptoglobin, 12) anti-Hemopexin, (13) anti histidine-proline rich glycoprotein; (14) anti-IgG, (15) anti-Transferrin; (16) anti-Vitamin D Binding Protein. B-D) Example of GlycoTyper data for the 16 captured proteins for N-glycan at 2539.881 (b, e), N-glycan at 2174.654 (c, f) and N-glycan at 1809.639 (d, g). bd are from patients with HCC, while eg are from patient with cirrhosis. h Bar graph with individual data points showing the mean (with SD) level of N-glycan at 2539.907 on haptoglobin; i Bar graph with individual data points showing the mean (with SD) level of N-glycan at 1663.581 on transferrin. j, k Similar analysis on angiotensinogen (j) hemopexin (k). l ROC curves for Model G, AFP and AFP-L3 of discriminant ability to classify all or early-stage HCC from cirrhosis. Where statistical difference exists, the p value is provided and error bars indicate the standard deviation.

References

    1. Singal, A. G., Kanwal, F. & Llovet, J. M. Global trends in hepatocellular carcinoma epidemiology: implications for screening, prevention and therapy. Nat. Rev. Clin. Oncol.20, 864–884 (2023). - PubMed
    1. Llovet, J. M. et al. Hepatocellular carcinoma. Nat. Rev. Dis. Prim.7, 6 (2021). - PubMed
    1. Tzartzeva, K. et al. Surveillance imaging and alpha fetoprotein for early detection of hepatocellular carcinoma in patients with cirrhosis: a meta-analysis. Gastroenterology154, 1706–1718.e1 (2018). - PMC - PubMed
    1. Chong, N. et al. Association between ultrasound quality and test performance for HCC surveillance in patients with cirrhosis: a retrospective cohort study. Aliment. Pharm. Ther.55, 683–690 (2022). - PubMed
    1. Singal, A. G. et al. International liver cancer association (ILCA) white paper on biomarker development for hepatocellular carcinoma. Gastroenterology160, 25722584 (2021). - PMC - PubMed

LinkOut - more resources