. 2024 Dec;5(12):1815-1833.
doi: 10.1038/s43018-024-00862-6. Epub 2024 Dec 3.

Unique structural configuration of EV-DNA primes Kupffer cell-mediated antitumor immunity to prevent metastatic progression

Affiliations

Unique structural configuration of EV-DNA primes Kupffer cell-mediated antitumor immunity to prevent metastatic progression

Inbal Wortzel et al. Nat Cancer. 2024 Dec.

Abstract

Extracellular vesicles (EVs) transport biomolecules that mediate intercellular communication. We previously showed that EVs contain DNA (EV-DNA) representing the entire genome. However, the mechanism of genomic EV-DNA packaging and its role in cancer remain elusive. We now demonstrate that EV-DNA is predominantly localized on the vesicle surface and associated with uniquely modified and cleaved histones. Moreover, a genome-wide clustered regularly interspaced short palindromic repeats knockout screen revealed that immune developmental pathways and genes, including apoptotic peptidase activating factor 1 (APAF1) and neutrophil cytosolic factor 1 (NCF1), regulate EV-DNA packaging. Furthermore, in colorectal cancer models, uptake of EV-DNA by pre-metastatic liver Kupffer cells (KCs) activated DNA damage responses. This activation rewired KC cytokine production and promoted the formation of tertiary lymphoid structures, thereby suppressing liver metastasis. Conversely, loss of APAF1 decreased EV-DNA packaging and promoted liver metastasis. Importantly, colorectal cancer biopsy EV-DNA secretion could serve as a predictive biomarker for postoperative metastasis. Taken together, our findings indicate that uniquely chromatinized EV-DNA induces antitumor immunity.


Conflict of interest statement

Competing interests: D.L. is on the scientific advisory board of Aufbau Holdings. R.E.S. is on the scientific advisory board of Miromatrix and is a speaker and consultant for Alnylam. The remaining authors declare no competing interests.

Figures
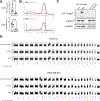
Extendend Data Fig. 1:
Extendend Data Fig. 1:. EV-DNA originates from genomic DNA.
(a,b) A549 and K562 EVs were treated with or without DNase 0, and EV-DNA was extracted. (a) EV-DNA was quantified using Qubit3 and normalized to EV protein content. Data are mean ± s.e.m., analyzed using a two-tailed, unpaired Student’s t-test, with n=4 independent experiments per group. (b) EV-DNA was analyzed using chip-based capillary electrophoresis (Bioanalyzer). The data are representative of n=3 independent experiments. (c) HCT116 cells were treated with 1 μg/ml puromycin for 24 hours to induce apoptosis, with untreated cells as a control. Lysates were prepared from cells and the indicated EVs and analyzed by Western blot using the indicated antibodies. (d) Fragment coverage for paired-end whole genome sequencing (WGS) of EV-DNA (with or without DNase 0) and gDNA in HCT116 and MDA-MB-231 cells. Each box represents one chromosome, and the y-axis shows relative read count abundance along the genome.
Extendend Data Fig. 2:
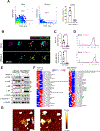
Extendend Data Fig. 2:. APAF1 and NCF1 regulate EV-DNA packaging
(a-b) EVs were isolated from control and APAF1 KO cells. (a) Mode diameter of EVs by nanoparticle tracking analysis. Data are mean ± s.e.m., analyzed using a two-tailed, unpaired Student’s t-test, with n=4 independent experiments for HCT116 and n=3 independent experiments for MDA-MB-231. (b) EVs protein amount (μg) was measured by BCA analysis and normalized to cell number at the time of collection. Data are mean ± s.e.m., analyzed using a two-tailed, unpaired Student’s t-test, with n=6 independent experiments for HCT116 and n=5 independent experiments for MDA-MB-231. (c) Venn diagram showing unique and overlapping proteins identified by MS/MS between control and APAF1 KO EVs in each cell line. (d-g) EVs were isolated from control and NCF1 KO cells. (d) Transmission electron microscopy for EVs, representative of n=3 independent experiments. Scale bar: 200 nm. (e) Mode diameter of EVs by nanoparticle tracking analysis. Data are mean ± s.e.m., analyzed using a two-tailed, unpaired Student’s t-test, with n=4 independent experiments for HCT116 and n=3 independent experiments for MDA-MB-231 from independent experiments. (f) EVs protein amount (μg) was measured by BCA analysis and normalized to cell number at the time of collection. Data are mean ± s.e.m., analyzed using a two-tailed, unpaired Student’s t-test, with n=6 independent experiments for HCT116 and n=5 independent experiments for MDA-MB-231. (g) EV-DNA was extracted and quantified using Qubit3, normalized to EV protein content. Data are mean ± s.e.m., analyzed using a two-tailed, unpaired Student’s t-test, with n=5 independent experiments per group. (h) Genomic DNA and EV-DNA were isolated from HCT116 or MDA-MB-231 cells expressing control or NCF1 KO sgRNAs. qPCR was used to detect sgRNA levels in gDNA and EV-DNA and normalized to control sgRNA sequence in gDNA. Data are mean ± s.e.m., analyzed using a two-tailed, unpaired Student’s t-test, n=5 independent experiments per group from independent experiments. (i) Validation of APAF1 knockdown in NCF1 KO cell lines, the data represent two independent experiments. (j) EV-DNA was extracted from EVs derived from the indicated cell lines. Data are mean ± s.e.m., analyzed using a two-tailed, unpaired Student’s t-test, with n=4 independent experiments per group.
Extendend Data Fig. 3:
Extendend Data Fig. 3:. Education of NSG mice with HCT116 EVs has no effect on metastasis formation
(a) Gating strategy for GFP-positive cells. (b-g) NOD.Cg mice were educated 3 times a week for 3 weeks with 10 μg of EVs (Control or APAF1 KO) from HCT116 cells, or PBS, followed by intra-splenically injection of control GFP-Luc-labeled cells (5×10⁴/mouse). Tumors were allowed to grow for 3–4 weeks with continued education. Experiments were performed twice in male and female mice. (b) Schematics of the education experiment. (c) Representative image of tumors in the spleen. (d) Tumor weight in grams. Data are mean ± s.e.m., analyzed by one-way ANOVA (n=8 mice per Con group, n=8 mice per PBS group, and n=9 mice per KO group from n=2 independent experiments). (e) Representative IVIS images. (f) Quantification of IVIS data. Data are mean ± s.e.m., analyzed by one-way ANOVA (n=9 mice per Con group, n=10 mice per KO group, and n=10 mice per PBS group, from n=2 independent experiments). (g) One liver lobe per mouse was analyzed by flow cytometry for GFP-positive cells. Data are mean ± s.e.m., one-way ANOVA (n=9 mice per Con group, n=11 mice per KO group, and n=9 mice per PBS group from n=2 independent experiments). (h-l) NSG mice educated 3 times a week for 3 weeks with 10 μg of EVs (Control or KO) from HCT116 cells, or PBS, were then intra-splenically injected with APAF1 KO cells (5×10⁴/mouse) labeled with GFP-Luc. Tumors were allowed to grow for 3–4 weeks with continued education. The experiment was performed with 5 mice per group from one experiment in female mice. (h) Representative image of tumors in the spleen. (i) Tumor weight in grams. Data are mean ± s.e.m., analyzed by one-way ANOVA, with n=5 mice per group from one experiment. (j) Representative IVIS images. (k) Quantification of IVIS data. Data are mean ± s.e.m., analyzed by one-way ANOVA, with n=5 mice per group from one experiment. (l) One liver lobe per mouse was digested and analyzed by flow cytometry for GFP-positive cells. Data are mean ± s.e.m., analyzed by one-way ANOVA, with n=5 mice per group from one experiment.
Extendend Data Fig. 4:
Extendend Data Fig. 4:. Generation of APAF1 KO in murine cancer cells.
(a-f) APAF1 was knocked out in CT26 cells, and EVs were isolated from control and APAF1 KO CT26 cells. (a) Total cell extracts were prepared from WT and APAF1 KO cells, and the lysates were analyzed by Western blot using the indicated antibodies. (b) EVs were analyzed by transition electron microscopy (TEM). Scale bar: 200 nm. (c) Nanoparticle tracking analysis; the histogram represents 3 independent readings per EV sample and cell type. (d) EV protein content was measured using BCA analysis and normalized to the number of cells at the time of collection. Data are mean ± s.e.m., analyzed using a two-tailed, unpaired Student’s t-test, with n=3 independent experiments per group. (e) EV-DNA was extracted and quantified using Qubit3, normalized to EV protein content. Data are mean ± s.e.m., analyzed by two-tailed, unpaired Student’s t-test, with n=3 independent experiments per group. (f) EV-DNA was analyzed using chip-based capillary electrophoresis (Bioanalyzer). (g-l) APAF1 was knocked out in KPC cells, and EVs were isolated from control and APAF1 KO KPC cells. (g) Total cell extracts were prepared from WT and APAF1 KO cells, and the lysates were analyzed by Western blot using the indicated antibodies. (h) EVs were visualized by transition electron microscopy. Scale bar: 200 nm. (i) Nanoparticle tracking analysis; the histogram represents 3 independent readings per EV sample and cell type. (j) EV protein content (μg) was measured by BCA analysis and normalized to the number of cells at the time of collection. Data are mean ± s.e.m., analyzed by a two-tailed, unpaired Student’s t-test, with n=10 per cell type from 5 independent experiments. (k) EV-DNA was extracted and quantified using Qubit3, normalized to protein content. Data are mean ± s.e.m., analyzed by two-tailed, unpaired Student’s t-test, with n=7 per cell type from 4 independent experiments. (l) EV-DNA was analyzed using chip-based capillary electrophoresis (Bioanalyzer).
Extendend Data Fig. 5:
Extendend Data Fig. 5:. Reduced EV-DNA induces pro-tumor programming in KCs
(a) Gating strategy for immune cell populations in the liver. (b) Percentages of EV+CD31+ cells. Data are mean ± s.e.m., analyzed by one-way ANOVA, with n=6 mice per group from two independent experiments. (c-d) RNA sequencing analysis of Kupffer cells (KCs) isolated from n=4 mice per group from two independent experiments after treatment with CT26 control or APAF1 KO EVs. (c) Gene Set Enrichment Analysis (GSEA) of pathways enriched in KCs treated with control or APAF1 KO EVs. (d) Pathway analysis highlighting those pathways upregulated in KCs from mice treated with APAF1 KO EVs compared to control EV-treated mice.
Extendend Data Fig. 6:
Extendend Data Fig. 6:. EV-DNA is damaged and induces cytokines secretion from KCs
(a) Total protein was extracted from HCT116 and CT26 cells and EVs. The extracts (5 μg) were analyzed by Western blot for the indicated proteins. Data are representative of n=2 independent experiments. (b) Primary KCs were isolated from the livers of naïve mice, plated in 48-well plates, and allowed to adhere for 16–24 hr. The KCs were then treated with the LPS (1 μg/ml) or control EVs (10 μg) for 24 hours, after which cytokines secreted in the media were quantified (LegendPlex assay). Data summarize n=2 independent repeats. (c) Balb/c mice were educated 3 times per week for 3 weeks with 10 μg of EVs (control or APAF1 KO) derived from CT26 cells or PBS. One liver lobe from each mouse was used for flow cytometric analysis of immune cell populations in the liver. Data are mean ± s.e.m., analyzed by one-way ANOVA, with n=3 mice per group from one experiment. (d) Balb/c mice were educated 3 times per week for 3 weeks with 10 μg of EVs derived from CT26 cells. The liver was extracted and stained for analysis. Left panel: A representative liver section stained with multiplex immunofluorescence, showing B cells (B220, green), T cells (CD3, white), dendritic cells (CD11c, red), and DAPI (blue). Right panel: Following IF imaging, coverslips were removed, and immunohistochemistry staining for vWF was performed. Scale bar: 250 μm. Data represent n=3 independent experiments
Figure 1.
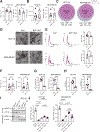
Figure 1.. EV-DNA is uniquely chromatinized and presented on the vesicle surface.
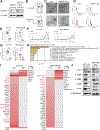
(a-d) HCT116 and MDA-MB-231 EVs were pretreated with or without DNase 0: (a,b) Direct stochastic optical reconstruction microscopy (dSTORM) of HCT116 EVs labeled with Cell Mask Green (CMG, yellow) and stained with CD81 (cyan) and dsDNA (pink) antibodies. (a) In the density plot for dsDNA-positive vesicles, signals below 5 bins are considered background. Data are presented as mean ± s.e.m., analyzed using a two-tailed, unpaired Student’s t-test, with n=3 per group from independent experiments, with over 300 vesicles analyzed in each experiment (b) Representative single EV from each treatment. Scale bar: 200 nm. (c) EV-DNA was extracted and measured by Qubit3 and normalized to the protein content of the EVs. Data are presented as mean ± s.e.m., analyzed using a two-tailed, unpaired Student’s t-test, with n=4 EV-DNA samples per group from independent experiments. (d) EV-DNA was measured using chip-based capillary electrophoresis (Bioanalyzer). The data represent n=3 independent experiments. (e) Total extracts were prepared from cells and EVs (with or without DNase0 treatment). The extracts (5 μg) were analyzed by Western blot for the indicated proteins (ALIX, Syntenin-1, and Actin, which serve as loading controls). Data represents n=3 independent experiments. (f) Histones were extracted from cells and EVs (n=3 histone preparations per group from independent experiments) and analyzed by MS/MS for PTM. (g) Chromatin was precipitated from freshly isolated HCT116 EVs. The EV-chromatin was imaged by atomic force microscopy. Two representative images are shown. The X/Y scale bar is 50 nm, and the color scale bar represents height (−0.5 – 2.5 nm). Data represent n=3 independent experiments.
Figure 2:
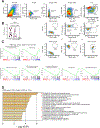
Figure 2:. Genome-wide CRISPR/Cas9 knockout screen identifies immune-developmental genes as regulators of EV-DNA packaging.
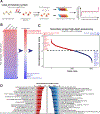
(a) Schematic illustration of the genome-wide genetic knockout screen using CRISPR/Cas9 technology. (b) Heatmaps of 18,927 genes ranked by the average score across four cell lines, including MDA-MB-231, HCT116, K562, and A549. The screen was performed at least twice per cell line (6 sgRNAs per gene). (c) Top-ranked candidates from the secondary screen, consisting of 612 genes targeted by single guide RNAs. The screen was performed four times per cell line (10 sgRNAs per gene). (d) Pathway analysis of the secondary screen reveals pathways that promote (red) and inhibit (blue) EV-DNA packaging.
Figure 3:
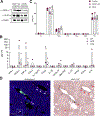
Figure 3:. APAF1 regulates EV-DNA packaging.
(a) Total cell extracts were prepared from non-targeting control (Con) and APAF1 KO derived from HCT116 or MDA-MB-231 cells. The lysates were blotted with the indicated antibodies. Data represent one of three independent repeats per cell type. (b) 2×10⁶ Con and KO cells were grown in EV-depleted media for three days, and then cell number was counted. Data summarize independent experiments: n=4 for HCT116 and n=5 for MDA-MB-231. Data are presented as mean ± s.e.m., analyzed using a two-tailed, unpaired Student’s t-test. (c-g) EVs were isolated by ultracentrifugation from Con and KO cells. (c) EVs were imaged by transmission electron microscopy (TEM). Data represent one of n=3 independent EV preparations per cell type. Scale bar: 200 nm. (d) Nanoparticle tracking analysis. The histogram represents data from n=3 independent EV analyses per condition. (e) EV-DNA was extracted and measured by Qubit3 (ng), and normalized to the protein content (μg) of the EVs. Data are presented as mean ± s.e.m., analyzed using a two-tailed, unpaired Student’s t-test, with n=5 independent EV-DNA extractions per cell type. (f) EV-DNA was measured using chip-based capillary electrophoresis (Bioanalyzer). Data represent one of n=3 independent EV-DNA preparations measured per cell type. (g) Genomic DNA (gDNA) was isolated from HCT116 or MDA-MB-231 cells expressing control or APAF1 KO sgRNAs. DNA was also isolated from HCT116 and MDA-MB-231 EVs (100 and 200 μg, respectively). qPCR was used to quantify the amount of sgRNA in gDNA and EV-DNA pools, normalized to the control sgRNA in gDNA. Data are presented as mean ± s.e.m., analyzed using a two-tailed, unpaired Student’s t-test, with n=5 independent experiments per cell type. (h-i) Proteomic analysis of EVs isolated from Con and KO cells (5 μg). (h) Unique and enriched proteins in EVs derived from Con and APAF1 KO MDA-MB-231 and HCT116 cells. Proteins common to both cell lines were selected for pathway analysis. (i) Heatmap of differentially expressed proteins in Con and APAF1 KO EVs, with histones highlighted in red. (j) Western blot analysis of protein extracts from Con and APAF1 KO EVs (5 μg). Syntenin serves as a loading control. Data represent one of n=3 independent repeats.
Figure 4:
Figure 4:. Loss of EV-DNA secretion promotes liver metastasis in colorectal cancer and PDAC models
(a-g) HCT116 Con and APAF1 KO cells (5×10⁴) labeled with a GFP-luciferase (GFP-Luc) were injected intra-splenically into NOD.Cg mice. The mice were monitored for ~3–4 weeks, after which the tumor and liver were dissected, and the liver was analyzed for metastasis. Data represent the average of n=4 independent repeats. (a) Schematic representation of the tumor growth experiment. (b) Representative image of tumors, and tumor weight in grams. Data are presented as mean ± s.e.m., analyzed using a two-tailed, unpaired Student’s t-test, with n=13 mice per group from three independent experiments. (c) IVIS images of the entire animal (top) and the liver (bottom). (d) Quantification of the liver IVIS data. Data are presented as mean ± s.e.m., analyzed using a two-tailed, unpaired Student’s t-test, with n=10 mice (Con group) and n=9 mice (KO group) from three independent experiments. (e) One liver lobe from each mouse was digested and analyzed by flow cytometry for GFP-positive cells. Data are presented as mean ± s.e.m., analyzed using a two-tailed, unpaired Student’s t-test, with n=13 mice (Con group) and n=15 mice (KO group) from three independent experiments. (f) Representative liver H&E image. Scale bar: 500 μm. (g) Quantification of metastatic lesions and metastatic burden. Data are presented as mean ± s.e.m., analyzed using a two-tailed, unpaired Student’s t-test, with n=6 sections per group from different mice. (h-k) KPC-YFP WT and APAF1 KO cells (1×10⁴) were injected intra-pancreatically into C57/Bl6 mice. Data represent the average of two independent repeats in female mice, with n=9 mice per group. (h) A representative image of tumors. (i) Tumor weight in grams. Data are presented as mean ± s.e.m., analyzed using a two-tailed, unpaired Student’s t-test, with n=9 mice per group from two independent experiments. (j) Representative H&E image of the liver. Scale bar: 100 μm. Arrows indicate metastatic foci. (k) Quantification of metastatic lesions from H&E images. Data are presented as mean ± s.e.m., analyzed using a two-tailed, unpaired Student’s t-test, with n=9 mice per group from two independent experiments.
Figure 5:
Figure 5:. Education with EV-DNA is sufficient to attenuate metastasis in a colorectal cancer model
Balb/c mice were educated three times a week for three weeks with 10 μg of EVs (Con or APAF1 KO) derived for CT26 cells or PBS as a control. The mice were then injected with CT26 WT cells (5×10⁴), and tumors were allowed to grow for 2–3 weeks with continued EV education. Data represent the average of n=10 mice per group from three independent repeats in both male and female mice. (a) Schematic of the education experiment. (b) Representative image of CT26 tumors in the spleen. (c) Tumor weight in grams. Data are presented as mean ± s.e.m., analyzed using one-way ANOVA, n=10 mice per group from three independent experiments. (d) Representative H&E image of the liver. Scale bar: 500 μm. (e) Metastatic burden. Data are presented as mean ± s.e.m., analyzed using one-way ANOVA, with n=10 mice per group from three independent experiments.
Figure 6:
Figure 6:. KCs internalize CRC-derived EVs irrespective of their DNA content
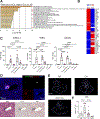
(a) Biodistribution experiment using labeled CT26-derived EVs (Con or KO) injected retro-orbitally into mice (10 μg/mouse). Data represent n=9 mice per group from three independent experiments, including both male and female mice. (b,c) Near-infrared imaging of EV uptake in the liver. A representative image is shown in (b), with signal quantification in (c). Data are presented as mean ± s.e.m., analyzed using one-way ANOVA, with n=9 mice per group from three independent experiments. (d) Flow cytometry of a single, digested liver lobe showing the frequency of EV-positive (EV+) cells in the liver. Data are presented as mean ± s.e.m., analyzed using one-way ANOVA, with n=6 mice per group from two independent experiments. (e) Flow cytometry analysis of a single, digested liver lobe showing the frequency of EV+CD45+ cells. Data are presented as mean ± s.e.m., analyzed using one-way ANOVA, with n=6 mice per group from two independent experiments. (f) Frequency of EV+ liver immune cell populations. Data are presented as mean ± s.e.m., analyzed using two-way ANOVA, with n=9 mice per group from three independent experiments. (g) Liver lobe stained with F4/80 (KCs; red), CD31 (endothelial cells; green), DAPI (nuclei; blue), and CVBur-labeled EVs (Cyan). The right panel shows a magnified view. Scale bar: 10 μm. (h) Quantification of staining from (g), presented as mean ± s.e.m., analyzed using one-way ANOVA. Data include n=18, 20, and 4 images for Con, KO, and Mock, respectively, from four mice per group across two independent experiments.
Figure 7:
Figure 7:. EV-DNA induces DDR in KCs and TLS formation in the liver
(a-b) CT26-derived EVs (Con or KO) were injected retro-orbitally into mice (10 μg/mouse). After 24 hours, KCs were sorted and subjected to RNA sequencing. Data represent n=4 mice per group, including both male and female mice from two independent experiments. (a) Pathway analysis based on RNA sequencing of KCs isolated from control or APAF1 KO EV-treated mice, with n=4 mice per group from two independent experiments. (b) Differential cytokine expression in KCs isolated from control or APAF1 KO EV-treated mice, with n=4 mice per group from two independent experiments. (c) Primary KCs isolated from the livers of naïve mice were treated with EVs (10 ug), DNA (10 μM CpG agonist), or EV-DNA, and cytokine secretion was measured. Data are presented as fold changes over untreated (NT) KCs. Data are presented as mean ± s.e.m., analyzed using one-way ANOVA, in n=5 independent experiments. (d-f) Balb/c mice were educated three times a week for three weeks with 10 μg of EVs (Con or APAF1 KO) derived for CT26 cells or PBS control. The experiment was performed in female mice in three independent repeats. (d) Representative image of a TLS in the liver containing B cells (B220, green), T cells (CD3, white), dendritic cells (CD11c, red), and DAPI (blue). Immunohistochemical staining with antibodies against CD31 and vWF was performed twice, sequentially, following immunofluorescence staining. A sequential section was stained for histological analysis. Scale bar: 100 μm. (e) Outline of liver lobes showing positive TLSs (red) or negative areas (blue). Scale bar: 2 mm. (f) Quantification of TLSs. Data are presented as mean ± s.e.m., analyzed using one-way ANOVA, with n=7 mice in the PBS group, n=7 mice in the Con group, n=8 mice in the KO group, and n=2 mice in the non-treated (NT) group, from three independent experiments.
Figure 8:
Figure 8:. EV-DNA as a potential prognostic biomarker for predicting metastasis in patients with colorectal cancer.
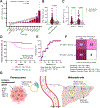
(a) EVs were isolated from cancer cell lines (A375, SK-MEL192 – melanoma; AsPC1 – pancreas; HCT116 – colorectal; MDA-MB-231 – breast; SCC25, SCC4 – head & neck; K562 – leukemia; A549 – lung; DAOY, DIPG4, SF7761, SF8828 – brain). EV-DNA was extracted and normalized to the protein content of the EVs (μg) with n=2–4 independent experiments per cell type. Data are presented as mean ± s.e.m. Statistical analysis was performed using two-sided Spearmen correlation (p = 1.2×10⁻¹⁴). (b-d) Fresh tumor tissue resected from CRC patients (n=105 patients, stages II-III, no evidence of metastasis) was collected and processed in ice-cold PBS. EVs and EV-DNA were extracted, and patients were followed for three years. (b) Concentration of EV-DNA in primary colon cancer-derived EVs from patients without recurrence (n=90 patients) and those who developed metastasis within three years (n=15 patients). Data are presented as mean ± s.e.m., analyzed using an unpaired two-sided t-test with Welch’s correction (p = 0.0001). (c) Concentration of EV-DNA isolated from primary colon cancer tissue, grouped by tumor stage (stage II no recurrence n=42 patients, stage II recurrence n=6 patients, stage III no recurrence n=48 patients, stage III recurrence n=9 patients). Data are presented as mean ± s.e.m., analyzed using an unpaired two-sided t-test with Welch’s correction (stage II: p = 0.0332; stage III: p = 0.0003). (d) Kaplan-Meier survival plot of CRC patients with high EV-DNA concentration (≥ 49.2 ng/μg) versus low EV-DNA concentration (< 49.2 ng/μg). Statistical analysis was performed using a log-rank test. (e) Receiver operating characteristic curve (ROC) for predicting recurrence based on tumor explant-derived EV-DNA. (f) Classification error matrix using EV-DNA amount (median, 49.2 ng/ug) as a cut-off. The number of samples identified is shown in each box. Statistical analysis was performed using a two-sided Fisher’s exact test. (g) Schematic illustration of the proposed mechanism by which EV-DNA prevents metastasis. APAF1 and NCF1 regulate EV-DNA packaging, producing chromatinized DNA with unique post-translational modifications. Circulating EVs that reach the liver, are taken up by KCs, activating thier DNA damage response (DDR) and cytokine secretion. This activation initiates the formation of TLSs to enhance immune surveillance and diminish metastatic potential.

References

    1. Zijlstra A. & Di Vizio D. Size matters in nanoscale communication. Nat Cell Biol 20, 228–230 (2018). 10.1038/s41556-018-0049-8 - DOI - PMC - PubMed
    1. Zhang H. et al. Identification of distinct nanoparticles and subsets of extracellular vesicles by asymmetric flow field-flow fractionation. Nat Cell Biol 20, 332–343 (2018). 10.1038/s41556-018-0040-4 - DOI - PMC - PubMed
    1. Zhang Q. et al. Transfer of Functional Cargo in Exomeres. Cell Rep 27, 940–954 e946 (2019). 10.1016/j.celrep.2019.01.009 - DOI - PMC - PubMed
    1. Jeppesen DK et al. Reassessment of Exosome Composition. Cell 177, 428–445 e418 (2019). 10.1016/j.cell.2019.02.029 - DOI - PMC - PubMed
    1. Lucotti S, Kenific CM, Zhang H. & Lyden D. Extracellular vesicles and particles impact the systemic landscape of cancer. EMBO J 41, e109288 (2022). 10.15252/embj.2021109288 - DOI - PMC - PubMed

MeSH terms

LinkOut - more resources