. 2025 Jun;47(3):3741-3758.
doi: 10.1007/s11357-024-01449-w. Epub 2024 Dec 3.

Blood-based biomarkers for early frailty are sex-specific: validation of a combined in silico prediction and data-driven approach

Affiliations

Blood-based biomarkers for early frailty are sex-specific: validation of a combined in silico prediction and data-driven approach

Jelle C B C de Jong et al. Geroscience. 2025 Jun.

Abstract

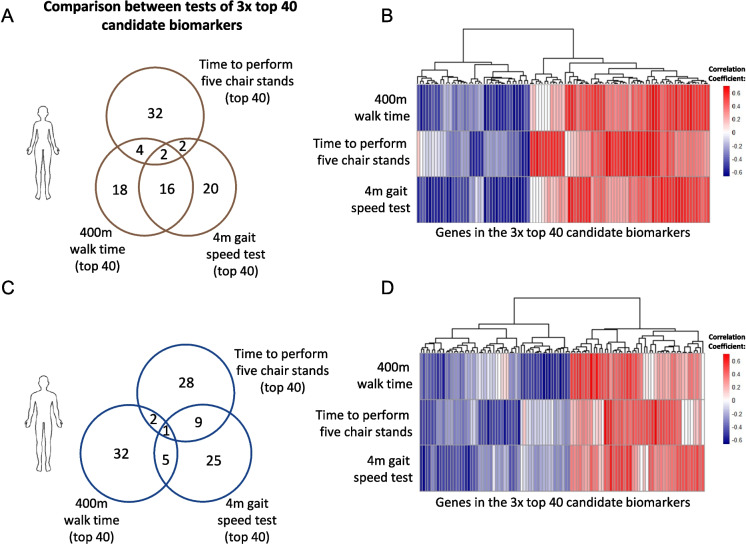
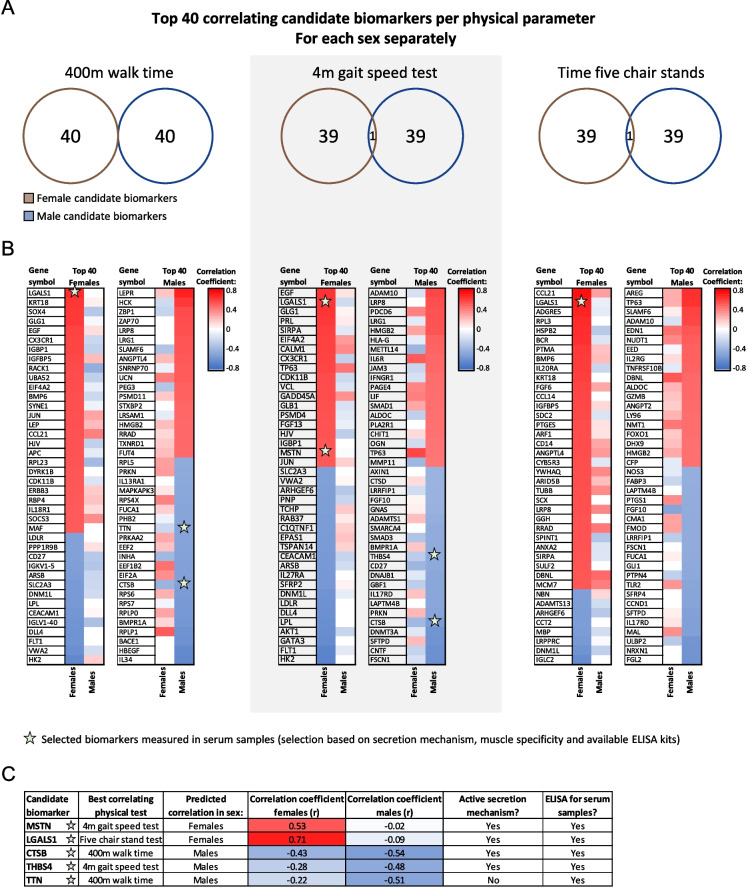
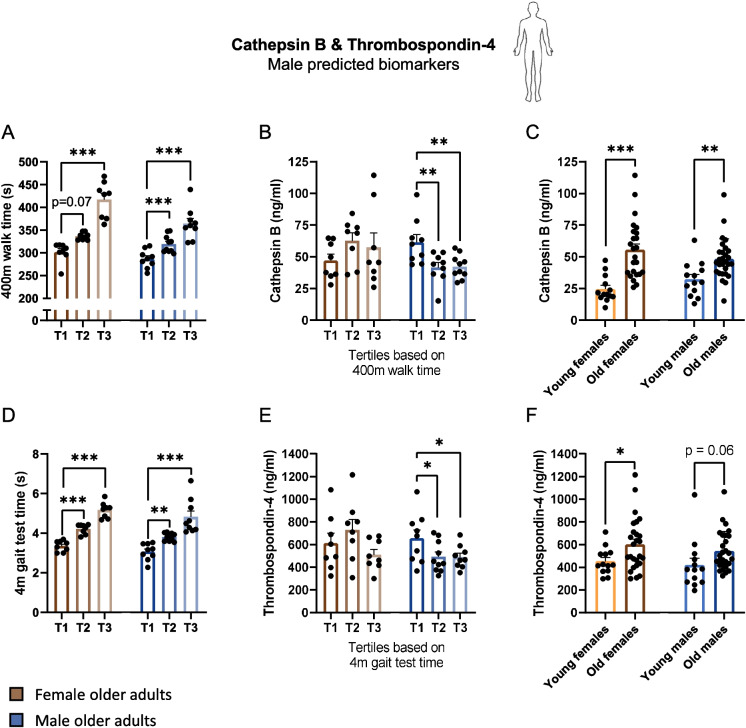
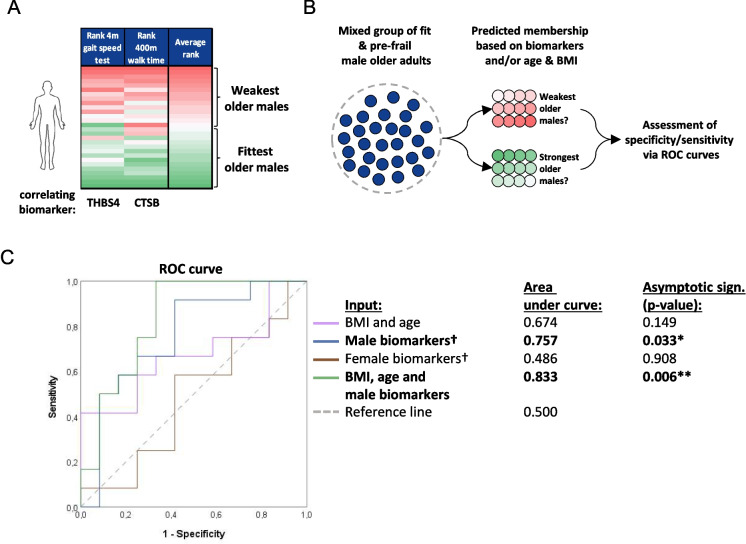
Frailty is characterized by loss of physical function and is preferably diagnosed at an early stage (e.g., during pre-frailty). Unfortunately, sensitive tools that can aid early detection are lacking. Blood-based biomarkers, reflecting pathophysiological adaptations before physical symptoms become apparent, could be such tools. We identified candidate biomarkers using a mechanism-based computational approach which integrates a priori defined database-derived clinical biomarkers and skeletal muscle transcriptome data. Identified candidate biomarkers were used as input for a sex-specific correlation analysis, using individual gene expression data from female (n = 24) and male (n = 28) older adults (all 75 + years, ranging from fit to pre-frail) and three frailty-related physical parameters. Male and female groups were matched based on age, BMI, and Fried frailty index. The best correlating candidate biomarkers were evaluated, and selected biomarkers were measured in serum. In females, myostatin and galectin-1 and, in males, cathepsin B and thrombospondin-4 serum levels were significantly different between the physically weakest and fittest participants (all p < 0.05). Logistic regression confirmed the added value of these biomarkers in conjunction with age and BMI to predict whether the subjects belonged to the weaker or fittest group (AUC = 0.80 in females and AUC = 0.83 in males). In conclusion, both in silico and in vivo analyses revealed the sex-specificity of candidate biomarkers, and we identified a selection of potential biomarkers which could be used in a biomarker panel for early detection of frailty. Further investigation is needed to confirm these leads for early detection of frailty.

Keywords: Biomarker identification; Circulating markers; Diagnosis; Monitoring; Prevention; Screening.


Conflict of interest statement

Declarations. Competing interests: The authors declare no competing interests.

Figures

Fig. 1
Fig. 1
A schematic overview of the in silico approach for the identification of candidate biomarkers. In the first step, pathways in Gene Ontology were selected that are related to physical weakness in older adults (frailty), containing 6292 genes. Hereafter, it was tested whether these 6292 genes are recorded as biomarkers in the Cortellis database, resulting in 3227 candidate biomarkers. Additional functional selection criteria were applied in the Cortellis database (as described in the “Materials and methods” section), after which 2016 candidate biomarkers were left. Lastly, correlation analysis was performed for these 2016 candidate biomarkers between RNA-seq-derived gene expression levels and outcomes from physical function tests related to frailty. The top 40 correlating candidate biomarkers per functional test for each sex were selected for further examination
Fig. 2
Fig. 2
Visual representation of overlap in top correlating candidate biomarkers between the three physical function parameters. A Venn diagram indicating the number of shared or unique candidate biomarkers for each physical function outcome in females. B Heatmap with hierarchical clustering displaying the correlation coefficient for each candidate biomarker across each physical function parameter in females. A red color indicates a positive, and a blue color indicates a negative correlation between the RNA-seq-derived expression levels of a gene and the respective physical function parameter. C Venn diagram indicating the number of shared or unique candidate biomarkers for each physical function parameter in males. D Heatmap with hierarchical clustering displaying the correlation coefficient for each candidate biomarker across each physical function parameter in males
Fig. 3
Fig. 3
Visual representation of overlap in top correlating candidate biomarkers between female and male older adults. A Venn diagram indicating the number of shared or unique candidate biomarkers between the two sexes for each physical function parameter. B Heatmap displaying pairwise (for both females and males) the correlation coefficient of the top 40 candidate biomarkers for each physical function test. Stars indicate that the candidate biomarker was selected for measurement in serum using ELISA. A red color indicates a positive, and a blue color indicates a negative correlation between the RNA-seq-derived expression data of a gene and the respective physical function parameter. C A table highlighting the selected candidate biomarkers for measurement in serum using ELISA
Fig. 4
Fig. 4
Changes in myostatin and galectin-1 serum concentrations during frailty and aging. A Female (brown) and male (blue) tertiles as defined based on their 4 m gait test time. B Myostatin serum concentration levels in the female and male tertiles. C Myostatin serum concentration levels in young and old groups. D Female and male tertiles as defined based on their time to perform five chair stands. E Galectin-1 serum concentration levels in the female and male tertiles. F Galectin-1 serum concentration levels in young and old groups. Values represent mean ± SEM, *p < 0.05, **p < 0.01, and ***p < 0.001
Fig. 5
Fig. 5
Changes in cathepsin B and thrombospondin-4 serum concentrations during frailty and aging. A Female (brown) and male (blue) tertiles as defined based on their time to walk 400 m. B Cathepsin B serum concentration levels in the female and male tertiles. C Cathepsin B serum concentration levels in the young and old groups. D Female and male tertiles as defined based on their 4 m gait test time. E Thrombospondin-4 serum concentration levels in the female and male tertiles. F Thrombospondin-4 serum concentration levels in the young and old groups. Values represent mean ± SEM, *p < 0.05, **p < 0.01, and ***p < 0.001
Fig. 6
Fig. 6
Comparison between the predictive capacity of the biomarkers, BMI and age for the membership of a female older adult towards either the fittest or weakest half of the female study population. A A heatmap visualizing the classification of participants towards the weakest or fittest half of the female population. Data of physical function parameters correlating with identified biomarkers were used (4-m gait speed test and time to perform five chair stands). B Simplified visualization of logistic regression analysis. C ROC curve visualizing area under the curve for the different variables used as input
Fig. 7
Fig. 7
Comparison between the predictive capacity of the biomarkers and BMI and age for the membership of a male older adult towards either the fittest or weakest half of the male study population. A A heatmap visualizing the classification of participants towards the weakest of fittest half of the male population. Data of physical function parameters correlating with identified biomarkers were used (4-m gait speed test and 400-m walk time). B Simplified visualization of logistic regression analysis. C ROC curve visualizing area under the curve for the different variables used as input

References

    1. Gordon EH, Peel NM, Samanta M, Theou O, Howlett SE, Hubbard RE. Sex differences in frailty: a systematic review and meta-analysis. Exp Gerontol. 2017;89:30–40. 10.1016/j.exger.2016.12.021. - PubMed
    1. O’Caoimh R, Sezgin D, O’Donovan MR, William Molloy D, Clegg A, Rockwood K, Liew A. Prevalence of frailty in 62 countries across the world: a systematic review and meta-analysis of population-level studies. Age Ageing. 2021;50:96–104. 10.1093/ageing/afaa219. - PubMed
    1. Kojima G, Iliffe S, Jivraj S, Walters K. Association between frailty and quality of life among community-dwelling older people: a systematic review and meta-analysis. J Epidemiol Commun Health. 2016;70:716–21. 10.1136/jech-2015-206717. - PubMed
    1. Hanlon P, Nicholl BI, Jani BD, Lee D, McQueenie R, Mair FS. Frailty and pre-frailty in middle-aged and older adults and its association with multimorbidity and mortality: a prospective analysis of 493 737 UK Biobank participants. Lancet Public Heal. 2018;3:e323–32. 10.1016/S2468-2667(18)30091-4. - PMC - PubMed
    1. Abizanda P, Romero L, Sánchez-jurado PM, Martínez-reig M, Gómez-arnedo L, Alfonso SA. Frailty and mortality, disability and mobility loss in a Spanish cohort of older adults: the FRADEA Study. Maturitas. 2013;74:54–60. 10.1016/j.maturitas.2012.09.018. - PubMed

Publication types

LinkOut - more resources