. 2024 Dec;6(12):2354-2373.
doi: 10.1038/s42255-024-01168-8. Epub 2024 Dec 3.

Molecular connectomics reveals a glucagon-like peptide 1-sensitive neural circuit for satiety

Affiliations

Molecular connectomics reveals a glucagon-like peptide 1-sensitive neural circuit for satiety

Addison N Webster et al. Nat Metab. 2024 Dec.

Abstract

Liraglutide and other glucagon-like peptide 1 receptor agonists (GLP-1RAs) are effective weight loss drugs, but how they suppress appetite remains unclear. One potential mechanism is by activating neurons that inhibit the hunger-promoting Agouti-related peptide (AgRP) neurons of the arcuate hypothalamus (Arc). To identify these afferents, we developed a method combining rabies-based connectomics with single-nucleus transcriptomics. Here, we identify at least 21 afferent subtypes of AgRP neurons in the mouse mediobasal and paraventricular hypothalamus, which are predicted by our method. Among these are thyrotropin-releasing hormone (TRH)+ Arc (TRHArc) neurons, inhibitory neurons that express the Glp1r gene and are activated by the GLP-1RA liraglutide. Activating TRHArc neurons inhibits AgRP neurons and feeding, probably in an AgRP neuron-dependent manner. Silencing TRHArc neurons causes overeating and weight gain and attenuates liraglutide's effect on body weight. Our results demonstrate a widely applicable method for molecular connectomics, comprehensively identify local inputs to AgRP neurons and reveal a circuit through which GLP-1RAs suppress appetite.


Conflict of interest statement

Competing interests: The authors declare no competing interests.

Figures

Extended Data Fig. 1.
Extended Data Fig. 1.. Validation of Virus Specificity, Comparison with Previous Rabies Mapping Results, and Regional Identification of Glp1r+ Afferents to AgRP Neurons.
A, Representative images from brains of C57BL6j mice (n=5) and Agrp-Cre mice after injection of Cre-dependent rabies helper AAV (AAV8-hSyn-FLEX-TVA-P2A-eGFP-2A-oG) followed by EnvA-rabies-deltaG-H2b-mCherry (“rabies-H2b-mCherry”). In C57Bl6j mice, both injections were targeted to the same site in the thalamus to ensure successful co-injection. Arrow indicates injection site. In Agrp-Cre mice, both injections were targeted to the Arc. B, Representative images of monosynaptic rabies labeling of AgRP neurons and their afferents in the arcuate hypothalamus (Arc), dorsomedial hypothalamus (DMH), and paraventricular hypothalamus (PVH) with rabies-H2b-mCherry. C, Comparing the present study and Wang et al. 2014 in terms of the percentage of cells labeled with rabies-H2b-mCherry via AgRP neurons in various brain regions (n=4 mice for this study, 5 mice for Wang et al. 2014). Bars represent means. MPA, medial preoptic area; MPO, medial preoptic nucleus; LS, lateral septum; BST, bed nucleus of the stria terminalis; PVT, paraventricular thalamus; PAG, periaqueductal gray; SuM, supramammillary nucleus; MM, medial mammillary nucleus. D, Representative images of Glp1r RNA FISH and monosynaptic rabies-H2b-mCherry labeling via AgRP neurons in several brain regions known to contain afferents to AgRP neurons and Glp1r+ neurons. The Arc and DMH contained the highest densities of rabies-labeled Glp1r+ afferents to AgRP neurons (n=4 mice).
Extended Data Fig. 2.
Extended Data Fig. 2.. Schematic of Data Processing Pipeline.
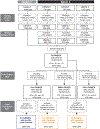
Summary of filtering and Seurat cell clustering parameters. %mito, percent of reads from mitochondrial genes. PCs, principal components. Res, resolution. nFeature, number of unique genes detected. Hashtag, tissue sample-specific molecular barcode. Confidence, cell type prediction score based on label transfer from reference dataset.
Extended Data Fig. 3.
Extended Data Fig. 3.. Quality Control and Identification of Arc, DMH, and PVH Cells.
A, Table of sample metadata and corresponding color labels (note, hashtag oligonucleotides, HTOs, were not used for batch 1). B, UMAP of all RAMPANT cells after initial quality control filtering, colored by cluster ID. C, Same UMAP as in panel A but colored according to sample (see panel A for color key). D, Same UMAP as in panel A but colored according to Arc, DMH, or PVH HTO. E, HTO composition of each cell cluster shown in panel a; batch 1 cells, which were not hashtagged and so lack HTOs, are indicated in gray. F, Same UMAP as in panel A but colored to indicate Trh gene expression. G, Same UMAP as in panel A but colored to indicate Trh gene expression. H, Glp1r and Lepr expression in all-rabies clusters.
Extended Data Fig. 4.
Extended Data Fig. 4.. Characterization and Identification of Arc Neuron Subtypes.
A, Expression of select genes of interest among Arc neuron subtypes from a previous publication. Neuron subtypes detected in RAMPANT analysis of AgRP neurons and their afferents are indicated in bold magenta. Dot size indicates the percentage of cells in that cluster in which the gene was detected, whereas the color represents the gene expression level after log normalization and scaling. B, UMAP of Arc rabies+ cells after transferring cell-type labels from HypoMap reference atlas of Arc neuron subtypes. C, Prediction score of transferred HypoMap cell-type labels after filtering out cells with low prediction scores (<0.5). D, Correspondence between cell-type labels transferred from HypoMap reference atlas and Arc-ME reference atlas.
Extended Data Fig. 5.
Extended Data Fig. 5.. Identification of Rabies-Infected Cells by HypoMap Label Transfer.
A, UMAP of all rabies+ cells after transferring cell-type labels from the mouse HypoMap reference atlas and filtering out cells with low prediction scores (<0.5). B, Prediction scores for assigning a cell type to each rabies+ cell by HypoMap label transfer. C, Correspondence between de novo clusters of all rabies+ cells and cell-type assignments from HypoMap label transfer. Each line represents a single cell, with its de novo cluster ID and HypoMap cluster ID on the left and right side, respectively. D, UMAP of all rabies+ cells after transferring regional labels from the mouse HypoMap reference dataset and filtering out cells with low prediction scores (<0.5).
Extended Data Fig. 6.
Extended Data Fig. 6.. Body Weights After Viral Injections and Feeding Conditions; Co-Localization of Agrp and Trh RNA in the Arc.
A, Body weight in fasted group after injection of helper AAV and rabies, and before and after fasting (n=9 mice). B, Body weight in ad libitum fed group after injection of helper AAV and rabies, and before and after night of ad libitum feeding (n= 9 mice). C, Body weight in post-fast re-fed group after injection of helper AAV and rabies, and before and after fasting and re-feeding (n= 11 mice). D, Agrp and Trh RNA FISH in the Arc indicates that AgRP neurons and TrhArc neurons are essentially distinct populations (n=289 cells from 4 mice).
Extended Data Fig. 7.
Extended Data Fig. 7.. Additional Occlusion and Loss-of-Function Studies.
A, Left, schematic of unilateral injection of Cre-dependent AAV-ChR2 to caudal TrhArc neurons and optical fiber implant over the caudal Arc in Trh-Cre mice and unilateral injection of Flp-inducible AAV-hM4Di to rostral NpyArc neurons. Right, representative image of NpyArc hM4Di-mCherry expression and TrhArc ChR2-eYFP expression and caudal fiber implant location. B, Average post-fast food intake during TrhArc-ChR2 concurrent photostimulation and/or NpyArc inhibition (n=8 for TrhArc;Npy mice, males and females, repeated-measures two-way ANOVA, time × condition: F (9, 84) = 9.75, p<0.0001, Tukey’s multiple comparisons). C, Overnight food intake following acute liraglutide injection at baseline (pre-TeNT) and post-TeNT in TrhArc-TeNT and wildtype (WT) littermates bilaterally injected with Cre-inducible AAV-eGFP-2a-TeNT (n=11 for TrhArc-TeNT, n=11 for WT-TeNT, males and females, RM two-way ANOVA, Time × Condition: F (1, 20) = 12.97, p<0.002, Tukey’s multiple comparisons). D, Body weight change over 1 week of daily liraglutide administration in TrhArc-TeNT and wildtype (WT) littermates bilaterally injected with Cre-inducible AAV-eGFP-2a-TeNT, or daily vehicle injection in WT and Trh-Cre littermates bilaterally injected with a Cre-inducible AAV-eGFP (n=9 for TrhArc-TeNT, n=8 for WT-TeNT, n=7 for TrhArc-GFP, n=7 for WT-GFP, males and females). E, Daily kcal consumption over 1 week of daily liraglutide administration in TrhArc-TeNT and wildtype (WT) littermates bilaterally injected with Cre-inducible AAV-eGFP-2a-TeNT, or daily vehicle injection in WT and TrhArc littermates bilaterally injected with a Cre-inducible AAV-eGFP (n=9 for TrhArc-TeNT, n=8 for WT-TeNT, n=7 for TrhArc-GFP, n=7 for WT-GFP, males and females). F, Average body weight change over time in TrhArc-TeNT and wildtype (WT) littermates bilaterally injected with Cre-inducible AAV-eGFP-2a-TeNT (n=17 for TrhArc-TeNT, n=17 for WT-TeNT, males and females). G, Average weekly chow intake over time in TrhArc-TeNT and wildtype (WT) littermates bilaterally injected with Cre-inducible AAV-eGFP-2a-TeNT (n=17 for TrhArc-TeNT, n=17 for WT-TeNT, males and females, two-way ANOVA, Time × Condition: F (8, 248) = 2.8, p=0.005, Tukey’s multiple comparisons). All error bars represent standard error of the mean (SEM). *p<0.05, **p<0.01, ***p<0.001, ****p<0.0001.
Figure 1 -
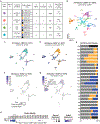
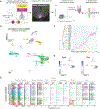
Figure 1 -. RAMPANT Identifies Transcriptionally Distinct Afferents To AgRP Neurons.
A, Schematic of RAMPANT method (n=41 mice). B, UMAP (uniform manifold approximation and projection) plot of 4,428 rabies+ cell nuclei from the arcuate hypothalamus, clustered by expression of high-variance genes and colored according to cluster identity. C, (left) Dendrogram illustrating relatedness of 17 cell clusters; (right) heatmap visualizing expression of genes significantly enriched in each cell cluster. D, UMAP recolored to illustrate expression levels of the AgRP neuron marker genes, Agrp and Npy. E, Violin plots showing expression of the following: quality control metrics (number of genes, nGenes; number of unique molecular identifiers, nUMI; percentage of reads from mitochondrial genes, %mito); neuronal marker genes (Syn1, NeuN/Rbfox3); oligodendrocyte marker gene (Olig1); macrophage marker gene (Aif1); astrocyte marker genes (Gfap, Agt); excitatory neuron marker gene (Slc17a6); and inhibitory neuron marker genes (Slc32a1, Gad1, Gad2).
Figure 2 -
Figure 2 -. Molecular and Functional Features of AgRP Neurons Five Days After Rabies Infection.
A, Schematic for comparing gene expression between AgRP neurons infected with AAV-only or with AAV and rabies (AAV+rabies; n=26 AAV+rabies mice, n= 5 AAV-only mice). B, Violin plots comparing prediction scores for AAV-only cells vs. AAV+rabies cells mapping to the AgRP neuron cluster from the reference dataset. C, Volcano plot of genes differentially expressed to a significant extent between AAV-only AgRP neurons and AAV+Rabies AgRP neurons (328 DE genes; Wilcoxon rank-sum test with Bonferroni correction). D, Violin plots comparing AAV-only AgRP neurons and AAV+Rabies AgRP neurons in terms of their expression of the AgRP neuron marker genes Agrp, Npy, and Npy2r. E, Venn diagram showing overlap of AgRP neuron marker genes (positive and negative) and genes significantly altered by rabies in AgRP neurons. F, For each AgRP neuron marker gene altered by rabies, its enrichment in AgRP neurons and non-AgRP Arc neurons compared to its alteration by rabies infection in AgRP neurons. For instance, the top right quadrant (Q1) contains genes significantly enriched in AgRP neurons which are upregulated by rabies. G, Pie graph of the number of genes per quadrant in Figure 2F as a percentage of the total number of AgRP neuron marker genes significantly affected by rabies. H, Representative images of Agrp and Fos RNA FISH in rabies-infected Arc cells after overnight fasting or ad libitum feeding. I, Comparison of Fos RNA+ rabies-infected AgRP neurons between fed and fasted mice (n=4 per condition); unpaired Student’s t test (two-tailed), t=6.701, df=6, *** p=0.0005.
Figure 3 -
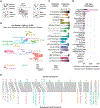
Figure 3 -. Molecular Subtypes of Rabies-Infected Arc Neurons Predicted by Label Transfer.
A, Schematic of method for transferring labels from a reference single-cell RNA-seq dataset to rabies+ cells. B, UMAP plot of 3,593 Arc rabies+ cell transcriptomes clustered by expression of highly variable genes and colored by cell-type label transferred from a reference transcriptomic atlas of Arc neuron subtypes. C, Violin plots of cell type prediction scores from mapping rabies+ cells to the reference atlas dataset. D, Distribution of rabies+ Arc neurons and reference Arc neurons across Arc neuron subtypes. E, River plot of relationship between de novo cell clusters and reference-labeled cell clusters.
Figure 4 -
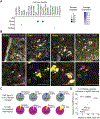
Figure 4 -. Validation of RAMPANT Cell-Type Predictions by RNA FISH.
A, Dot plot showing cluster-level expression of Trh, Pomc, Ghrh, and Slc6a3. B, Expression of Slc6a3, Ghrh, Pomc, and Trh transcripts (yellow) and rabies H2b-mCherry fluorescence (magenta) in Arc cells (n=3 mice). Top row imaged at 20x magnification; bottom row imaged at 63x magnification. C, (top) Pie charts of four cell clusters as percentages of the Arc RAMPANT dataset; (bottom) Pie charts of four cell-type markers as a percentage of cells after rabies labeling via AgRP neurons. D, Correlation between the percentages shown in the top and bottom pie charts in Figure 4C.
Figure 5 -
Figure 5 -. RAMPANT Characterizes the Transcriptional Response To Metabolic Challenges.
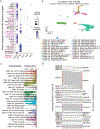
A, Timeline of virus injections and metabolic challenges; RF, re-feeding (n=8 fed mice, n=8 fasted mice, n=10 refed mice). B, Pie chart showing number of rabies-infected AgRP neurons per feeding condition. C, Comparison of log2 fold-change values in fasting-sensitive gene expression between the current study and ref.. D, (left) Volcano plot of genes differentially expressed between fed and fasted rabies-infected AgRP neurons (134 DE genes; consensus between Wilcoxon rank-sum test with Bonferroni correction and MAST); (right) volcano plot of genes differentially expressed between fasted and refed rabies-infected AgRP neurons (170 DE genes; consensus between Wilcoxon rank-sum test with Bonferroni correction and MAST). E, Fasting and refeeding oppositely regulate expression levels of 50 genes in AgRP neurons; “fasted/fed” indicates log2 fold-change in expression from fed to fasted, whereas “refed/fasted” indicates log2 fold-change in expression from fasted to refed. F, Enriched gene ontology categories among the 50 genes oppositely regulated by fasting and refeeding in rabies-infected AgRP neurons. G, Pie chart showing distribution of rabies-infected n11.Trh/Cxcl12 neurons per feeding condition. H, Volcano plot of genes differentially expressed between fed and fasted rabies-infected n11.Trh/Cxcl12 neurons (left panel; 19 DE genes; consensus between Wilcoxon rank-sum test with Bonferroni correction and MAST); volcano plot of genes differentially expressed between fasted and refed rabies-infected n11.Trh/Cxcl12 neurons (right panel; 38 DE genes; consensus between Wilcoxon rank-sum test with Bonferroni correction and MAST).
Figure 6 -
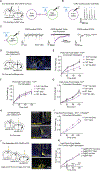
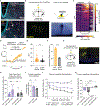
Figure 6 -. TrhArc Neurons Suppress Appetite by Inhibiting AgRP Neurons.
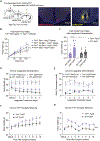
A, Left, schematic of unilateral viral delivery of Cre-dependent AAV-ChR2 to caudal TrhArc neurons (TrhArc-ChR2) and electrophysiological recordings of rostral NPY-hrGFP neurons (~AgRP neurons) in Trh-Cre;Npy-hrGFP mice. Right, schematic of channelrhodopsin-assisted circuit mapping (CRACM). B, Representative trace of ChR2 light-evoked action potentials in caudal TrhArc-ChR2 neurons. C, Representative trace of ChR2 light-evoked IPSCs in NPY-hrGFP+ Arc neurons in the absence or presence of the GABA antagonist picrotoxin (n=20 cells from a total of 3 mice). D, Left, schematic of unilateral injection of Cre-dependent AAV-ChR2 to caudal TrhArc neurons and optical fiber implant over the caudal Arc in Trh-Cre mice. Right, representative image of TrhArc ChR2-eYFP expression and caudal fiber implant location. E, Average post-fast food intake during TrhArc-ChR2 concurrent photostimulation (n=14 for TrhArc, n=8 for wildtype, males and females, repeated-measures two-way ANOVA, time × condition: F (9, 120) = 5.97, P<0.0001, Tukey’s multiple comparisons). F, Average post-fast food intake during TrhArc-ChR2 pre-photostimulation (n=12 for TrhArc-ChR2, n=8 for wildtype, males and females, repeated-measures two-way ANOVA, time × condition: F (9, 108) = 0.67, P=0.74). G, Average dark cycle food intake during TrhArc-ChR2 concurrent photostimulation (n=9 for TrhArc-ChR2, n=7 for wildtype, males and females, repeated-measures two-way ANOVA, time × condition: F (9, 84) = 2.09, P=0.04). H, Left, schematic of unilateral delivery of Cre-dependent AAV-ChR2 to caudal TrhArc neurons and optical fiber implant over the rostral Arc in Trh-Cre mice. Right, representative images of TrhArc ChR2-eYFP expression and rostral Arc fiber implant location. I, Within-subject quantification of average post-fast food intake during rostral Arc TrhArc-ChR2 concurrent photostimulation versus no stimulation (n=6, males and females, repeated-measures two-way ANOVA, Condition: F (1, 10) = 7.96, P=0.02). J, Left, schematic of unilateral delivery of Cre-dependent AAV-ChR2 to Agrp-Cre and Trh-Cre Arc neurons and optical fiber implant over the rostral Arc in Agrp-Cre;Trh-Cre mice. Right, representative images of AgRP ChR2-eYFP and TrhArc ChR2-eYFP expression in rostral and caudal Arc neurons, respectively, and fiber implant location in the rostral Arc. K, Average light cycle food intake during either AgRP-ChR2 or both AgRP-ChR2 and TrhArc-ChR2 concurrent photostimulation (n=7, males and females, repeated-measures two-way ANOVA, time × condition: F (9, 72) = 31.59, P<0.0001, Tukey’s multiple comparisons). All error bars of E-G, I, and K represent standard error of the mean (SEM). *P<0.05 **P<0.01 ***P<0.001.
Figure 7 -
Figure 7 -. TrhArc Neurons Respond to and are Necessary for GLP-1R Agonists Effects.
A, Representative image of Glp1r and Trh RNA FISH in the Arc, with arrows indicating co-expressing cells in the lower panel (percentage based on n=901 cells from 4 mice). B, Top, brain schematic of bilateral viral delivery of Cre-dependent GCaMP6s to caudal TrhArc neurons in Trh-Cre mice. Bottom, representative image of GCaMP6s expression in caudal TrhArc neurons. C, Heatmap of individual TrhArc neuron ΔF/F responses to liraglutide (100 nM) application and KCl (10 mM). Liraglutide scale bar for minutes 0 to 15, KCl scale bar for minutes 15 to 20 (n=90 cells/3 slices/3 mice, males and females). D, Averaged individual traces of TrhArc neuron ΔF/F responses to liraglutide followed by KCl vs. saline application (n=90 cells/3 slices/3 mice for liraglutide, n=64 cells/3 slices/3 mice for saline). E, Quantification of max ΔF/F responses of TrhArc neurons to liraglutide or saline application (n=3 for liraglutide, n=3 for saline, unpaired t-test (two-tailed), p=0.0064). F, Percentage of responsive cells per slice (n=3 for liraglutide, n=3 for saline, unpaired t-test (two-tailed), p=0.0003). G, Left, brain schematic of bilateral viral delivery of Cre-dependent AAV-eGFP-2a-TeNT to caudal Arc neurons in Trh-Cre mice. Right, representative image of TrhArc-eGFP-2a-TeNT expression in caudal Arc neurons. H, Overnight food intake following acute liraglutide injection, calculated as the percentage of food intake following saline injection at the corresponding time-point, baseline (pre-TeNT) vs post-TeNT (n=11 for TrhArc-TeNT, n=11 for WT-TeNT, males and females, RM two-way ANOVA, Time × Condition: F (1, 10) = 6.98, p=0.02, Tukey’s multiple comparisons). I, Average daily kcal consumption over 1 week of daily liraglutide administration in TrhArc-TeNT and WT littermates bilaterally injected with Cre-inducible AAV-eGFP-2a-TeNT (n=9 for TrhArc-TeNT, n=8 for WT-TeNT,males and females, unpaired t-test (two-tailed), p=0.03). J, Total percentage body weight change over 1 week of daily liraglutide administration in TrhArc-TeNT and WT littermates bilaterally injected with Cre-inducible AAV-eGFP-2a-TeNT, or daily vehicle administration in WT and TrhArc littermates bilaterally injected with a Cre-inducible AAV-eGFP (n=9 for TrhArc-TeNT, n=8 for WT-TeNT, n=7 for WT-GFP, n=7 for TrhArc-GFP, males and females, two-way ANOVA, Time × Condition: F (18, 162) = 4.058, p<0.0001, Tukey’s multiple comparisons). K, Average body weight change over 1 week of daily liraglutide administration in TrhArc-TeNT and WT littermates bilaterally injected with Cre-inducible AAV-eGFP-2a-TeNT, or daily vehicle administration in WT and TrhArc littermates bilaterally injected with a Cre-inducible AAV-eGFP (n=9 for TrhArc-TeNT, n=8 for WT-TeNT, n=7 for WT-GFP, n=7 for TrhArc-GFP, males and females, one-way ANOVA, F(3,27) = 29.31, p<0.0001). All error bars and the shaded regions in panel D represent standard error of the mean (SEM). *p<0.05, **p<0.01, ***p<0.001, ****p<0.0001.
Figure 8 -
Figure 8 -. TrhArc Neurons Are Activated by Feeding, Signal Satiety, and Receive Mostly Local Input.
A, Representative images of Trh, Glp1r, and Fos RNA FISH colocalization in the Arc after overnight fasting, or overnight fasting plus 2 hr of re-feeding. B, The Fos mRNA+ percentage of Trh+/Glp1r+ Arc cells after fasting or post-fast re-feeding (n=5 for fasted, n= 5 for re-fed, males and females, unpaired Student’s t test (two-tailed), t=4.180, df=9; ** p=0.0024). C, Average body weight change over time normalized to baseline (“B”) body weight in TrhArc-TeNT and wildtype (WT) littermates bilaterally injected with Cre-inducible AAV-eGFP-2a-TeNT (n=17 for TrhArc-TeNT, n=16 for WT-TeNT, males and females, repeated-measures (RM) two-way ANOVA, time × condition: F (7, 70) = 3.00, p<0.0001). D, Average daily chow intake over time in TrhArc-TeNT and wildtype (WT) littermates bilaterally injected with Cre-inducible AAV-eGFP-2a-TeNT (n=17 for TrhArc-TeNT, n=16 for WT-TeNT, males and females, repeated-measures two-way ANOVA, time × condition: F (8, 80) = 7.73, p<0.0001). E, Schematic of bilateral viral delivery of Cre-dependent TVA helper AAV and rabies virus to caudal TrhArc neurons in Trh-Cre mice. F, Representative images of TVA helper AAV (yellow) and rabies virus (magenta) in the caudal Arc and rabies virus in the DMH. G, Percentage of total rabies+ cells found in each region per mouse (n=3 mice, 1 slice per mouse). Arc, Arcuate; DMH, Dorsomedial Hypothalamus; DTM, Dorsal Tuberomammillary; PVH, Paraventricular Hypothalamus; VLPO/VMPO, Ventrolateral / Ventromedial Preoptic Nucleus; SCH, Suprachiasmatic Nucleus; MTN, Midline Group of the Dorsal Thalamus. All error bars represent standard error of the mean (SEM). **p<0.01, ***p<0.001, ****p<0.0001.

Update of

References

    1. Singh I et al. Activation of arcuate nucleus glucagon-like peptide-1 receptor-expressing neurons suppresses food intake. Cell Biosci 12, 178, doi: 10.1186/s13578-022-00914-3 (2022). - DOI - PMC - PubMed
    1. Sisley S et al. Neuronal GLP1R mediates liraglutide’s anorectic but not glucose-lowering effect. The Journal of clinical investigation 124, 2456–2463, doi: 10.1172/JCI72434 (2014). - DOI - PMC - PubMed
    1. Secher A et al. The arcuate nucleus mediates GLP-1 receptor agonist liraglutide-dependent weight loss. The Journal of clinical investigation 124, 4473–4488, doi: 10.1172/JCI75276 (2014). - DOI - PMC - PubMed
    1. Bruning JC & Fenselau H Integrative neurocircuits that control metabolism and food intake. Science 381, eabl7398, doi: 10.1126/science.abl7398 (2023). - DOI - PubMed
    1. Rupp AC et al. Suppression of food intake by Glp1r/Lepr-coexpressing neurons prevents obesity in mouse models. The Journal of clinical investigation 133, doi: 10.1172/JCI157515 (2023). - DOI - PMC - PubMed

MeSH terms

LinkOut - more resources