. 2024 Oct 28;27(12):111279.
doi: 10.1016/j.isci.2024.111279. eCollection 2024 Dec 20.

Dietary caloric restriction protects experimental autoimmune uveitis by regulating Teff/Treg balance

Affiliations

Dietary caloric restriction protects experimental autoimmune uveitis by regulating Teff/Treg balance

Zhaohuai Li et al. iScience. .

Abstract

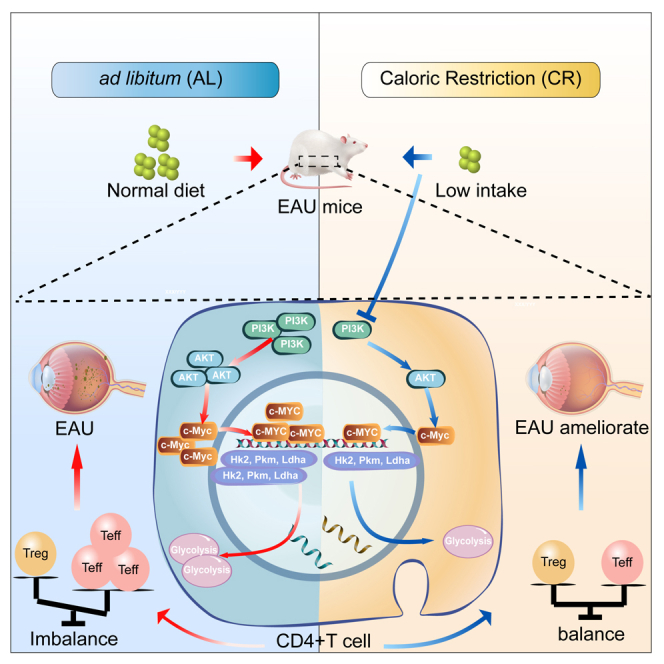
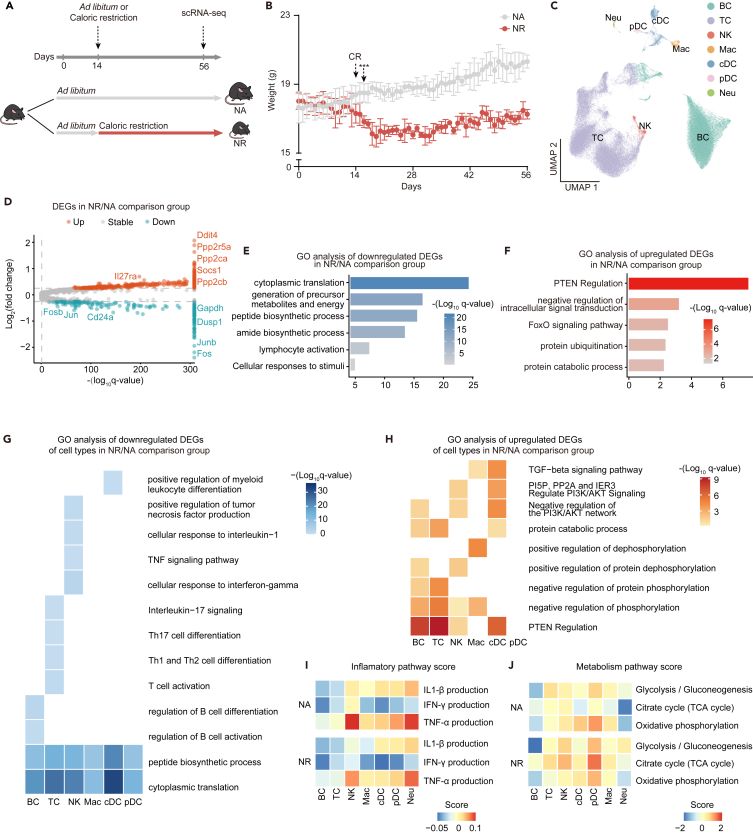
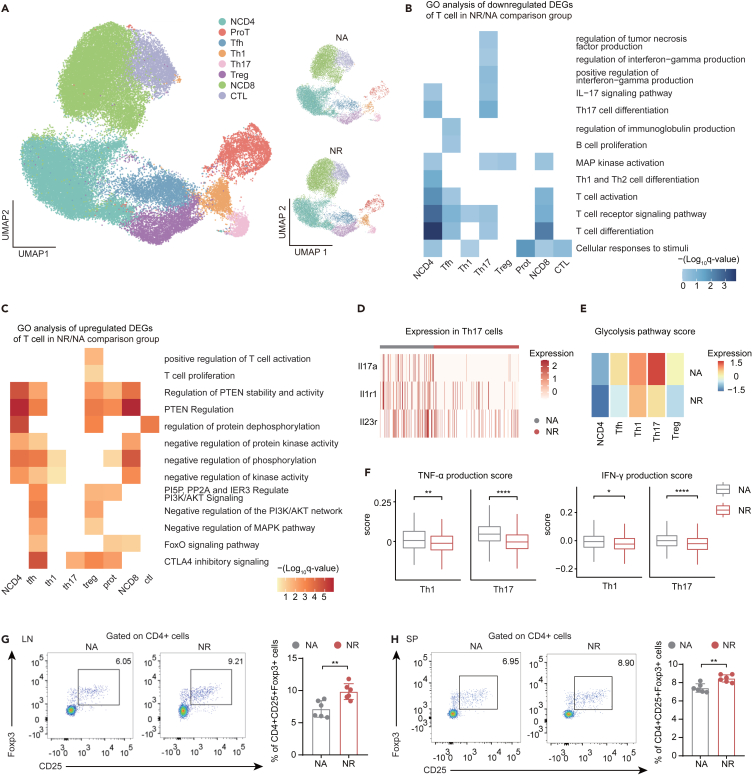
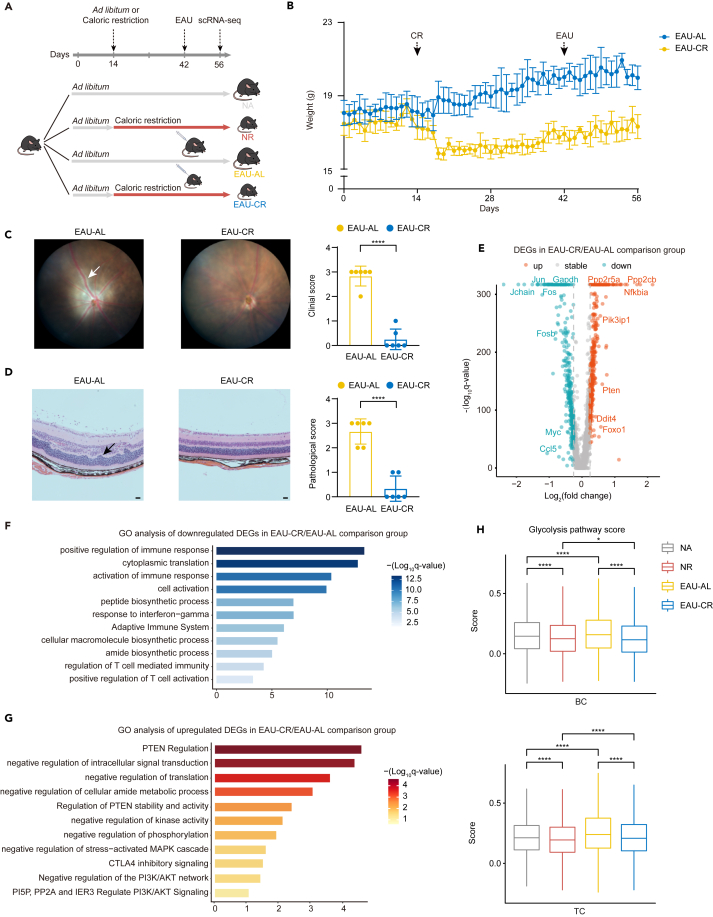
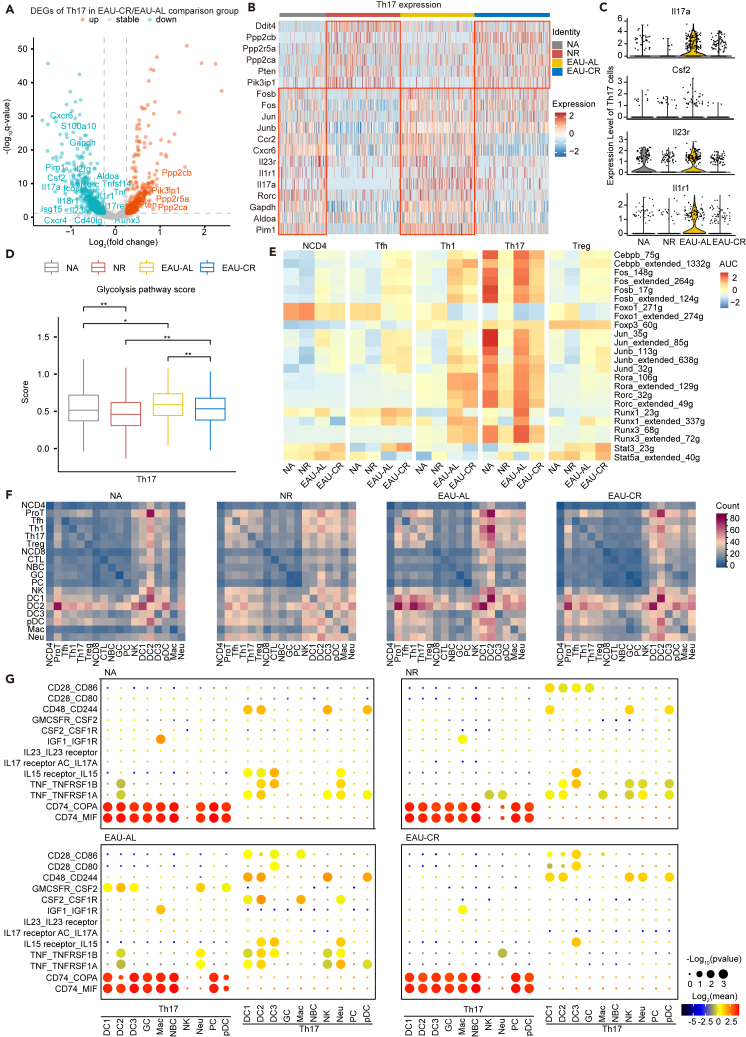
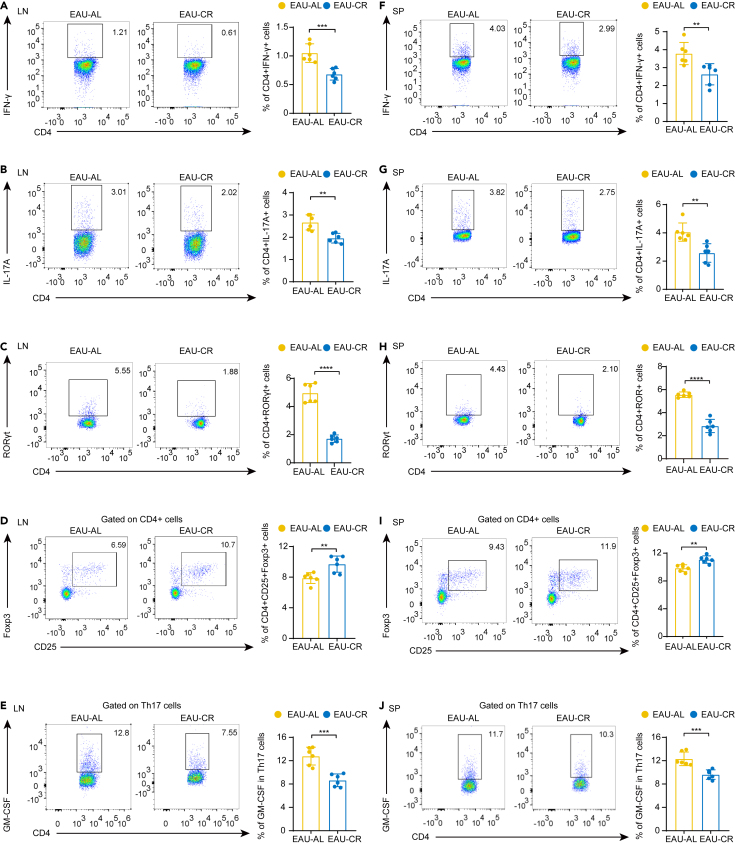
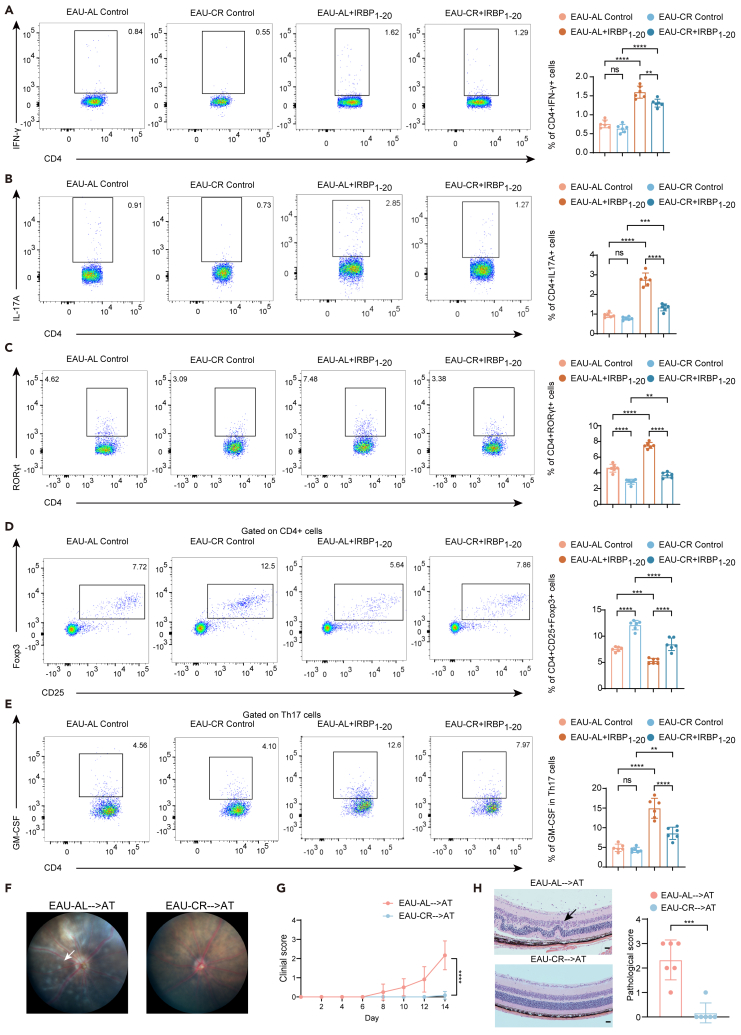
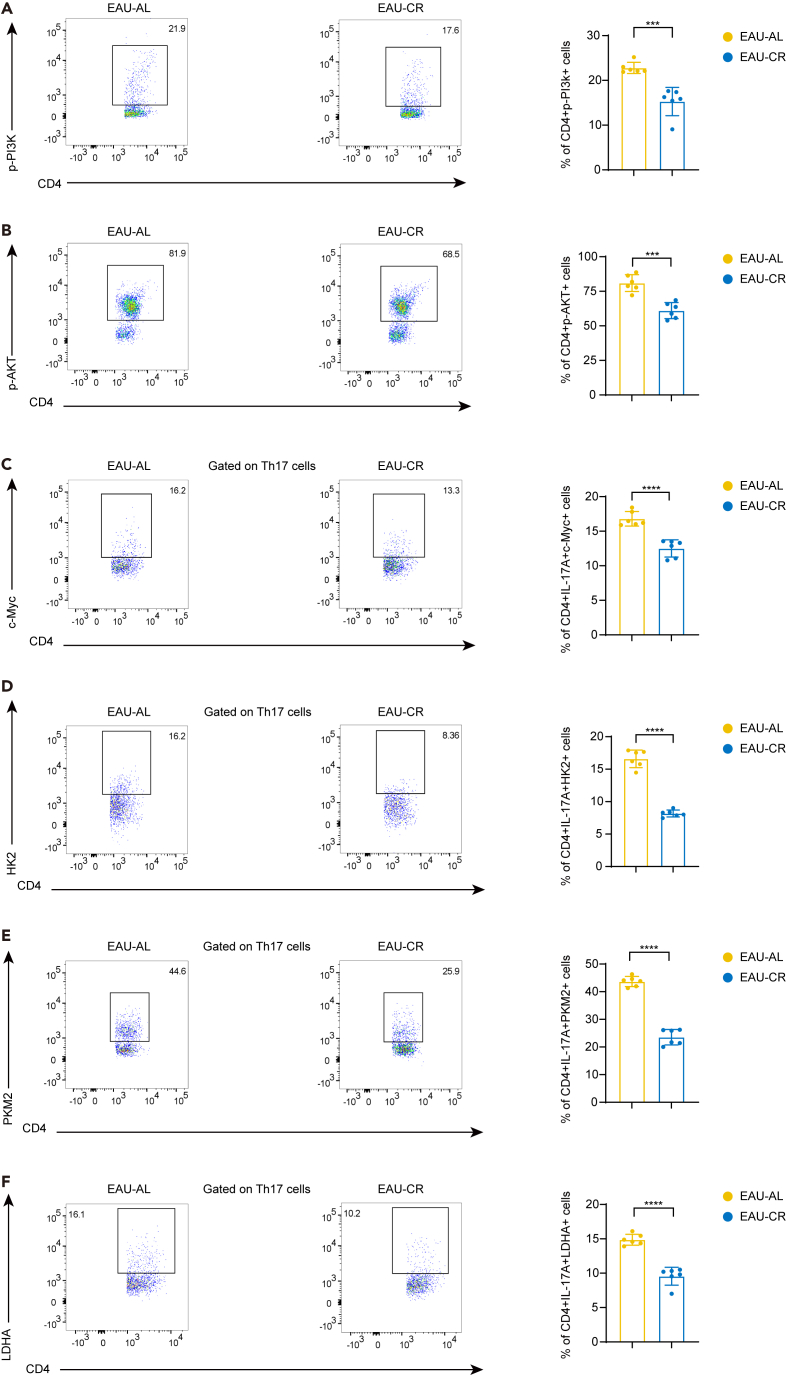
Uveitis, an autoimmune disease, often leads to blindness. CD4+ T cells, including regulatory T cells (Tregs) and effector T cells (Th1 and Th17), play a critical role in its pathogenesis. Caloric restriction (CR) has been shown to alleviate autoimmune diseases. However, careful characterization of the impact of CR on experimental autoimmune uveitis (EAU) is poorly understood. This study used single-cell RNA sequencing to analyze cervical draining lymph nodes in mice under ad libitum (AL) and CR diets, with or without EAU. CR increased Tregs, altered immune cell metabolism, reduced EAU symptoms, and downregulated inflammatory and glycolysis genes. Flow cytometry confirmed CR's inhibitory effect on Th1 and Th17 proliferation and its promotion of Treg proliferation. CR also balanced CD4+ T cells by inhibiting the PI3K/AKT/c-Myc pathway and reducing GM-CSF in Th17 cells. These findings suggest CR as a potential therapeutic strategy for autoimmune diseases.

Keywords: Diet; Immune response; Transcriptomics.


Conflict of interest statement

The authors declare no competing interests.

Figures

None
Graphical abstract
Figure 1
Figure 1
Study design and CR induces complicated and extensive changes in the immune profile of CDLNs (A) Schematic of the experimental design for single-cell RNA sequencing. CDLNs were harvested from normal (N) mice with ad libitum (A) or caloric restriction (R) diet. Samples were processed via scRNA-seq by using the 10x Genomics platform. (B) Line chart showing weights of NR and NA mice at different time points. (C) UMAP plot showing clusters of immune cell subsets. (D) Volcano plot showing upregulated and downregulated DEGs of all immune cell types in the NR/NA comparison group. Red and blue dots indicate upregulated and downregulated DEGs in NR group compared to NA group, respectively. (E and F) Representative GO terms and KEGG pathways enriched in downregulated (E) or upregulated (F) DEGs of total immune cells in the NR/NA comparison group. (G and H) Representative GO terms and KEGG pathways enriched in downregulated (G) or upregulated (H) DEGs of immune cell subsets in the NR/NA comparison group. (I) Heatmap showing average inflammation pathway scores of all immune cell types in NR and NA group. (J) Heatmap showing average metabolic pathway scores of all immune cell types in NR and NA group.
Figure 2
Figure 2
CR induces functional changes of T cell and B cell compartments in CDLNs (A) UMAP plot showing clusters of T cell subsets from NA and NR mice. (B and C) Representative GO terms and KEGG pathways enriched in downregulated (B) or upregulated (C) DEGs of T cell subsets in the NR/NA comparison group. (D) Heatmap showing expression of Il17a, Il1r1, and Il23r in Th 17 cells from NA and NR group. (E) Heatmap showing average glycolysis pathway scores of T cell subtypes in NR and NA group. (F) Boxplots showing TNF-α and IFN-γ production score in Th1 and Th17 cells from NA and NR group. Data are represented as mean ± SD. Significance was determined using Wilcoxon rank-sum test. ∗p < 0.05, ∗∗p < 0.01, ∗∗∗∗p < 0.0001. (G and H) Proportions of Treg cells from lymph nodes (LN) (G) or spleen (SP) (H) of NA and NR group were measured by flow cytometry. Each group contains six mice. Data are represented as mean ± SD. Significance was determined using unpaired two-tailed Student’s t test. ∗∗p < 0.01, ∗∗∗p < 0.001, ∗∗∗∗p < 0.0001.
Figure 3
Figure 3
Study design and CR mitigates EAU symptoms and alters immune cell response to EAU challenge (A) Schematic of the experimental design for single-cell RNA sequencing. CDLNs were harvested from normal (N) mice and EAU. (E) mice with ad libitum (AL) or caloric restriction (CR) diet. Samples were processed via scRNA-seq by using the 10x Genomics platform. (B) Line chart showing weights of EAU-CR and EAU-AL mice at different time points. (C) Representative fundus images and clinical scores of eyes from the EAU-AL and EAU-CR group after immunization at day 14. Each group contains six mice. Data are represented as mean ± SD. Significance was determined using unpaired two-tailed Student’s t test. ∗∗∗∗p < 0.0001. (D) Representative histopathological images (hematoxylin and eosin staining) and pathological scores of eyes from EAU-AL group and EAU-CR group after immunization at day 14. Each group contains six mice. Data are expressed as mean ± SD. Significance was determined using unpaired two-tailed Student’s t test. ∗∗∗∗p < 0.0001. Scale bars, 20 μm. (E) Volcano plot showing upregulated and downregulated DEGs of all immune cell types in the EAU-CR/EAU-AL comparison group. Red and blue dots indicate upregulated and downregulated DEGs in NR group compared to NA group, respectively. (F and G) Representative GO terms and KEGG pathways enriched in downregulated (F) or upregulated (G) DEGs of total immune cells in the EAU-CR/EAU-AL comparison group. (H) Boxplots showing average glycolysis pathway scores of BC and TC in NR, NA, EAU-CR, and EAU-AL group. Data are represented as mean ± SD. Significance was determined using Wilcoxon rank-sum test. ∗p < 0.05, ∗∗∗∗p < 0.0001.
Figure 4
Figure 4
CR-induced alterations in T cell subsets and cell-cell communication (A) Volcano plot showing upregulated and downregulated DEGs of Th17 cells in the EAU-CR/EAU-AL comparison group. Red and blue dots indicate upregulated and downregulated DEGs in NR group compared to NA group, respectively. (B) Heatmap showing gene expression in Th17 cells of NA, NR, EAU-AL, and EAU-CR group. (C) Violin plots showing the expression of Il17a, Csf2, Il23r, and Il1r1 in Th17 cells of NA, NR, EAU-AL, and EAU-CR group. (D) Boxplot showing average glycolysis pathway scores of Th17 cells in NR, NA, EAU-CR, and EAU-AL group. Data are represented as mean ± SD. Significance was determined using Wilcoxon rank-sum test. ∗p < 0.05, ∗∗p < 0.01. (E) Heatmap showing single-cell regulon scores inferred by SCENIC in T cell subtypes of NA, NR, EAU-AL, and EAU-CR group (g, genes; extended, SCENIC-annotated additional genes). (F) Heatmap showing the number of possible interactions between immune cells analyzed in NA, NR, EAU-AL and EAU-CR groups. (G) The interaction of Th17 cells with myeloid cells and B cells in NA, NR, EAU-AL and EAU-CR mice.
Figure 5
Figure 5
CR weakened Th17 pathogenicity (A–E) Proportions of Th1 cells (A), Th17 cells (B and C), regulatory T cells (Treg) (D) and GM-CSF+ Th17 cells (E) from LN of EAU-AL and EAU-CR group were measured by flow cytometry. Each group contains six mice. Data are represented as mean ± SD. Significance was determined using unpaired two-tailed Student’s t test. ∗∗p < 0.01, ∗∗∗p < 0.001. (F–J) Proportions of Th1 cells (F), Th17 cells (G and H), regulatory T cells (Treg) (I) and GM-CSF+ Th17 cells (J) from spleen (SP) of EAU-AL and EAU-CR group were measured by flow cytometry. Each group contains six mice. Data are represented as mean ± SD. Significance was determined using unpaired two-tailed Student’s t test. ∗∗p < 0.01, ∗∗∗p < 0.001.
Figure 6
Figure 6
CR weakened IRBP-specific Teff differentiation (A–E) CDLNs cells from EAU-AL and EAU-CR group cultured with or without IRBP1-20 for 72 h. Proportions of Th1 cells (A), Th17 cells (B and C), regulatory T cells (Treg) (D) and GM-CSF+ Th17 cells (E) of EAU-AL and EAU-CR group were measured by flow cytometry. Data are represented as mean ± SD from six independent experiments. Significance was determined using unpaired two-tailed Student’s t test. ∗∗p < 0.01, ∗∗∗p < 0.001, ∗∗∗∗p < 0.0001. (F) The representative fundus images after induction by CD4+ T cells from EAU-AL (EAU-AL-- > AT) or EAU-CR (EAU-CR-- > AT) groups after immunization at day 14. (G) Clinical scores of EAU-AL-- > AT and EAU-CR-- > AT groups (n = 6). Clinical scores significantly decreased (∗∗∗∗p < 0.0001) in EAU-CR-- > AT group compared to EAU-AL-- > AT group at day 14. Data are shown as mean ± SD from three independent experiments. Data were analyzed using unpaired student t tests. (H) The representative HE staining images and pathological scores after induction by CD4+ T cells from EAU-AL (EAU-AL-- > AT) or EAU-CR (EAU-->CR-AT) groups after immunization at day 14. Scale bars, 20 μm. Each group contains six mice. Significance was determined using unpaired Student’s t test. ∗∗∗p < 0.001.
Figure 7
Figure 7
CR repressed PI3K/AKT/c-Myc/glycolysis pathway (A–F) The proportions of CD4+ p-PI3K+ cells (A), CD4+p-AKT+ cells (B), CD4+IL-17A+c-Myc+ T cells (C), CD4+IL-17A + HK2+ T cells (D), CD4+IL-17A + PKM2+ T cells (E), and CD4+IL-17A+LDHA+ T cells (F) were measured by flow cytometry. Each group contains six mice. Data are represented as mean ± SD. Significance was determined using unpaired two-tailed Student’s t test. ∗∗∗p < 0.001, ∗∗∗∗p < 0.0001.

Similar articles

Cited by

References

    1. Wildner G., Diedrichs-Möhring M. Resolution of uveitis. Semin. Immunopathol. 2019;41:727–736. doi: 10.1007/s00281-019-00758-z. - DOI - PubMed
    1. Iwase A., Araie M., Tomidokoro A., Yamamoto T., Shimizu H., Kitazawa Y., Tajimi Study Group Prevalence and causes of low vision and blindness in a Japanese adult population: the Tajimi Study. Ophthalmology. 2006;113:1354–1362. doi: 10.1016/j.ophtha.2006.04.022. - DOI - PubMed
    1. Chong W.P., Horai R., Mattapallil M.J., Silver P.B., Chen J., Zhou R., Sergeev Y., Villasmil R., Chan C.C., Caspi R.R. IL-27p28 inhibits central nervous system autoimmunity by concurrently antagonizing Th1 and Th17 responses. J. Autoimmun. 2014;50:12–22. doi: 10.1016/j.jaut.2013.08.003. - DOI - PMC - PubMed
    1. Zeboulon N., Dougados M., Gossec L. Prevalence and characteristics of uveitis in the spondyloarthropathies: a systematic literature review. Ann. Rheum. Dis. 2008;67:955–959. doi: 10.1136/ard.2007.075754. - DOI - PubMed
    1. Tseng S.T., Yao T.C., Huang J.L., Yeh K.W., Hwang Y.S. Clinical manifestations in uveitis patients with and without rheumatic disease in a Chinese population in Taiwan. J. Microbiol. Immunol. Infect. 2017;50:798–804. doi: 10.1016/j.jmii.2015.10.007. - DOI - PubMed

LinkOut - more resources