. 2024 Oct 30;27(12):111291.
doi: 10.1016/j.isci.2024.111291. eCollection 2024 Dec 20.

The impact of a ketogenic diet on weight loss, metabolism, body composition and quality of life

Affiliations

The impact of a ketogenic diet on weight loss, metabolism, body composition and quality of life

Simon Hirschberger et al. iScience. .

Abstract

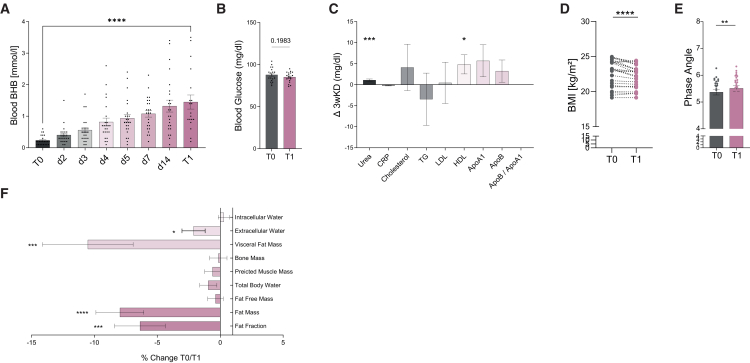
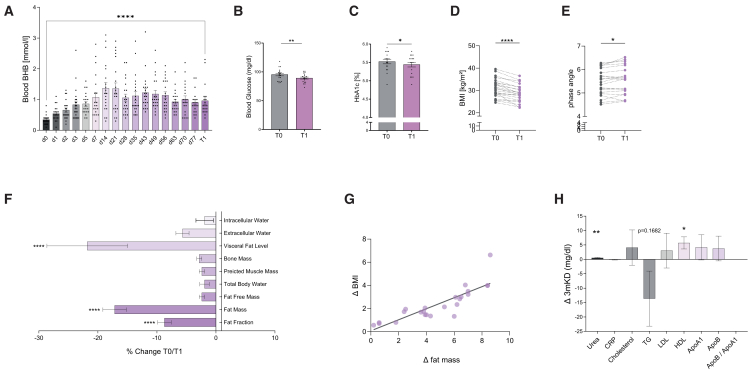
A ketogenic diet (KD) is increasingly debated as a countermeasure against nutrition-related modern diseases. While being immunologically beneficial, KD is still suspected of having severe metabolic side effects and negatively impacting general well-being, which prevents its widespread clinical use. We conducted a prospective pre-post interventional study investigating the effects of an eucaloric KD on metabolism, weight loss, body composition, diet adherence, and quality of life. The study had two stages: first, feasibility was tested in healthy, normal-weight participants over three weeks. After positive results, the KD period was expanded to three months, enrolling adults with overweight. Significant weight loss was observed in both groups, reducing body fat without affecting muscle or bone mass and without adverse metabolic changes. Quality of life improved, and fatigue symptoms in subjects with overweight decreased. These findings may help to overcome reservations about KD, encouraging its use as a medical tool for treating nutrition-related disorders.

Keywords: Diet; Human metabolism.


Conflict of interest statement

The authors declare no competing interests.

Figures

None
Graphical abstract
Figure 1
Figure 1
CONSORT recruitment flow diagram (A) CONSORT diagram for dietary study period of three weeks. (B) CONSORT diagram for dietwary study period of three months. 3wKD = three weeks ketogenic diet, 3mKD = three months ketogenic diet, WD = Western diet, KD = ketogenic diet.
Figure 2
Figure 2
Changes to serum metabolic markers and bioelectrical impedance in response to three-weeks ketogenic nutritional intervention (A and B) (A) Blood ketone body concentration quantified via point-of-care blood ketone strips and (B) fasting blood glucose prior to the start of the diet (T0) and at the end of the diet (T1). (C) Changes to metabolic parameters (T1-T0) as indicated. (D–F) Anthropometric data as indicated, collected via bioelectric impedance analysis prior to the start (T0) and at the end (T1) of three weeks KD. Data depicted as mean ± SEM (A, B, and E), change (mg/dL) T1-T0 (C), % change T1/T0 (F), and symbols and lines (D), with dots indicating individual values. n = 25. Paired t test or Wilcoxon matched-pairs signed rank test, as appropriate. Benjamini Hochberg multiple testing correction. ∗p < 0.05, ∗∗p < 0.01, ∗∗∗p < 0.001, ∗∗∗∗p < 0.0001, with FDR <10%.
Figure 3
Figure 3
Bioimpedance analysis of patients with overweight following three months KD (A) Blood ketone body concentration quantified via point-of-care blood ketone strips at the time points indicated. (B and C) (B)Fasting blood glucose and (C) HbA1c prior to the start of the diet (T0) and at the end of the three-month KD (T1). (D–F) Anthropometric data as indicated, collected via Bioelectric impedance analysis prior to the start (T0) and at the end (T1) of 3mKD. (G) Correlation analysis of BMI T0-T1 correlated to fat mass T0-T1, with linear regression line displayed. (H) Changes T1-T0 (mg/dL) to the indicated serum metabolic markers in response to nutritional intervention. Data depicted as mean ± SEM (A–C), symbols and lines (D and E), % change T1/T0 (F and H), and change (mg/dL) T1-T0 (H), n = 25. Paired t test or Wilcoxon matched-pairs signed rank test, as appropriate. Benjamini Hochberg multiple testing correction. ∗p < 0.05, ∗∗p < 0.01, ∗∗∗p < 0.001, ∗∗∗∗p < 0.0001, with FDR <10%.
Figure 4
Figure 4
Evaluation of fatigue symptoms of patients with overweight on a KD (A) Fatigue Assessment Scale (FAS), depicted for patients with overweight conducting 3mKD, T0 = at the start of the diet, T1 = at the end of the diet. Data depicted as boxplot with median, 25th and 75th percentiles with dots representing individual values, n = 20. Paired t test or Wilcoxon matched-pairs signed rank test, as appropriate. Benjamini Hochberg multiple testing correction. ∗p < 0.05, ∗∗p < 0.01, with FDR <10%. (B) Correlation analysis of FAS T0-T1 correlated to FAS T0, with linear regression line displayed.

References

    1. Puchalska P., Crawford P.A. Multi-dimensional Roles of Ketone Bodies in Fuel Metabolism, Signaling, and Therapeutics. Cell Metab. 2017;25:262–284. doi: 10.1016/j.cmet.2016.12.022. - DOI - PMC - PubMed
    1. Dilliraj L.N., Schiuma G., Lara D., Strazzabosco G., Clement J., Giovannini P., Trapella C., Narducci M., Rizzo R. The Evolution of Ketosis: Potential Impact on Clinical Conditions. Nutrients. 2022;14 doi: 10.3390/nu14173613. - DOI - PMC - PubMed
    1. Christ A., Lauterbach M., Latz E. Western Diet and the Immune System: An Inflammatory Connection. Immunity. 2019;51:794–811. - PubMed
    1. Hildebrandt X., Ibrahim M., Peltzer N. Cell death and inflammation during obesity: “Know my methods, WAT(son).”. Cell Death Differ. 2023;30:279–292. - PMC - PubMed
    1. Basolo A., Magno S., Santini F., Ceccarini G. Ketogenic Diet and Weight Loss: Is There an Effect on Energy Expenditure? Nutrients. 2022;14 doi: 10.3390/nu14091814. - DOI - PMC - PubMed

LinkOut - more resources