. 2024 Oct 28;27(12):111285.
doi: 10.1016/j.isci.2024.111285. eCollection 2024 Dec 20.

Circuit mechanism underlying fragmented sleep and memory deficits in 16p11.2 deletion mouse model of autism

Affiliations

Circuit mechanism underlying fragmented sleep and memory deficits in 16p11.2 deletion mouse model of autism

Ashley Choi et al. iScience. .

Abstract

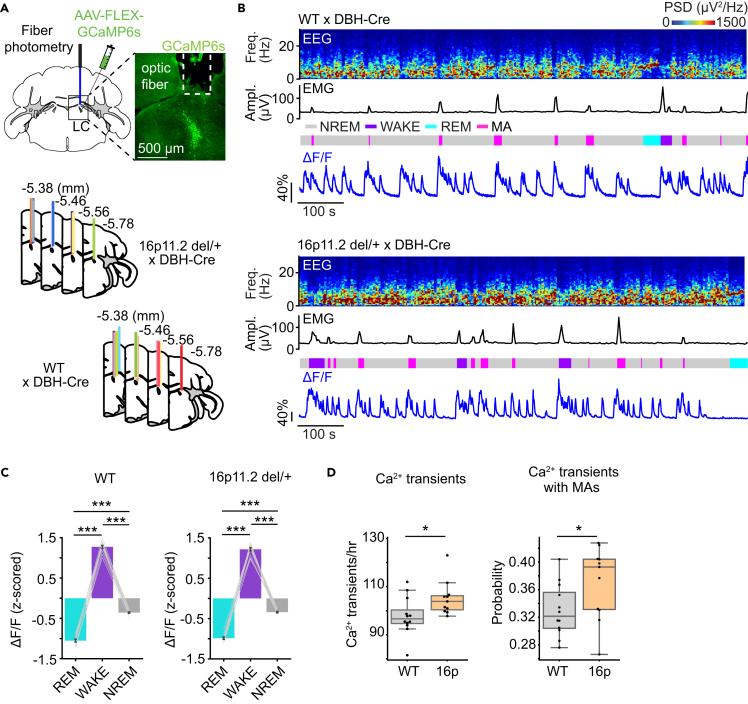
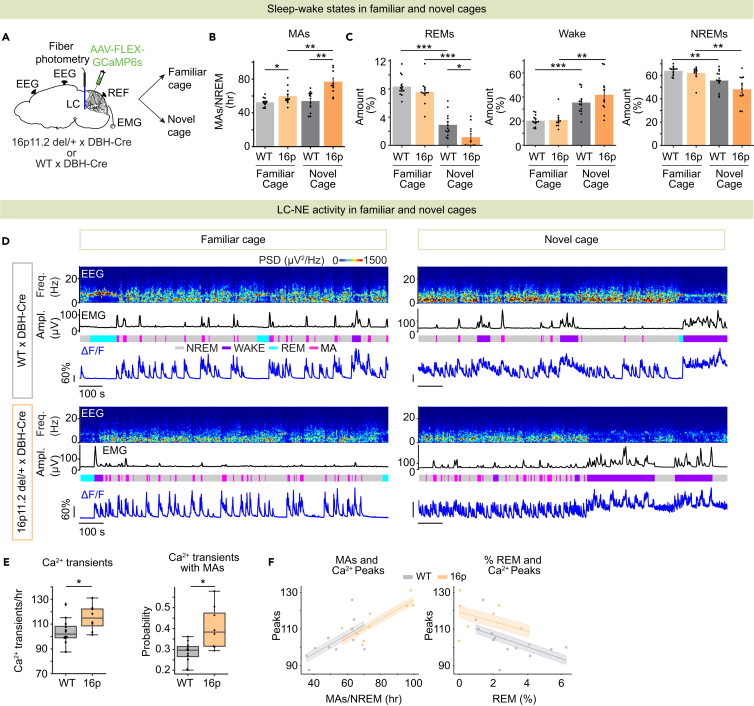
Sleep disturbances are prevalent in children with autism spectrum disorder (ASD). Strikingly, sleep problems are positively correlated with the severity of ASD symptoms, such as memory impairment. However, the neural mechanisms underlying sleep disturbances and cognitive deficits in ASD are largely unexplored. Here, we show that non-rapid eye movement sleep (NREMs) is fragmented in the 16p11.2 deletion mouse model of ASD. The degree of sleep fragmentation is reflected in an increased number of calcium transients in the activity of locus coeruleus noradrenergic (LC-NE) neurons during NREMs. In contrast, optogenetic inhibition of LC-NE neurons and pharmacological blockade of noradrenergic transmission using clonidine consolidate sleep. Furthermore, inhibiting LC-NE neurons restores memory. Finally, rabies-mediated screening of presynaptic neurons reveals altered connectivity of LC-NE neurons with sleep- and memory-regulatory regions in 16p11.2 deletion mice. Our findings identify a crucial role of the LC-NE system in regulating sleep stability and memory in ASD.

Keywords: Behavioral neuroscience; Cellular neuroscience; Molecular neuroscience.


Conflict of interest statement

The authors declare no competing financial interests.

Figures

None
Graphical abstract
Figure 1
Figure 1
16p11.2 del/+ mice exhibit fragmented sleep and impaired phase-coupling of sound-evoked arousals with infraslow σ rhythm (A) Schematic of EEG and EMG recordings in 16p11.2 del/+ mice and WT littermates (left). Example sessions from WT and 16p11.2 del/+ mouse (middle and right). Shown are EEG power spectra, EMG amplitude, and color-coded sleep-wake states. (B) Percentage of NREMs, duration and frequency of NREMs episodes during 24 h recordings. Black line represents the dark phase. (C) Number of MAs during NREMs. (D) Distribution of NREMs episodes depending on their episode duration. (E) Power spectral density (PSD) of normalized EEG σ power during NREMs. (F) Schematic illustrating sound-evoked arousals. During about half of the trials, mice stayed asleep (gray box) or transitioned to wake (pink box) after sound. Shown are EEG power spectra, EMG amplitude, color-coded sleep-wake states, and EEG and EMG raw traces during selected periods (dotted box, sound stimuli). Representative recordings are from a 16p11.2 del/+ mouse. (G) Percentage of sound-evoked arousals in WT and 16p11.2 del/+ mice. (H) Left, EEG σ power before sound-evoked arousal and sleep-through trials in WT mice. Middle and right, example sleep-through trial with rising EEG σ power and wake-up trial with falling EEG σ power in a WT mouse. Shown are EEG power spectra, EEG σ power, EMG raw traces and color-coded sleep-wake states. Dotted box, sound stimuli. Norm. σ value at −10 (s) indicates the averaged σ values from −10 to 0 s. (I) Left, EEG σ power before sound-evoked arousal and sleep-through trials in 16p11.2 del/+ mice. Middle and right, example sleep-through and wake-up trials in a 16p11.2 del/+ mouse. (B–E) n = 10 WT and 10 16p11.2 del/+ mice. (F–I) 16p11.2 del/+ mice crossed with B6129SF1/J mice or GAD2-Cre mice were used.n = 18 16p11.2 del/+ and 16p11.2 del/+ x GAD2-Cre mice and 13 WT and WTx GAD2-Cre mice. Bars and lines, averages across mice; dots, individual mice; error bars, SEM. t tests, ∗∗p < 0.01; ∗p < 0.05. See also Figure S1 and Table S1.
Figure 2
Figure 2
Increased activation of LC-NE neurons during NREMs in 16p11.2 del/+ mice (A) Schematic of fiber photometry with simultaneous EEG and EMG recordings in LC-NE neurons. Mouse brain figure adapted from the Allen Reference Atlas - Mouse Brain (atlas.brain-map.org). Top right, fluorescence image in a 16p11.2 del/+ x DBH-Cre mouse injected with AAV-FLEX-GCaMP6s into the LC. Scale bar, 500 μm. Bottom, location of optic fiber tracts. Each colored bar represents the location of optic fibers for photometry recordings. (B) Example fiber photometry recordings of LC-NE neurons in a WT x DBH-Cre (top) and a 16p11.2 del/+ x DBH-Cre mouse (bottom). Shown are EEG power spectra, EMG amplitude, color-coded sleep-wake states, and ΔF/F signal. (C) Z scored ΔF/F activity in WT x DBH-Cre and 16p11.2 del/+ x DBH-Cre mice. Bars, averages across mice; lines, individual mice; error bars, SEM. One-way rm ANOVA followed by pairwise t tests with Bonferroni correction, ∗∗∗p < 0.001. (D) Left, number of calcium transients in LC-NE neurons during NREMs. Right, proportion of calcium transients coinciding with MAs. Boxplots; dots, individual mice. t tests, ∗p < 0.05.n = 12 WT x DBH-Cre and 11 16p11.2 del/+ x DBH-Cre mice. See also Table S1.
Figure 3
Figure 3
Elevated activity of LC-NE neurons in novel environment leads to fragmented NREMs and reduced REMs in 16p11.2 del/+ mice (A) Schematic of fiber photometry with simultaneous EEG and EMG recordings in LC-NE neurons during exposure to a familiar or novel cage. (B) Number of MAs during NREMs in 16p11.2 del/+ x DBH-Cre and WT x DBH-Cre mice in the novel and familiar cages for 3 h recordings. (C) Percentage of time spent in REMs, wakefulness, and NREMs. (D) Example fiber photometry recordings of LC-NE neurons in a WT x DBH-Cre (top) and a 16p11.2 del/+ x DBH-Cre mouse (bottom) in familiar (left) and novel (right) cages. Shown are EEG power spectra, EMG amplitude, color-coded sleep-wake states, and ΔF/F signal. (E) Left, number of calcium transients in LC-NE neurons during NREMs in a novel cage. Right, proportion of calcium transients coinciding with MAs. Boxplots; dots, individual mice. (F) Correlation of the number of calcium transients with the number of MAs (left) or the amount of REMs (right). Shadings, SEM. (B and C) Bars, averages across mice; dots, individual mice; error bars, SEM. Mixed ANOVA followed by pairwise t tests with Holm correction. ∗∗∗p < 0.001; ∗∗p < 0.01; ∗p < 0.05 n = 11 16p11.2 del/+ x DBH-Cre and 13 WT x DBH-Cre mice. (E and F) t tests, ∗p < 0.05. n = 8 16p11.2 del/+ x DBH-Cre and 12 WT x DBH-Cre mice. See also Figure S2 and Table S1.
Figure 4
Figure 4
Optogenetic inhibition of LC-NE neurons reverses sleep fragmentation in 16p11.2 del/+ mice (A) Schematic of SwiChR++-mediated inhibition experiments and a fluorescence image of LC in a 16p11.2 del/+ x DBH-Cre mouse bilaterally injected with AAV-DIO-SwiChR++-eYFP into the LC. (B) Location of fiber tracts. Each colored bar represents the location of optic fibers. (C) Example sessions from eYFP- (top) or SwiChR++- (bottom) expressing 16p11.2 del/+ x DBH-Cre mouse with laser stimulation. Shown are EEG power spectra, EMG traces, and color-coded sleep-wake states. (D) Number of MAs during NREMs, percentage of NREMs, duration and frequency of NREMs episodes in eYFP- or SwiChR++- expressing 16p11.2 del/+ x DBH-Cre mice during the 6 h laser recordings. Bars, averages across mice; dots, individual mice; error bars, SEM. t tests, ∗∗∗p <0.001, ∗∗ p <0.01. n = 11 eYFP-16p11.2 del/+ x DBH-Cre and 10 SwiChR-16p11.2 del/+ x DBH-Cre mice. See also Figures S3, S4 and Table S1.
Figure 5
Figure 5
Optogenetic inhibition of LC-NE neurons restores memory in 16p11.2 del/+ mice (A) Schematic of SOR task in WT and 16p11.2 del/+ mice. (B) Preference (%) for a moved object during training and testing sessions in WT and 16p11.2 del/+ mice (left and middle). Preference (%) is calculated as (Tnovellocation)(Tfamiliarlocation+Tnovellocation)x100. Discrimination ratio (right) is calculated as (TnovellocationTfamiliarlocation)(Tfamiliarlocation+Tnovellocation). n = 6 WT and 6 16p11.2 del/+ mice. (C) Schematic of SOR task combined with SwiChR++-mediated LC-NE inhibition. (D) Effect of LC-NE inhibition on SOR memory in WT x DBH-Cre mice. n = 11 eYFP- WT x DBH-Cre and 5 SwiChR - WT x DBH-Cre mice. (E) Effect of LC-NE inhibition on SOR memory in 16p11.2 del/+ x DBH-Cre mice. n = 5 eYFP-16p11.2 del/+ x DBH-Cre and 10 SwiChR-16p11.2 del/+ x DBH-Cre mice. Bars, averages across mice; dots and lines, individual mice; error bars, SEM. Unpaired and paired t tests, ∗∗p < 0.01; ∗p < 0.05.See also Figure S5 and Table S1.
Figure 6
Figure 6
Presynaptic input distributions and electrophysiological properties of LC-NE neurons in 16p11.2 del/+ mice (A) Schematic illustration of rabies-mediated tracing of monosynaptic inputs to LC-NE neurons. AAVs expressing Cre-dependent mutant EnvA receptor fused with mCherry (TC66T) and Cre-dependent rabies glycoprotein (GP) were injected into the LC of 16p11.2 del/+ x DBH-Cre and WT x DBH-Cre mice. 12 days later, we injected EnvA-pseudotyped, G-deleted, and GFP expressing rabies virus (RVdG-GFP). Starter cells co-express TC66T and GFP (right). Scale bar, 100 μm. (B) Proportion of RV-GFP labeled inputs to LC-NE neurons across brain regions defined by the Allen Reference Atlas - Mouse Brain (atlas.brain-map.org). Proportion of input cells (%) was calculated by dividing the number of RV-GFP labeled neurons found in a specific brain region by the total number of input neurons. Bars, average across mice; dots, individual mice; error bars, SEM n = 3 mice. Bootstrap, ∗∗∗p < 0.001; ∗p < 0.05. (C) GFP-labeled input neurons in the cortex (CTX), lateral hypothalamic area (LHA), hippocampus (HPF) and ventral medulla (VM, the shown image contains the magnocellular reticular nucleus and paragigantocellular reticular nucleus within the medulla) of 16p11.2 del/+ x DBH-Cre and WT x DBH-Cre mice. Scale bar, 250 μm. (D) Example firing patterns of LC-NE neurons in response to current injections (10 and 50 pA). Baseline membrane potential = −60 mV. (E) Firing frequencies of LC-NE neurons in WT (29 cells from 4 animals) and 16p11.2 del/+ (26 cells from 4 animals) mice plotted against the injected currents. Two-way ANOVA (cell type and current step as two factors). ∗p < 0.05. Data are shown as mean ± SEM. See also Figure S6 and Table S1.

Update of

References

    1. Goodlin-Jones B.L., Tang K., Liu J., Anders T.F. Sleep patterns in preschool-age children with autism, developmental delay, and typical development. J. Am. Acad. Child Adolesc. Psychiatry. 2008;47:930–938. doi: 10.1097/CHI.ObO13e3181799f7c. - DOI - PubMed
    1. Richdale A.L., Schreck K.A. Sleep problems in autism spectrum disorders: prevalence, nature, & possible biopsychosocial aetiologies. Sleep Med. Rev. 2009;13:403–411. doi: 10.1016/j.smrv.2009.02.003. - DOI - PubMed
    1. Souders M.C., Mason T.B.A., Valladares O., Bucan M., Levy S.E., Mandell D.S., Weaver T.E., Pinto-Martin J. Sleep behaviors and sleep quality in children with autism spectrum disorders. Sleep. 2009;32:1566–1578. doi: 10.1093/sleep/32.12.1566. - DOI - PMC - PubMed
    1. Taylor M.A., Schreck K.A., Mulick J.A. Sleep disruption as a correlate to cognitive and adaptive behavior problems in autism spectrum disorders. Res. Dev. Disabil. 2012;33:1408–1417. doi: 10.1016/j.ridd.2012.03.013. - DOI - PubMed
    1. Limoges É., Bolduc C., Berthiaume C., Mottron L., Godbout R. Relationship between poor sleep and daytime cognitive performance in young adults with autism. Res. Dev. Disabil. 2013;34:1322–1335. doi: 10.1016/j.ridd.2013.01.013. - DOI - PubMed

LinkOut - more resources