. 2024 Oct 29;27(12):111283.
doi: 10.1016/j.isci.2024.111283. eCollection 2024 Dec 20.

Distinct effects of sacituzumab govitecan and berzosertib on DNA damage response in ovarian cancer

Affiliations

Distinct effects of sacituzumab govitecan and berzosertib on DNA damage response in ovarian cancer

Jayakumar R Nair et al. iScience. .

Abstract

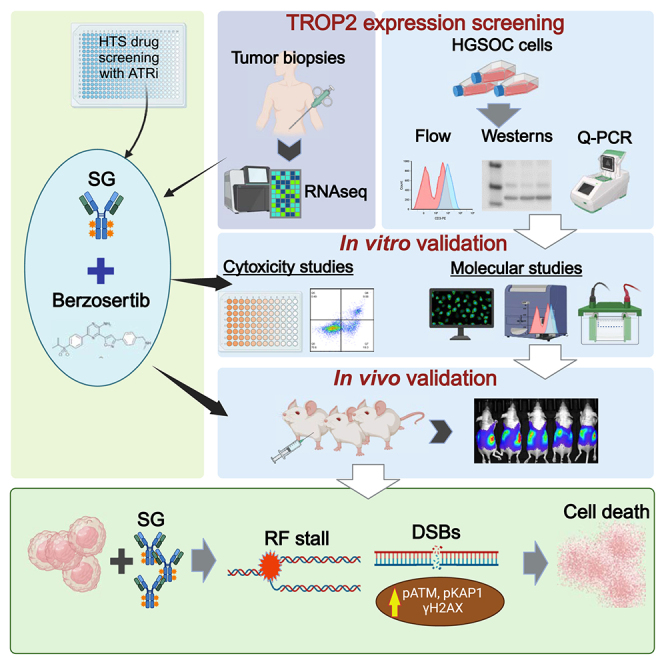
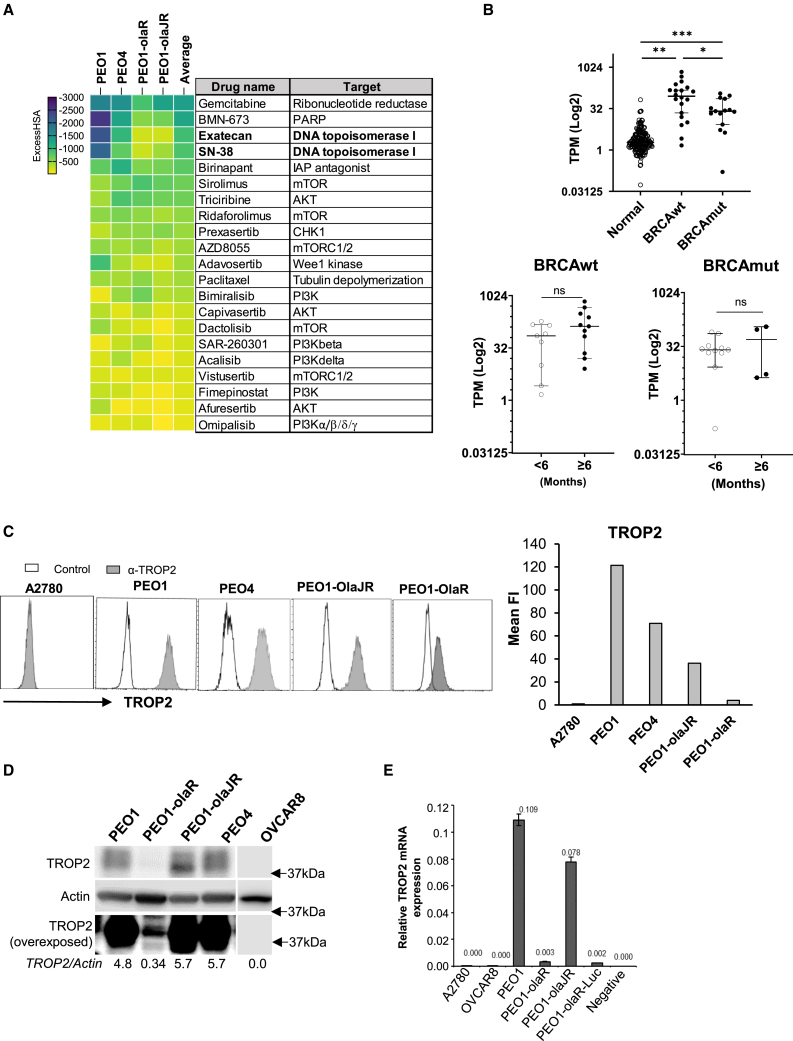
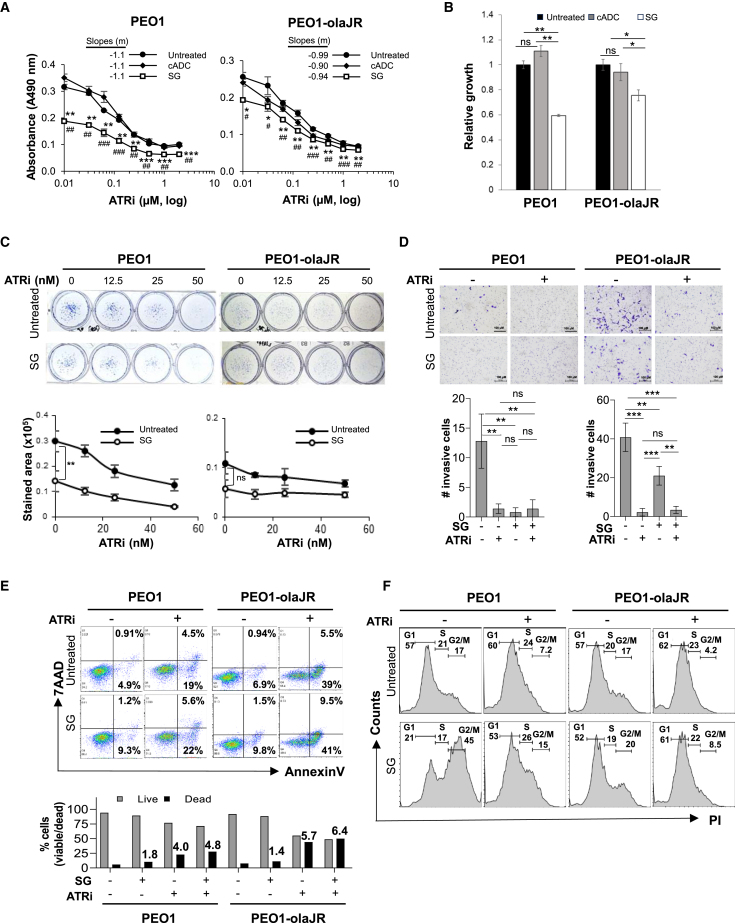
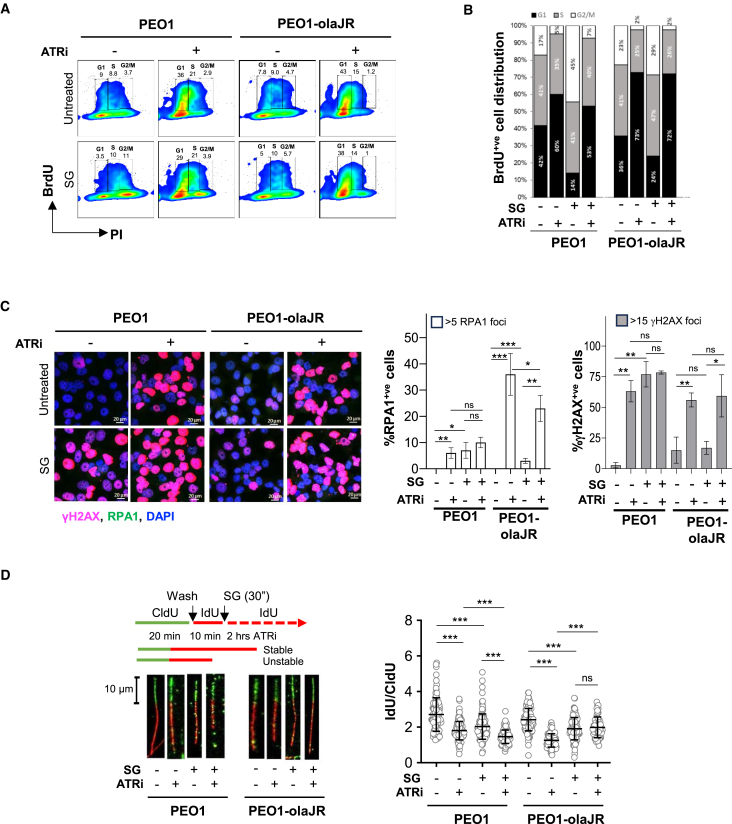
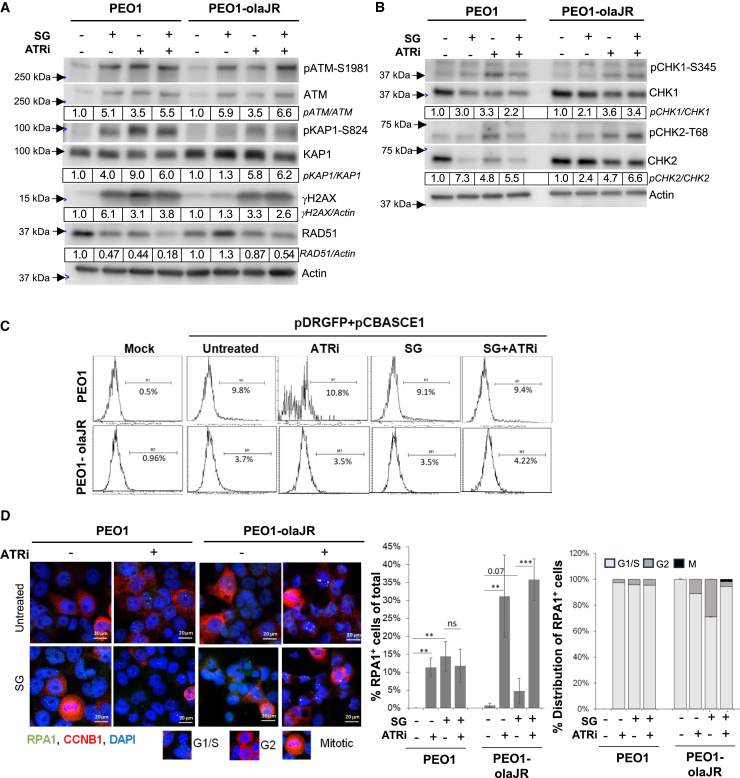
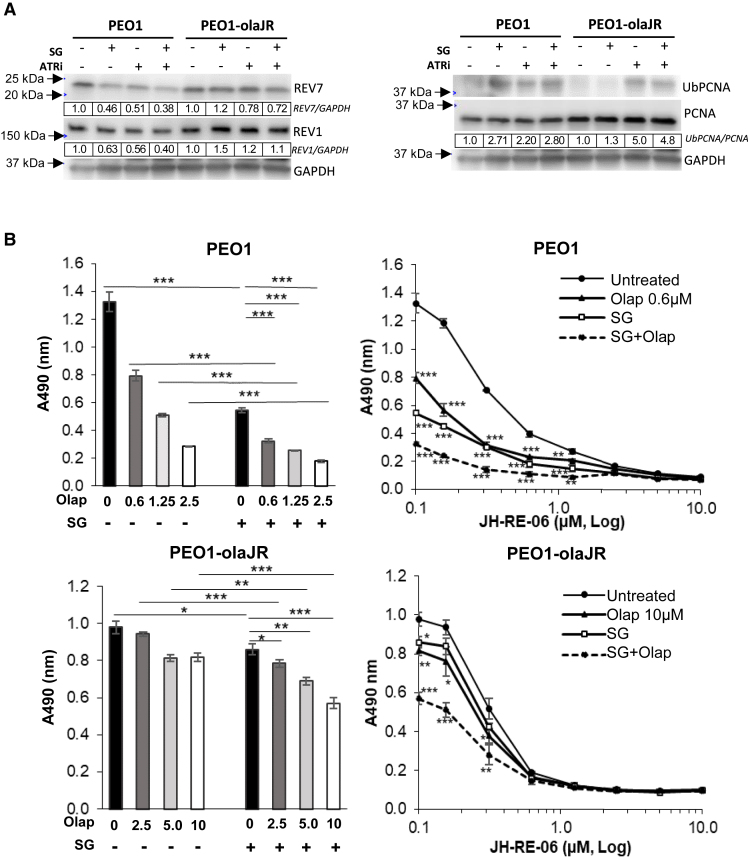
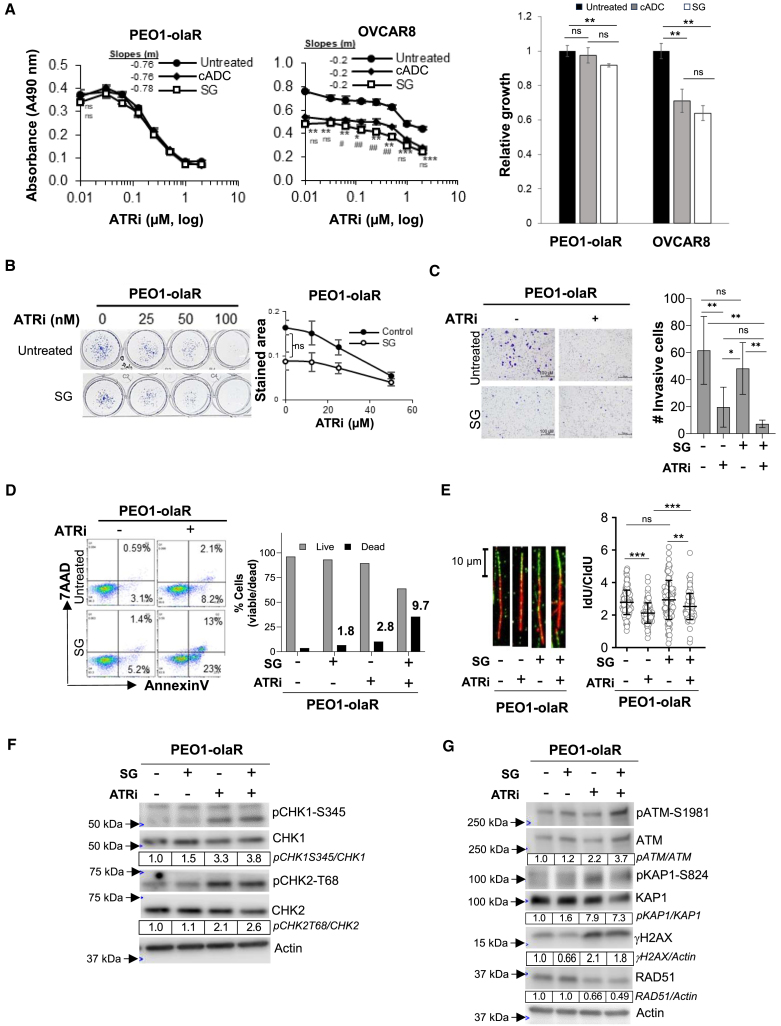
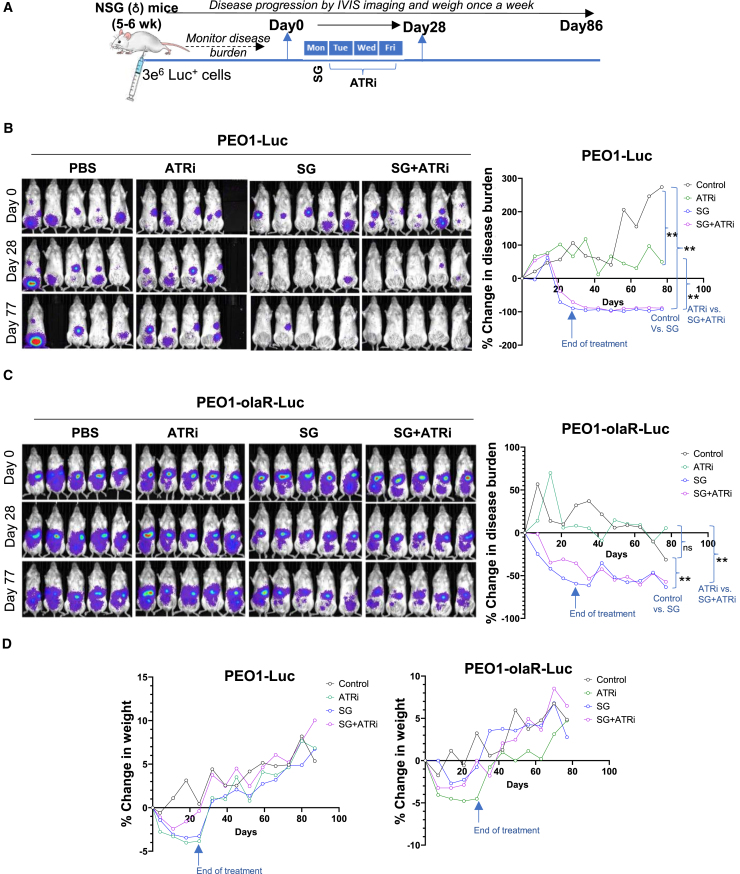
Antibody-drug conjugates (ADCs) have become an important class of anticancer drugs in solid tumors including drug-resistant gynecologic malignancies. TROP2 is a cell surface antigen that is highly expressed in ovarian carcinoma (OC) but minimally expressed in normal ovarian tissues. In this study, we aimed to identify how TROP2-specific ADC, sacituzumab govitecan (SG), modulates DNA damage response pathways in drug-resistant OC. We found that SG induces G2/M arrest, increases RPA1 foci, and decreases replication fork speed, resulting in replication stress in TROP2-positive cells while these were less evident in TROP2-negative cells. In OC in vitro and in vivo models, SN-38 sensitivity and TROP2 expression play key roles in response to either ATR inhibitor or SG alone, or in combination. Additionally, inhibition of translesion DNA synthesis enhances SG and PARP inhibitor (PARPi) sensitivity in PARPi-resistant OC cells. These findings provide mechanistic insights for clinical development of SG in drug-resistant OC.

Keywords: Cancer; Molecular biology; Oncology.


Conflict of interest statement

T.M.C. is a paid contract employee of Gilead Sciences, Inc. J.M.L. has research grant funding from AstraZeneca and Acrivon Therapeutics (paid to institution) and is on the Scientific Advisory Board of Acrivon Therapeutics and Genentech (unpaid). All other authors declare no conflict of interest.

Figures

None
Graphical abstract
Figure 1
Figure 1
High-throughput drug combination screens with ATRi and TROP2 expression in patient biopsies and cell lines (A) The heatmap is a ranked average ExcessHSA from a 10 × 10 combination screen of ATRi (ceralasertib) with various drugs selected from a 6 × 6 screen (Figure S1), in PARPi-sensitive PEO1, PARPi-resistant PEO1-olaJR, and PEO1-olaR and de novo PARPi-resistant PEO4. This experiment was performed once. (B) Expression values (Log2 transcripts per million, TPM) for TROP2 mRNA (TACSTD2) from both BRCA-mutant (BRCAmut) cohort (n = 15) and BRCA wild-type (BRCAwt) cohort (n = 20) of patients were compared against TPM values of TROP2 from normal ovarian tissues (normal) obtained from the GTEx database (n = 180). TROP2 values for the no-clinical benefit (<6 months PFS) or clinical benefit (≥6 months PFS) groups for cohorts BRCAwt (n = 9 and n = 11 respectively) and BRCAmut (n = 11 and n = 4 respectively) were compared as well. Graphs show TROP2 expression as median TPM (Log2) ± 95% confidence interval (CI) for each cohort or group. Statistical significance was determined using the unpaired Mann-Whitney U-test and is shown as p-values ∗p < 0.05, ∗∗p < 0.01, and ∗∗∗p < 0.001, ns, not significant. (C) Flow cytometric analysis for TROP2 expression (gray) was performed after incubating cells with recombinant anti-TROP2 hRS7 antibody followed by goat anti-human F(ab)2-AF488 secondary antibody as given in STAR Methods. In control group (white), cells were treated only with secondary antibody. A2780 cell line was used as a TROP2-negative control. Graphs show the value of mean fluorescence intensity (Mean FI) of TROP2 expression peaks divided by that of control peak (n = >8000 events) for each cell line. Figure is representative of 3 biologically independent experiments. (D) Immunoblotting was performed to screen the baseline levels of TROP2 protein in the same cell lines. Blots were overexposed (bottom panel) to highlight low TROP2 expression in PEO1-olaR. Densitometric quantitation of TROP2 relative to Actin are included below. Closest molecular weight marker positions are shown on the right. Figure is representative of 3 biologically independent experiments. (E) Quantitative PCR (qPCR) analysis of total RNA from both TROP2 positive and negative cell lines. Graph is representative of 2 biologically independent experiments and shows TROP2 expression values normalized against that of GAPDH for each cell line. A negative control without RNA template is also included as quality control. Data are represented as mean ± SD.
Figure 2
Figure 2
Effect of antibody drug conjugates (ADCs) on survival and viability in HGSOC cells (A) Cell growth assays (XTT) were performed on TROP2-positive (PEO1 and PEO1-olaJR) HGSOC cells in triplicate wells, both in normal media or after pretreatment with a nontargeting antibody drug conjugate control (cADC) or SG (10 μg/mL, 30 min at 37°C and washed thrice in PBS), prior to adding ATRi berzosertib (0–2 μM) for 48 h. Graphs show mean absorbance values at 490 nm corrected for background ±SD for each treatment (n = 3 biological replicates) against a concentration gradient (Log2) of ATRi. For all treatments we replaced 0 values for ATRi with 0.01 to enable plotting of absorbance values on a logarithmic X axis. Statistical determinations were done with Student’s t test and shown as p-values. The p-values for SG treatment versus untreated are indicated by asterisks (∗) while SG versus cADC are indicated by hashes (#). Slopes for each curve are derived from linear regression formula “y = mx+b” where y = Y-intercept, x = ATRi (μM) and b = correlation coefficient, calculated from the linear part of the respective curves. (B) Graphs show mean cell growth values ±SD of cells with cADC or SG alone relative to untreated, derived from panel A (n = 3 biological replicates). Statistical significance (p-values) was determined with Student’s t test. (C) Clonogenic assays were performed over 7 days with increasing concentrations of berzosertib (ATRi). Graphs show mean ± SD of stained area (n = 3 biological replicates). Statistical significance (p-values) determined using Student’s t test. (D) Representative images from Matrigel plates after crystal-violet staining are shown. Graphs below image panels show total number of crystal-violet-stained invaded cells from imaged panels ±SD (n = 3 biological replicates). Statistical significance (p-values) was determined using Student’s t test. Experiment was performed twice. Scale bar is 100 μm. (E) Flow cytometric analysis was conducted to assess cell viability with AnnexinV-FITC and 7AAD reagents on cells pretreated with SG or ATRi berzosertib (1 μM) alone or SG pretreatment followed by ATRi treatment overnight. Percentage of cells positive for AnnexinV alone (early apoptosis) or both AnnexinV and 7AAD (dead) are shown within respective quadrants. Graphs below show percentage of live (gray) and dead cells (black), while numbers above bars indicate fold increase in dead cells for each treatment relative to untreated. Images are representative of 3 biologically independent experiments. (F) Cells with or without SG pretreatment were treated with ATRi berzosertib (1 μM) for 48 h and then stained with propidium iodide for DNA quantification and cell cycle analysis. Cell populations as fractions of total cells are shown over appropriately marked G1, S, or G2/M phases. Images are representative of 2 experimental replicates. For all images, p-values are ∗, #p < 0.05, ∗∗, ##p < 0.01, and ∗∗∗, ###p < 0.001, ns, not significant.
Figure 3
Figure 3
Effect of SG and berzosertib on tumorigenicity and replication fork stability (A) PEO1 and PEO1-olaJR were pretreated with SG followed by ATRi (1 μM overnight prior to analyzing them for incorporated BrdU. Images show BrdU-positive (BrdU+ve) cells expressed as percentage of total cells (within boxes) against DNA quantity (PI) as determined by FlowJo software. Images are representative of 3 biologically independent experiments. (B) Graphs show stacked plots as fractions (as indicated by numbers) of total BrdU+ve cells derived from panel A distributed across G1, S or G2/M phases. (C) Immunofluorescent confocal microscopic analysis for RPA1 (green) and γH2AX-S139 (pink) of cells pretreated with SG (10μg/ml for 30 min at 37°C, washed 3 times with PBS) and then exposed to berzosertib (ATRi) (1 μM) overnight. Approximately 100–300 cells were analyzed over 3–5 sampled microscopic fields. Graphs show mean ± SD of % cells positive for RPA1 (>5 foci) or γH2AX foci (>15 foci) relative to total cells from each sampled field (n = 3–5 biological replicates). Statistical significance was determined with Student’s t test (p-values). Results are representative of 2 biologically independent experiments. Scale bar is 20 μm. (D) DNA fiber assays was performed as described in STAR Methods. About 200 DNA fibers were selected and the length of both red (IdU) and green (CldU) segments of each strand were measured using Fiji software. Representative strands are shown to the left. Graphs on the right show mean ± SD of the ratios of IdU/CldU from all strands (n = ∼200) per treatment using GraphPad prism. Statistical significance was determined with Student’s t test and represented as p-values, ∗p < 0.05, ∗∗p < 0.01, and ∗∗∗p < 0.001, ns, not significant. Results are representative of 2 biologically independent experiments. Scale bar is 10 μm.
Figure 4
Figure 4
Impact of SG in DNA damage repair pathways Cells were left untreated or pretreated with SG (10 μg/mL for 30 min/37°C, washed thrice with PBS) prior to treatment with ATRi berzosertib for all experiments. (A and B) Western blot analysis for DNA damage markers of lysates from cells pretreated with SG and treated with ATRi (1 μM) overnight. Densitometric quantitation was performed as detailed in the STAR Methods. Densitometric values of phosphorylated proteins relative to total proteins are further normalized to untreated (value of 1) for each cell line and shown below respective images. Values were rounded to two significant numbers. Representative of 3 biologically independent experiments. (C) Graphs show results from homologous recombination (HR) repair activity assay. After cells were pretreated with SG, they were cultured overnight in plain media and then transfected with HR reporter plasmids overnight, followed by treatment with ATRi or in plain media for 48 h prior to flow cytometric analysis for GFP expression. Mock transfection without plasmids were also performed as a control for transfection efficiency. Flow data was analyzed on Flowjo and plotted as histograms. Percent GFP-positive (GFP+ve) cells for histograms are shown under each range gate. This is representative of two experimental replicates. (D) Representative images of cells pretreated with SG, washed and incubated overnight with ATRi (1 μM) prior to co-staining for targets RPA1 (green foci) and Cyclin B1 (CCNB1, red). For reference, images of cell cycle phases as inferred from CCNB1 staining is given below image panels. The graph (middle panel) shows the mean ratio ±SD of RPA1+ve cells (>5 foci) to total cells (n = 100–300) from all sampled fields (n = 3–5 biological replicates) for each treatment. The stacked plot on the right show percent distribution of RPA1+ve cells across cell cycle phases as defined by staining pattern of nuclear CCNB1 from the sampled fields (n = 3–5 biological replicates per treatment). Representative of n = 2 biologically independent experiments. ∗∗p < 0.01, and ∗∗∗p < 0.001, ns, not significant. Scale bar is 20 μm.
Figure 5
Figure 5
Translesion DNA synthesis (TLS) pathway inhibition improves SG and olaparib activity in HGSOC (A) Western analysis of protein lysates from cells with or without SG pretreatment (10 μg/mL for 30 min/37°C, washed thrice with PBS) followed by overnight incubation with ATRi (1 μM) were examined for markers of TLS activity, REV1, REV7 (components of TLS polymeraseζ) and its marker of activity ubiquitinylated PCNA (UbPCNA). As described in STAR Methods, ratio of total chemiluminescence signal (ImageStudio) from each UbPCNA band to that of total PCNA was then further normalized to untreated (value of 1) for each cell line, and values shown below rounded to two significant numbers. Images are representative of 3 biologically independent experiments. (B) The graphs on the left show mean cell growth ±SD (n = 3 biological replicates per treatment) from XTT assays on the effect of SG on sensitivity to a gradient of olaparib. On the right, the graphs show mean ± SD (n = 3 biological replicates) cell growth with or without SG pretreatment followed by olaparib in the presence of a gradient of specific TLS inhibitor JH-RE-06 over 5 days. During the assay, cells were retreated with SG in fresh media on day 3, washed twice with PBS, prior to reincubation with olaparib and JH-RE-06 for another 2 days. The Y axis shows actual background-corrected absorbance at 490nm. Untreated cell values (0 μM of JH-RE-06) are plotted at 0.1 μM to enable representation on the log X axis. Statistical significance was determined using Student’s t-test. The p-values for olaparib or SG were determined against untreated while those for the combination (SG + olaparib) (dotted line) were determined against olaparib monotherapy. ∗∗p < 0.01, and ∗∗∗p < 0.001, ns, not significant.
Figure 6
Figure 6
SG activity in TROP2-negative OVCAR8 and TROP2-low PEO1-olaR Cells were left untreated or pretreated with SG or cADC (10 μg/mL, 30 min at 37°C and washed thrice with PBS) prior to use in all experiments below. Student’s t test was used to measure significance in all experiments below. (A) Graphs show mean ± SD (n = 3 biological replicates per treatment) cell growth inhibition from XTT assays for TROP2-negative OVCAR8 and TROP2-low PEO1-olaR cells that were untreated or pretreated with either SG or cADC followed by treatment with a gradient of ATRi (0–10 μM) over 48 h. Untreated cell values (0 μM ATRi) are plotted at 0.01 μM to enable representation on the log X axis. Statistical significance (p-value) was determined by Student’s t test. p-values between untreated and SG plots are indicated by asterisks (∗) while between SG and cADC plots are indicated by hashes (#). Slopes for each curve are derived from linear regression formula “y = mx+b” where y = Y-intercept, x = ATRi (μM) and b = correlation coefficient, calculated from the linear part of the respective curves. (B) Clonogenic assays were performed over 7 days with untreated or SG pretreated cells against increasing concentrations of berzosertib (ATRi). Representative images are shown on the left while graphs on the right show mean ± SD from 3 biological replicates. (C) Representative images from one set of Matrigel plates after crystal-violet staining are shown. Following appropriate treatments, invaded cells on underside of inserts were quantified after crystal-violet staining using ImageJ (Fiji) software as detailed in STAR Methods. The plots show mean ± SD for 3 biological replicates. Statistical significance was determined by Student’s t test. Scale bar is 100 μm. (D) Flow cytometric analysis of viability (AnnexinV/7-AAD) for PEO1-olaR treated with SG or ATRi monotherapy or a combination of both. Dead and live cell proportions are plotted on the right as bar charts from >8000 events. Numbers above bars indicate fold increase in dead cells for each treatment relative to untreated. Results are representative of 3 biologically independent experiments. (E) DNA fiber assays was performed as explained in STAR Methods. Lengths of both red (IdU) and green (CldU) segments of each strand (∼200 DNA strands per treatment) were measured using Fiji software, and the mean ± SD of the ratio of IdU/CldU from all strands (n = ∼200) were plotted as column charts using GraphPad prism. Representative strands are shown to the left from 2 biologically independent experiments. Statistical significance was determined by Student’s t test. Scale bar is 10 μm. (F and G) Western blot analysis of lysates from cells pretreated with SG alone or followed by overnight treatment with ATRi berzosertib (1 μM) and analyzed for DNA damage and cell cycle markers. Densitometric quantitation was performed as detailed in the STAR Methods. Densitometric values of phosphorylated proteins relative to total proteins are further normalized to untreated (value of 1) for each cell line and shown below respective images. Values were rounded to two significant numbers. Representative of 3 biologically independent experiments. For panels A, B, C and E, p-values are ∗, #p < 0.05, ∗∗, ##p < 0.01, and ∗∗∗, ###p < 0.001, ns, not significant.
Figure 7
Figure 7
Evaluation of berzosertib efficacy in combination with SG in murine models of PARPi-resistant HGSOC (A) Schematic of treatment strategy for mice treated with SG or berzosertib (ATRi) or a combination of both over a period of 4 weeks as described in STAR Methods. Each treatment group represents 10 mice (biological replicates) on day 0. Groups were eliminated if mice number dropped below three due to death or when euthanasia criteria was reached. (B and C) Representative images of mice injected with PEO1-Luc (B) or PEO1-olaR-luc (C), imaged for luciferase activity are shown from day 0 to day 77. Line plots to the right represent % change in disease burden against time on X axis (days 0–77) measured at weekly intervals (n = 8–10 mice per group). Statistical significance was determined using Mann-Whitney U-test (unpaired) to generate p-values between relevant groups and shown on the right of the plots. Error bars are not shown for better visualization of curves. ∗∗p < 0.01, ns, not significant. (D) Line plots showing % change in mice weight from day 0 recorded weekly for PEO1-Luc and for PEO1-olaR-Luc (n = 8–10 mice per group).

References

    1. Kurman R.J., Shih I.M. Pathogenesis of ovarian cancer: lessons from morphology and molecular biology and their clinical implications. Int. J. Gynecol. Pathol. 2008;27:151–160. doi: 10.1097/PGP.0b013e318161e4f5. - DOI - PMC - PubMed
    1. Konstantinopoulos P.A., Spentzos D., Karlan B.Y., Taniguchi T., Fountzilas E., Francoeur N., Levine D.A., Cannistra S.A. Gene expression profile of BRCAness that correlates with responsiveness to chemotherapy and with outcome in patients with epithelial ovarian cancer. J. Clin. Oncol. 2010;28:3555–3561. doi: 10.1200/JCO.2009.27.5719. - DOI - PMC - PubMed
    1. Brill E., Yokoyama T., Nair J., Yu M., Ahn Y.R., Lee J.M. Prexasertib, a cell cycle checkpoint kinases 1 and 2 inhibitor, increases in vitro toxicity of PARP inhibition by preventing Rad51 foci formation in BRCA wild type high-grade serous ovarian cancer. Oncotarget. 2017;8:111026–111040. doi: 10.18632/oncotarget.22195. - DOI - PMC - PubMed
    1. Chau C.H., Steeg P.S., Figg W.D. Antibody-drug conjugates for cancer. Lancet. 2019;394:793–804. doi: 10.1016/S0140-6736(19)31774-X. - DOI - PubMed
    1. Cheng X., Li J., Tanaka K., Majumder U., Milinichik A.Z., Verdi A.C., Maddage C.J., Rybinski K.A., Fernando S., Fernando D., et al. MORAb-202, an antibody--drug conjugate utilizing humanized anti-human FR$∖alpha$ farletuzumab and the microtubule-targeting agent eribulin, has potent antitumor activity. Mol. Cancer Therapeut. 2018;17:2665–2675. doi: 10.1158/1535-7163.MCT-17-1215. - DOI - PubMed

LinkOut - more resources