. 2022 Feb 21;2(1):100012.
doi: 10.1016/j.engmic.2022.100012. eCollection 2022 Mar.

A comparative study on the genomes, transcriptomes, and metabolic properties of Escherichia coli strains Nissle 1917, BL21(DE3), and MG1655

Affiliations

A comparative study on the genomes, transcriptomes, and metabolic properties of Escherichia coli strains Nissle 1917, BL21(DE3), and MG1655

Linlin Zhao et al. Eng Microbiol. .

Abstract

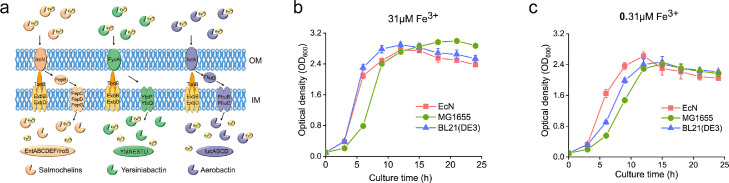
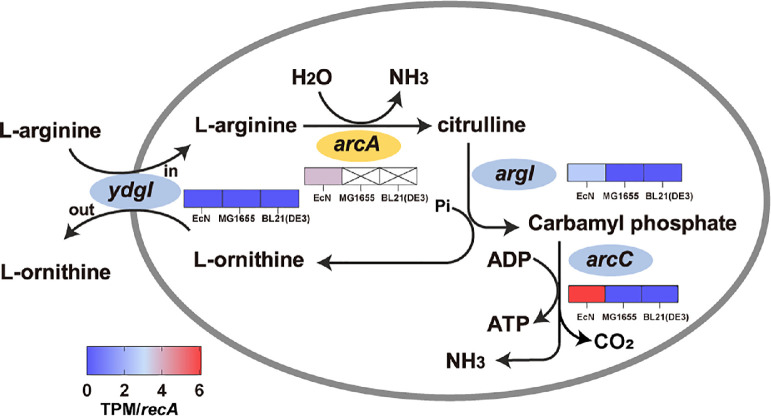
Escherichia coli is the most well-studied model prokaryote and has become an indispensable host for the biotechnological production of proteins and biochemicals. In particular, the probiotic status of one E. coli strain, E. coli Nissle 1917 (EcN) has helped it become a new favorite amongst synthetic biologists. To broaden its potential applications, here we assemble a comparative study on the genomes, transcriptomes, and metabolic properties of E. coli strains EcN, BL21(DE3), and MG1655. Comparative genomics data suggests that EcN possesses 1404 unique CDSs. In particular, EcN has additional iron transport systems which endow EcN with a higher tolerance to iron scarcity when compared to two other E. coli strains. EcN transcriptome data demonstrates that E. coli strains EcN, BL21(DE3), and MG1655 all have comparable activities of the central metabolic pathway, however only EcN inherits the arginine deiminase pathway. Additionally, we found that EcN displayed a lower expression of ribosomal proteins compared to BL21(DE3) and MG1655. This comparative study on E. coli strains EcN, BL21(DE3), and MG1655 aims to provide a reference for further engineering EcN as a biotechnological tool.

Keywords: Escherichia coli Nissle 1917; comparative genomics; probiotics; synthetic biology; transcriptome.


Conflict of interest statement

The authors declare that they have no known competing financial interests or personal relationships that could have appeared to influence the work reported in this paper.

Figures

Fig 1
Fig. 1
Comparative genomes and growth of EcN, BL21(DE3), and MG1655. (a) Genome alignment of the E. coli BL21(DE3) (NC_012971.2), E. coli MG1655 (CP012868.1), and E. coli Nissle 1917 (NZ_CP022686.1) with Mauve. Colored regions represent conserved DNA regions shared by two or more genomes. The white gaps between the rectangles mean no similar fragments were found in other genomes. (b) A Venn diagram shows the number of common or unique genes in EcN, BL21(DE3), and MG1655.
Fig 2
Fig. 2
The type VI secretion system. (a) Diagrammatic depiction of the type VI secretion system apparatus extension and contraction in EcN. The Type VI secretion system is composed of a membrane complex (orange color), a baseplate complex (green color), and a needle like structure (dark blue and grey color). Effectors can be directly delivered or through interaction with VgrG, PAAR, or other chaperones. (b) Genome arrangement of type VI secretion system genes in EcN.
Fig 3
Fig. 3
Growth and acetic acid metabolism of EcN, BL21(DE3), and MG1655 at low iron concentrations. (a) Schematic of siderophore-mediated iron uptake in EcN. Salmochelins synthesis and iron transport proteins are indicated in orange. Yersiniabactin synthesis and iron transport proteins are indicated in green. Aerobactin synthesis and iron transport proteins are indicated in purple. The growth of EcN, BL21(DE3), and MG1655 in (b) M9 minimal medium or (c) M9 minimal medium with 1% of normal iron concentration. The dotted lines were references for the final OD600 or growth retardation of EcN, BL21(DE3), and MG1655. Data points represent mean values of three biological replicates with error-bars showing standard deviation.
Fig 4
Fig. 4
Transcriptomic comparison of EcN, BL21(DE3), and MG1655. (a) Heat map of differentially expressed genes when comparing EcN, BL21(DE3), and MG1655. The heat map was generated using the normalized TPM values. The colored bar below represents their expression levels. Grey similarity bars were generated by comparing the normalized TPM of gene orthologs. (b) Expression of genes in the central metabolic pathway in the three strains. The glycolysis pathway has orange blocks as its background. pgm, phosphoglucomutase; glk, glucokinase; pgi, glucose-6-phosphate isomerase; pfkA, 6-phosphofructokinase; pfkB, 6-phosphofructokinase II; fbaA, fructose-bisphosphate aldolase; fbaB, fructose-bisphosphate aldolase; gapA, aldehyde dehydrogenase; pgk, phosphoglycerate kinase; gpmA and gpmM, encode phosphoglycerate mutase; eno, enolase; pykA and pykF, pyruvate kinase; aceE, pyruvate dehydrogenase. The TCA cycle has purple blocks as its background. gltA, citrate synthase; acnA and acnB, aconitate hydratase; icd, isocitrate dehydrogenase; sucA and sucB, encode 2-oxoglutarate dehydrogenase; sucC and sucD, encode succinyl-CoA ligase; sdhA, sdhB, sdhC and sdhD, encode succinate dehydrogenase; fumA, fumB and fumC, encode fumarate hydratase; mdh, malate dehydrogenase; mqo, malate:quinone oxidoreductase; aceA, isocitrate lyase; aceB, malate synthase. In addition, the acetic acid metabolic pathway has green blocks as its background. poxB, pyruvate oxidase; pta, phosphate acetyltransferase; eutD, phosphate acetyltransferase; ackA, acetate kinase; acs, acetate kinase. The heat map shows the normalized TPM of the above three pathways’ genes. The colored bar below represents their expression levels.
Fig 5
Fig. 5
The arginine deiminase pathway of EcN. Genes with a blue background are shared by these three bacteria, while the arcA gene was found in EcN but not in the other two strains. The heat maps below the gene name represent the expression level of the gene. arcA, arginine deiminase; argI, ornithine carbamoyltransferase; arcC, carbamate kinase; ydgI, arginine and ornithine antiporter. The colored bar below represents their expression levels.
Fig 6
Fig. 6
Protein expression ability of EcN, BL21(DE3), and MG1655. (a) Heat map represents relative gene expression density in EcN, BL21(DE3), and MG1655. Heat map generated for the ribosomal proteins using the log2 transformed normalized TPM values. The colored bars shown on the right represent their expression levels. (b) Relative fluorescence intensity of GFP and cell growth under the control of J23119 promoter. Solid lines represent growth curve while bars represent relative fluorescence intensity. Data points represent mean values of three biological replicates with error bars showing standard deviation. The bars represent mean value of three biological replicates with error bars showing standard deviation.
Fig 7
Fig. 7
Metabolic characteristics of the three E. coli strains in different conditions. (a) Growth curves of EcN, BL21(DE3), and MG1655 in LB medium. Data points represent mean value of three biological replicates with error bars showing standard deviation. (b) Growth curves, (c) glucose consumption, and (d) acetic acid accumulation of EcN, BL21(DE3), and MG1655 in minimal salt medium with 10 g/L glucose as a carbon source. Data points represent mean value of three biological replicates with error bars showing standard deviation.

Similar articles

Cited by

References

    1. Amiri-Jami M, Abdelhamid AG, Hazaa M, Kakuda Y, Griffths MW. Recombinant production of omega-3 fatty acids by probiotic Escherichia coli Nissle 1917. FEMS Microbiol Lett. 2015;362(20) doi: 10.1093/femsle/fnv166. - DOI - PubMed
    1. Benesty J, Chen J, Huang Y, Cohen I. Springer Topics in Signal Processing; 2009. Pearson correlation coefficient. Noise Reduction in Speech Processing; pp. 1–4.
    1. Blum M, Chang HY, Chuguransky S, Grego T, Kandasaamy S, Mitchell A, et al. The InterPro protein families and domains database: 20 years on. Nucleic Acids Res. 2021;49(D1):D344–DD54. doi: 10.1093/nar/gkaa977. - DOI - PMC - PubMed
    1. Bolger AM, Lohse M, Usadel B. Trimmomatic: a flexible trimmer for Illumina sequence data. Bioinformatics. 2014;30(15):2114–2120. doi: 10.1093/bioinformatics/btu170. - DOI - PMC - PubMed
    1. Chen J, Li X, Liu Y, Su T, Lin C, Shao L, et al. Engineering a probiotic strain of Escherichia coli to induce the regression of colorectal cancer through production of 5-aminolevulinic acid. Microb Biotechnol. 2021 doi: 10.1111/1751-7915.13894. - DOI - PMC - PubMed

LinkOut - more resources