. 2024 Jul 22;4(3):100163.
doi: 10.1016/j.engmic.2024.100163. eCollection 2024 Sep.

Impact of Paenibacillus elgii supernatant on screening bacterial strains with potential for biotechnological applications

Affiliations

Impact of Paenibacillus elgii supernatant on screening bacterial strains with potential for biotechnological applications

I C Cunha-Ferreira et al. Eng Microbiol. .

Abstract

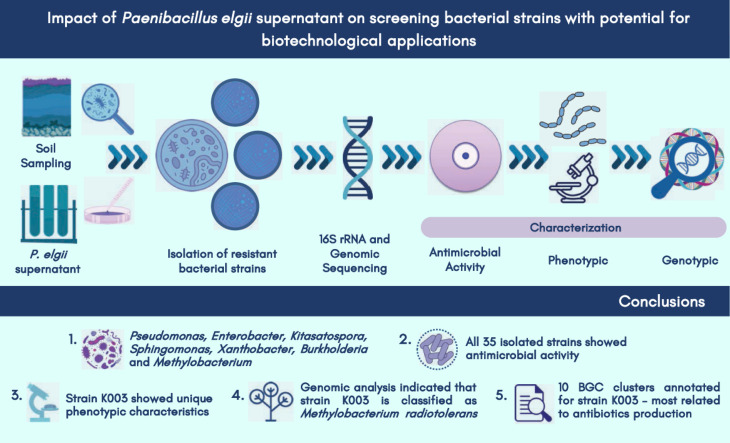
The biotechnological industry faces a crucial demand for novel bioactive compounds, particularly antimicrobial agents, to address the rising challenge of bacterial resistance to current available antibiotics. Traditional strategies for cultivating naturally occurring microorganisms often limit the discovery of novel antimicrobial producers. This study presents a protocol for targeted selection of bacterial strains using the supernatant of Paenibacillus elgii, which produces abundant signal molecules and antimicrobial peptides. Soil samples were inoculated in these enriched culture media to selectively cultivate bacteria resistant to the supernatant, indicating their potential to produce similar compounds. The bacterial strains isolated through this method were assessed for their antibacterial activity. In addition, the functional annotation of the genome of one of these strains revealed several gene clusters of biotechnological interest. This study highlights the effectiveness of using this approach for selective cultivation of microorganisms with potential for biotechnological applications.

Keywords: Antibacterial activity; Prospecting; Supernatant.


Conflict of interest statement

The authors declare that they have no known competing financial interests or personal relationships that could have appeared to influence the work reported in this paper.

Figures

Image, graphical abstract
Graphical abstract
Fig 1
Fig. 1
Similarity cladogram of 16S rRNA genes of Methylobacterium sp. K003 and other valid Methylobacterium strains. The evolutionary position of Methylobacterium sp. K003 was assessed using the Maximum-Likelihood (ML) method with 1000 sampling repetitions (Bootstrap).
Fig 2
Fig. 2
Circular map of the genome assembly of Methylobacterium sp. K003, showing the coding regions and the GG content. Outside to center: forward CDS (dark blue), reverse CDS (red), GC content, and GC slope (dark gray and light gray).
Fig 3
Fig. 3
Genomic alignment of Methylobacterium sp. K003 (red) and Methylobacterium radiotolerans JCM 2831 (blue), showing regions with a minimum of 1000 nucleotides and 90 % identity. The outer band represents the size scale of the contigs, whereas blue bands with a two-layer depth indicate overlapping sequences present in both strains.
Fig 4
Fig. 4
Maximum-likelihood phylogenetic tree of Methylobacterium strains based on 233 core orthologous genes concatenated from genomic sequences. The dataset included 12 Methylobacterium strains, including Methylobacterium sp. K003 and its closely related strains, with Enterovirga rhinocerotis YIM 100770 as the outgroup.
Fig 5
Fig. 5
Pangenomic and phylogenetic analysis of Methylobacterium sp. K003. (A) Pangenome distribution illustrating three gene categories across genomes: core genes (present in 99 % to 100 % of the genomes), shell genes (present in 15 % to 95 % of the genomes), and cloud genes (present in 0 % to 15 % of the genomes). (B) Venn diagram showing the number of genes common between Methylobacterium sp. K003 and its closest strain Methylobacterium radiotolerans JCM 2831. (C) Maximum-likelihood phylogenetic tree based on the presence and absence of genes from Methylobacterium sp. K003 pangenome. Blue bar represents the pangenome, with each line corresponding to a strain and each column indicating gene variation. Gene presence is depicted in a descending frequency, with empty spaces representing gene absence. Genome comparison includes Methylobacterium sp. K003 and its closest genomes, using a minimum blastp identity of 80 % for grouping genes into the core genomes.
Fig 6
Fig. 6
Distribution of encoded proteins in the genome of Methylobacterium sp. K003 across their respective COG categories.
Fig 7
Fig. 7
Peptide distribution and functional prediction in the genomes of Methylobacterium sp. K003 and Methylobacterium radiotolerans JCM 2831. (A) Total number of peptides with fewer than 100 residues and their predicted biological function in each strain (BAP). (B) Predicted biological functions of biologically active peptides (BAP) in each strain, with a focus on anti-inflammatory (AntiAngioPred), anticancer (AntiCP), and antifungal (AntiFP) activities.
Fig 8
Fig. 8
Graphical representation of the similarity between biosynthetic gene cluster (BCG) families from Methylobacterium sp. K003 and Methylobacterium radiotolerans JCM 2831. Each link represents similar gene clusters between the analyzed strains. Singletons, presented in isolated form, are specific clusters unique to each strain, indicating no similarities between the strains.
Fig 9
Fig. 9
Similarities between biosynthetic gene clusters (BCGs) found in Methylobacterium sp. K003 and Paenibacillus elgii AC13. (A) The total number of Pfam domains per BCG shared between the analyzed strains. (B) Graphical representation of similar BCGs between K003 and AC13 strains.
Fig 10
Fig. 10
Comparative analysis of phenotypic predictions from the genome assembly of Methylobacterium sp. K003. The comparison includes genomes of the closest strains according to dDDH, as available in the NCBI database. Scoring system: a value of zero indicates a negative phenotype, whereas values of 1 and 2 correspond to positive phenotypes in the phypat and phypat+PGL predictors, respectively. A value of 3 indicates a positive phenotype in both predictors.

References

    1. Gutleben J., Loureiro C., Ramírez Romero L.A., Shetty S., Wijffels R.H., Smidt H., et al. Cultivation of bacteria from Aplysina aerophoba: effects of oxygen and nutrient gradients. Front. Microbiol. 2020;11:175. doi: 10.3389/fmicb.2020.00175. - DOI - PMC - PubMed
    1. Lagier J.C., Hugon P., Khelaifia S., Fournier P.E., La Scola B., Raoult D. The rebirth of culture in microbiology through the example of culturomics to study human gut microbiota. Clin. Microbiol. Rev. 2015;28(1):237–264. doi: 10.1128/CMR.00014-14. - DOI - PMC - PubMed
    1. Wilson L., Iqbal K.M., Simmons-Ehrhardt T., Bertino M.F., Shah M.R., et al. Customizable 3D printed diffusion chambers for studies of bacterial pathogen phenotypes in complex environments. J. Microbiol. Methods. 2019;162:8–15. doi: 10.1016/j.mimet.2019.05.002. - DOI - PubMed
    1. Choi J., Yang F., Stepanauskas R., Cardenas E., Garoutte A., et al. Strategies to improve reference databases for soil microbiomes. ISME J. 2017;11:829–834. doi: 10.1038/ismej.2016.168. - DOI - PMC - PubMed
    1. Liu S., Moon C.D., Zheng N., Huws S., Zhao S., Wang J. Opportunities and challenges of using metagenomic data to bring uncultured microbes into cultivation. Microbiome. 2022;10:76. doi: 10.1186/s40168-022-01272-5. - DOI - PMC - PubMed

LinkOut - more resources