

Scaling and merging time-resolved pink-beam diffraction with variational inference
- PMID: 39629168
- PMCID: PMC11613031
- DOI: 10.1063/4.0000269
Scaling and merging time-resolved pink-beam diffraction with variational inference
Abstract
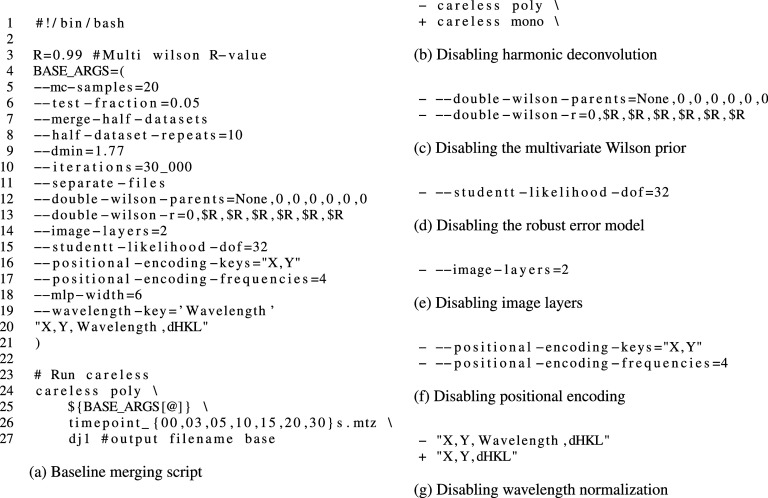
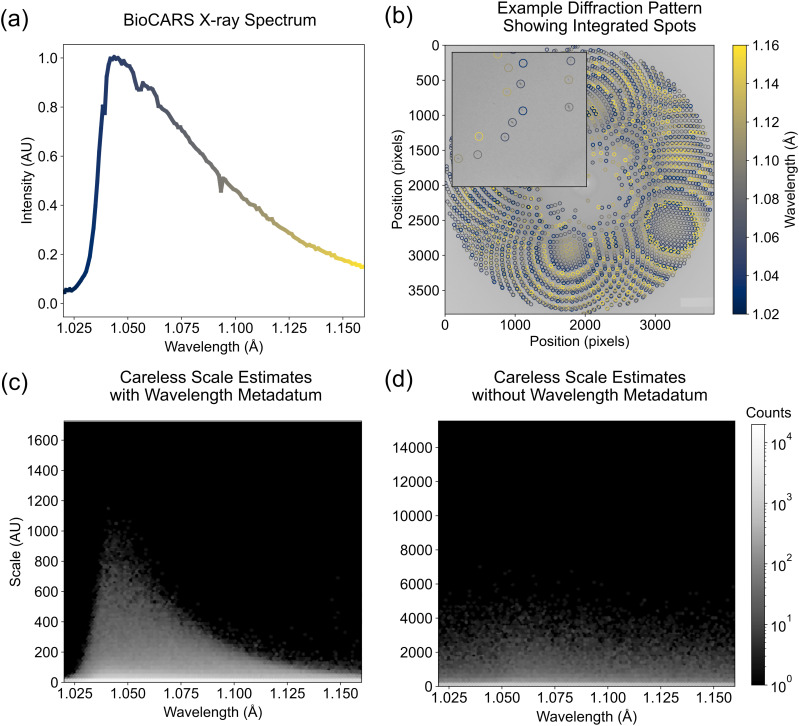
Time-resolved x-ray crystallography (TR-X) at synchrotrons and free electron lasers is a promising technique for recording dynamics of molecules at atomic resolution. While experimental methods for TR-X have proliferated and matured, data analysis is often difficult. Extracting small, time-dependent changes in signal is frequently a bottleneck for practitioners. Recent work demonstrated this challenge can be addressed when merging redundant observations by a statistical technique known as variational inference (VI). However, the variational approach to time-resolved data analysis requires identification of successful hyperparameters in order to optimally extract signal. In this case study, we present a successful application of VI to time-resolved changes in an enzyme, DJ-1, upon mixing with a substrate molecule, methylglyoxal. We present a strategy to extract high signal-to-noise changes in electron density from these data. Furthermore, we conduct an ablation study, in which we systematically remove one hyperparameter at a time to demonstrate the impact of each hyperparameter choice on the success of our model. We expect this case study will serve as a practical example for how others may deploy VI in order to analyze their time-resolved diffraction data.
© 2024 Author(s).
Conflict of interest statement
The authors have no conflicts to disclose.
Figures
Update of
-
Scaling and Merging Time-Resolved Laue Data with Variational Inference.bioRxiv [Preprint]. 2024 Jul 31:2024.07.30.605871. doi: 10.1101/2024.07.30.605871. bioRxiv. 2024. Update in: Struct Dyn. 2024 Nov 06;11(6):064301. doi: 10.1063/4.0000269. PMID: 39131362 Free PMC article. Updated. Preprint.
Similar articles
-
Scaling and Merging Time-Resolved Laue Data with Variational Inference.bioRxiv [Preprint]. 2024 Jul 31:2024.07.30.605871. doi: 10.1101/2024.07.30.605871. bioRxiv. 2024. Update in: Struct Dyn. 2024 Nov 06;11(6):064301. doi: 10.1063/4.0000269. PMID: 39131362 Free PMC article. Updated. Preprint.
-
From femtoseconds to minutes: time-resolved macromolecular crystallography at XFELs and synchrotrons.Acta Crystallogr D Struct Biol. 2024 Feb 1;80(Pt 2):60-79. doi: 10.1107/S2059798323011002. Epub 2024 Jan 24. Acta Crystallogr D Struct Biol. 2024. PMID: 38265875 Free PMC article.
-
A unifying Bayesian framework for merging X-ray diffraction data.Nat Commun. 2022 Dec 15;13(1):7764. doi: 10.1038/s41467-022-35280-8. Nat Commun. 2022. PMID: 36522310 Free PMC article.
-
Opportunities and challenges for time-resolved studies of protein structural dynamics at X-ray free-electron lasers.Philos Trans R Soc Lond B Biol Sci. 2014 Jul 17;369(1647):20130318. doi: 10.1098/rstb.2013.0318. Philos Trans R Soc Lond B Biol Sci. 2014. PMID: 24914150 Free PMC article. Review.
-
Time-resolved structural studies at synchrotrons and X-ray free electron lasers: opportunities and challenges.Curr Opin Struct Biol. 2012 Oct;22(5):651-9. doi: 10.1016/j.sbi.2012.08.006. Epub 2012 Sep 25. Curr Opin Struct Biol. 2012. PMID: 23021004 Free PMC article. Review.
Cited by
-
Sensitive Detection of Structural Differences using a Statistical Framework for Comparative Crystallography.bioRxiv [Preprint]. 2024 Jul 23:2024.07.22.604476. doi: 10.1101/2024.07.22.604476. bioRxiv. 2024. PMID: 39091831 Free PMC article. Preprint.
-
Resolving DJ-1 Glyoxalase Catalysis Using Mix-and-Inject Serial Crystallography at a Synchrotron.bioRxiv [Preprint]. 2024 Jul 20:2024.07.19.604369. doi: 10.1101/2024.07.19.604369. bioRxiv. 2024. PMID: 39071394 Free PMC article. Preprint.
-
Scaling and Merging Time-Resolved Laue Data with Variational Inference.bioRxiv [Preprint]. 2024 Jul 31:2024.07.30.605871. doi: 10.1101/2024.07.30.605871. bioRxiv. 2024. Update in: Struct Dyn. 2024 Nov 06;11(6):064301. doi: 10.1063/4.0000269. PMID: 39131362 Free PMC article. Updated. Preprint.
-
Preface to special topic: Celebrating the work and achievements of Keith Moffat.Struct Dyn. 2025 Jul 1;12(4):040401. doi: 10.1063/4.0000771. eCollection 2025 Jul. Struct Dyn. 2025. PMID: 40612268 Free PMC article. No abstract available.
References
-
- Tenboer J., Basu S., Zatsepin N., Pande K., Milathianaki D., Frank M., Hunter M., Boutet S., Williams G. J., Koglin J. E., Oberthuer D., Heymann M., Kupitz C., Conrad C., Coe J., Roy-Chowdhury S., Weierstall U., James D., Wang D., Grant T., Barty A., Yefanov O., Scales J., Gati C., Seuring C., Srajer V., Henning R., Schwander P., Fromme R., Ourmazd A., Moffat K., Thor J. J. V., Spence J. C. H., Fromme P., Chapman H. N., and Schmidt M., “ Time-resolved serial crystallography captures high-resolution intermediates of photoactive yellow protein,” Science 346, 1242 (2014).10.1126/science.1259357 - DOI - PMC - PubMed
-
- Dods R., Båth P., Morozov D., Gagnér V. A., Arnlund D., Luk H. L., Kübel J., Maj M., Vallejos A., Wickstrand C., Bosman R., Beyerlein K. R., Nelson G., Liang M., Milathianaki D., Robinson J., Harimoorthy R., Berntsen P., Malmerberg E., Johansson L., Andersson R., Carbajo S., Claesson E., Conrad C. E., Dahl P., Hammarin G., Hunter M. S., Li C., Lisova S., Royant A., Safari C., Sharma A., Williams G. J., Yefanov O., Westenhoff S., Davidsson J., DePonte D. P., Boutet S., Barty A., Katona G., Groenhof G., Brändén G., and Neutze R., “ Ultrafast structural changes within a photosynthetic reaction centre,” Nature 589, 310 (2021).10.1038/s41586-020-3000-7 - DOI - PubMed
-
- Gruhl T., Weinert T., Rodrigues M. J., Milne C. J., Ortolani G., Nass K., Nango E., Sen S., Johnson P. J. M., Cirelli C., Furrer A., Mous S., Skopintsev P., James D., Dworkowski F., Båth P., Kekilli D., Ozerov D., Tanaka R., Glover H., Bacellar C., Brünle S., Casadei C. M., Diethelm A. D., Gashi D., Gotthard G., Guixà-González R., Joti Y., Kabanova V., Knopp G., Lesca E., Ma P., Martiel I., Mühle J., Owada S., Pamula F., Sarabi D., Tejero O., Tsai C.-J., Varma N., Wach A., Boutet S., Tono K., Nogly P., Deupi X., Iwata S., Neutze R., Standfuss J., Schertler G., and Panneels V., “ Ultrafast structural changes direct the first molecular events of vision,” Nature 615, 939 (2023).10.1038/s41586-023-05863-6 - DOI - PMC - PubMed
-
- Olmos J. L., Pandey S., Martin-Garcia J. M., Calvey G., Katz A., Knoska J., Kupitz C., Hunter M. S., Liang M., Oberthuer D., Yefanov O., Wiedorn M., Heyman M., Holl M., Pande K., Barty A., Miller M. D., Stern S., Roy-Chowdhury S., Coe J., Nagaratnam N., Zook J., Verburgt J., Norwood T., Poudyal I., Xu D., Koglin J., Seaberg M. H., Zhao Y., Bajt S., Grant T., Mariani V., Nelson G., Subramanian G., Bae E., Fromme R., Fung R., Schwander P., Frank M., White T. A., Weierstall U., Zatsepin N., Spence J., Fromme P., Chapman H. N., Pollack L., Tremblay L., Ourmazd A., Phillips G. N., and Schmidt M., “ Enzyme intermediates captured “on the fly” by mix-and-inject serial crystallography,” BMC Biol. 16, 59 (2018).10.1186/s12915-018-0524-5 - DOI - PMC - PubMed
-
- Dasgupta M., Budday D., De Oliveira S. H. P., Madzelan P., Marchany-Rivera D., Seravalli J., Hayes B., Sierra R. G., Boutet S., Hunter M. S., Alonso-Mori R., Batyuk A., Wierman J., Lyubimov A., Brewster A. S., Sauter N. K., Applegate G. A., Tiwari V. K., Berkowitz D. B., Thompson M. C., Cohen A. E., Fraser J. S., Wall M. E., Van Den Bedem H., and Wilson M. A., “ Mix-and-inject XFEL crystallography reveals gated conformational dynamics during enzyme catalysis,” Proc. Natl. Acad. Sci. U. S. A. 116, 25634 (2019).10.1073/pnas.1901864116 - DOI - PMC - PubMed
Grants and funding
LinkOut - more resources
Full Text Sources