. 2025 Feb 20;145(8):850-865.
doi: 10.1182/blood.2024026066.

BRAFV600E induces key features of LCH in iPSCs with cell type-specific phenotypes and drug responses

Affiliations

BRAFV600E induces key features of LCH in iPSCs with cell type-specific phenotypes and drug responses

Giulio Abagnale et al. Blood. .

Abstract

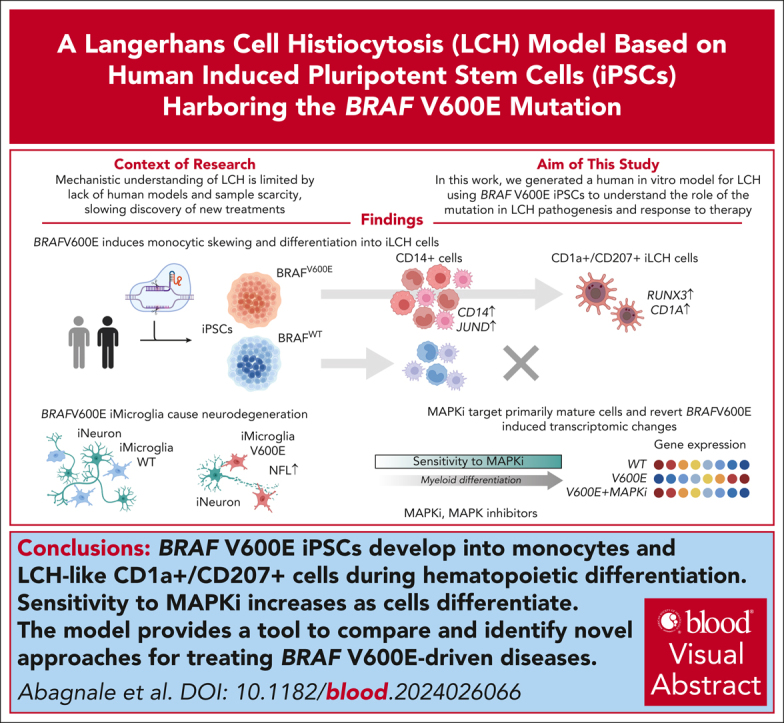
Langerhans cell histiocytosis (LCH) is a clonal hematopoietic disorder defined by tumorous lesions containing CD1a+/CD207+ cells. Two severe complications of LCH are systemic hyperinflammation and progressive neurodegeneration. The scarcity of primary samples and lack of appropriate models limit our mechanistic understanding of LCH pathogenesis and affect patient care. We generated a human in vitro model for LCH using induced pluripotent stem cells (iPSCs) harboring the BRAFV600E mutation, the most common genetic driver of LCH. We show that BRAFV600E/WT iPSCs display myelomonocytic skewing during hematopoiesis and spontaneously differentiate into CD1a+/CD207+ cells that are similar to lesional LCH cells and are derived from a CD14+ progenitor. We show that BRAFV600E modulates the expression of key transcription factors regulating monocytic differentiation and leads to an upregulation of proinflammatory molecules and LCH marker genes early during myeloid differentiation. In vitro drug testing revealed that BRAFV600E-induced transcriptomic changes are reverted upon treatment with mitogen-activated protein kinase (MAPK) pathway inhibitors (MAPKis). Importantly, MAPKis do not affect myeloid progenitors but reduce only the mature CD14+ cell population. Furthermore, iPSC-derived neurons (iNeurons) cocultured with BRAFV600E/WT iPSC-derived microglia-like cells, differentiated from iPSC-derived CD34+ progenitors, exhibit signs of neurodegeneration with neuronal damage and release of neurofilament light chain. In summary, the iPSC-based model described here provides a platform to investigate the effects of BRAFV600E in different hematopoietic cell types and provides a tool to compare and identify novel approaches for the treatment of BRAFV600E-driven diseases.


Conflict of interest statement

Conflict-of-interest disclosure: The authors declare no competing financial interests.

Figures

None
Graphical abstract
Figure 1.
Figure 1.
Generation and phenotypic characterization of iPSC-derived BRAFV600E/WT cells differentiating toward the monocytic lineage. (A) PBMCs of a patient with Langerhans cell histiocytosis (LCH) were reprogrammed into induced pluripotent stem cells (iPSCs) and then edited via CRISPR-associated protein 9 (Cas9) to introduce the V600E mutation in 1 endogenous BRAF allele as shown by Sanger sequencing. A synonymous mutation was introduced as part of the editing to prevent recutting by Cas9. A second iPSC line (ShiPS-miFF3) derived from a healthy infant was edited in similar way with Cas9 to introduce the V600E mutation in 1 endogenous BRAF allele. (B) Schematic of iPSCs differentiation toward CD14+ iMonocytes using STEMdiff Monocyte kit: a monolayer of iPSCs colonies is first differentiated toward mesoderm, then toward iHPCs, and finally toward CD14+ iMonocytes. First microscopy image on the left was acquired with a 5× air objective at room temperature on a Zeiss Axio Vert.A1 microscope; the remaining microscopy images were acquired with 20× objective with the same setup; scale bar, 100 μm. Images were processed with ImageJ. (C) Density plots of iPSCs at day 13 to 14 of monocytic differentiation showing smaller CD33/CD34+ and CD33/CD34 fractions for mutated than WT cells (n = 9). (D) BRAFV600E/WT iPSCs express CD14 at day 10 of differentiation, as shown by flow cytometry analysis (n = 5). (E) More BRAFV600E/WT iPSCs-derived CD14+ cells coexpressed CD11c than their WT counterpart as shown by flow cytometry analysis at day 13 of iMonocyte differentiation (n = 6). (F-G) BRAFV600E/WT develop unique CD14low/CD1c+ (n = 7) and CD1a+ (n = 8) populations that are missing in the WT isogenic control while they differentiate into iMonocytes as shown by flow cytometry density plots. (H) Schematic of developmental trajectory experiment. BRAFV600E/WT iPSCs differentiating toward iMonocytes were sorted in 4 fractions via fluorescence-activated cell sorting (FACS): (1) CD14/CD1c, (2) CD14low/CD1c, (3) CD14high/CD1cint, and (4) CD14low/CD1c+. Each fraction was then cultured separately from the others for 4 days after which cells were restained and analyzed as shown in panel I and J. (I) Density plot showing the 4 fractions sorted in panel H analyzed after 4 days of culture: CD14/CD1c can reconstitute all other fractions but developmental potential decreases as cells differentiate toward CD14low/CD1c+ cells. (J) Same cells shown in panel I were also stained and gated for CD1a and CD207 expression to demonstrate that CD14low/CD1c+ fraction is enriched of CD1a+/CD207+ iLCH cells that derive from a CD14+ precursor and have a similar surface marker expression to lesional LCH cells. (K) Representative FACS plot of BRAFV600E/WT CD14low/CD1c+, sorted cells as in panel I and cultured for 7 days with granulocyte-macrophage colony-stimulating factor (GM-CSF), TNF-α, and transforming growth factor β1 (TGF-β1). (L) Quantification of CD1a+/CD207+ iLCH cells (n = 4) obtained from cells sorted as in panel I and cultured for 7 days with GM-CSF, TNF-α, and TGF-β1. For statistical significance of panels C-G unpaired parametric Student t test was used with Welch correction when variance was significant between groups, ∗P < .05, ∗∗P < .01, ∗∗∗P < .001, ∗∗∗∗P < .0001. All histograms except in panel L include replicates from patient-derived iPSCs as well as ShiPS-MIFF3 iPSCs cell line. iPSC, induced pluripotent stem cells; LCH, Langerhans cell histiocytosis.
Figure 2.
Figure 2.
Transcriptomic regulation of inflammation and cell differentiation induced by BRAFV600E is cell type–specific and begins in myeloid progenitors. (A) Uniform manifold approximation and projection (UMAP) of 64 167 single living cells sequenced: 6 samples (3 × BRAFV600E/WT and 3 × BRAFWT/WT) were harvested at day 14, and 2 samples at day 11 (1 × BRAFV600E/WT and 1 × BRAFWT/WT) of differentiation toward iMonocytes. The main clusters discussed in this paper are highlighted as Myeloid Progenitors, Monocytes, and MΦs/DCs. (B) Frequencies of cell types between mutated and WT samples at day 14: BRAFV600E/WT samples show fewer Myeloid Progenitors and Promonocytes than BRAFWT/WT, consistent with a monocytic skewing induced by the mutation. (C) Pseudotime analysis using Monocle 3 of selected clusters showing that BRAFV600E/WT cells have higher density at later pseudotimes, supportive of their ability to differentiate faster than their WT counterpart. (D) Dot plots showing DEGs (adjusted P value <.05, positive fold change means higher in BRAFV600E/WT) associated with LCH and (E) inflammatory mediators. Dots for gene/cluster combinations, which are not significant, are not shown. (F) Gene set enrichment analysis (GSEA) shows that some pathways were uniquely enriched (adjusted P value <.05) for each cluster whereas others displayed similar normalized enrichment scores (NESs) among several clusters. A NES of >0 indicates positive enrichment in BRAFV600E/WT clusters. (G) Dot plot of differentially expressed TFs and modulators between clusters: most DEGs are in the Myeloid Progenitors and Monocyte clusters. Dots for gene/cluster combinations, which are not significant, are not shown. (H) Enrichr analysis of downregulated DEGs in mutated vs WT samples (adjusted P value <.05) with enrichment scores shown as negative log10 of their adjusted P value. The letter in brackets in panels F,H indicates the database of each ontology/pathway of the heat map: Reactome_2022 (R), Transcription_Factor_PPIs (T), GO_Biological_Process_2021 (G), Rare_Diseases_GeneRIF_ARCHS4_Predictions (D), MSigDB_Hallmark_2020 (M), and KEGG_2021_Human (K). (I) Dot plot of DEGs at day 11 of differentiation involved in myelomonocytic differentiation. BRAFV600E/WT induces downregulation of key genes associated with granulopoiesis (CEBPE, PRTN3, MPO, ELANE, and AZU1) and upregulation of monocyte-specific markers and TFs (MAFB, CD14, and S100A12). Dots for gene/cell type combinations, which are not significant, are not shown. (J) Regulon analysis showing the top 5 scoring regulons for Monos LYZ High, Myeloid Progenitors, and Promonocytes clusters in mutated and WT samples. (K) Heat map highlighting regulons that are uniquely present in either WT or mutated Monos LYZ High, Myeloid Progenitors, and Promonocytes clusters by showing their binary SCENIC area under the curve scores.
Figure 3.
Figure 3.
Transcriptomic characterization of iPSC-derived CD1a+/CD207+ iLCH cells using scRNA-seq reveals similarity to LCH subsets found in lesions. (A) BRAFV600E/WT CD14low/CD1c+ were cultured with GM-CSF, TNF-α, and TGF-β1 to generate iLCH cells. Living CD1a+/CD207 and CD1a+/CD207+ cells were sorted and used for scRNA-seq. (B) UMAP of 8483 sequenced cells from 2 independent experiments. (C) Feature plot showing the expression of CD1A and CD207 in the data set. (D) Violin plots showing that iLCH cells are heterogeneous and express markers defining different subsets of lesional cells in LCH biopsies. Cluster iLCH_5 expresses proliferative markers (HMMR, CDK1, and MKI67) similar to high-entropy LCH subsets, whereas cluster iLCH_7 expresses IFI6, IFIT3, and ISG15, similar to low-entropy LCH subsets. (E) UCell scoring was created using gene lists from 3 different data sets: (1) GSE173923, top100 makers (using FindMarkers function in Seurat) of LCH cell cluster, of Kvedaraite et al; (2) GSE133706, 77 marker genes distinguishing LCH from non-LCH immune cells described in Table S2 of Halbritter et al; and (3) GSE35340 884 genes that are differentially expressed in LCH vs LC described in Hutter et al (and listed as supplemental File 1 in Schwentner et al18). The results show that iLCH cells are much closer to lesional LCH cells than to physiological LCs (E-MTAB-8142). (F) Projection of iLCH on a scRNA-seq data set composed of healthy LCs (E-MTAB-8142) and tumoral LCH cells from biopsies. Overall, 99% of iLCH cells project on the LCH data set and only 1% on the subset of healthy epidermal LCs. (G) Dot plot of several transcripts expressed in LCH vs LC cells showing similar expression profiles between iLCH and LCH cells.
Figure 4.
Figure 4.
Effect of MAPKis on cell numbers and single-cell transcriptome of different populations of iPSC-derived myelomonocytic cells. (A) Schematic of drug treatments on BRAFV600E/WT and BRAFWT/WT iPSCs derived cells: at day 7 of the protocol, culture medium is either switched to monocyte differentiation medium to generate CD14+ iMonocytes or kept as medium B to generate CD34+ iHPCs. For both culture conditions, cells are harvested at day 12 and either sorted for CD34+ expression (iHPCs) or into CD14+ and CD14 fractions (iMonocytes). The separate fractions are cultured in 96-well plates with MAPKis or their respective DMSO/untreated controls for 48 hours. Cells are analyzed and counted via FACS. (B) Flow cytometry analysis of all living cell numbers for CD34+ BRAFV600E/WT iHPCs normalized to DMSO after 48 hours of treatment with different MAPKis (n = 4 for all drugs except for trametinib and cobimetinib which was n = 3). Dotted line equaling 1 indicates DMSO. (C) Flow cytometry analysis of numbers of all living cells normalized to DMSO for BRAFV600E/WT and BRAFWT/WT cells sorted at day 12 of monocytic differentiation into CD14+ and CD14 fractions then treated for 48 hours with different MAPKis (n = 6 for BRAFV600E/WT CD14 cells, n = 5 for BRAFV600E/WT CD14+ cells, and n = 4 for all BRAFWT/WT cells). Dotted line equaling 1 indicates DMSO. (D) CD14 fractions from BRAFV600E/WT samples were isolated at day 12 of monocytic differentiation and then treated for 48 hours with different MAPKis. Four different populations based on expression of CD14 or CD1C (same scheme as Figure 1H) were defined in flow cytometry and their numbers normalized to DMSO are shown (n = 6). Dotted line equaling 1 indicates DMSO. ∗P < .05, ∗∗P < .01, ∗∗∗P < .001, ∗∗∗∗P < .0001. Panels B-C include replicates from patient-derived iPSCs as well as ShiPS-MIFF3 iPSCs cell line. For the statistical analysis of panels B-D, log-transformed ratios of cell numbers in drugs/DMSO were used. A mixed multivariate model was used with different inhibitors (belvarafenib, tovorafenib, encorafenib, dabrafenib, trametinib, and cobimetinib) mutation status (V600E or WT) and fraction (CD14+, CD14, or CD34+) as fixed effects. Pairwise post-hoc testing was carried out using the Tukey method. (E) UMAP of integrated scRNA-seq data set comprising 16 502 cells generated from fraction sorted as shown in supplemental Figure 8A. For the annotation, the same labels as in Figure 2 were used. (F-G) Bar plots showing the distribution of cell clusters and cell cycle phases among treated samples. (H) Dot plots showing DEGs (adjusted P value <.05, log2-fold change of less than −0.5 or >0.5) between V600E vs WT samples (left, data set from Figure 2), belvarafenib- vs DMSO-treated cells (center), or dabrafenib- vs DMSO-treated cells (right) among the same clusters. A positive log2-fold change indicates higher expression in V600E vs WT or in treatment vs DMSO. Transcripts that are upregulated in BRAFV600E/WT vs BRAFWT/WT cells are downregulated upon treatment and vice versa. Dots for gene/cluster combinations, which are not significant, are not shown. (I) GSEA shows pathways that are positively (NES > 0) or negatively enriched (NES < 0) in treated vs DMSO cells. Some ontology terms have a similar score between dabrafenib- and belvarafenib-treated cells whereas others are only enriched in 1 of the 2 drugs or are negatively enriched for 1 inhibitor but positively enriched for the other. The letter in brackets indicates the database of each ontology/pathway of the heat map: Reactome_2022 (R), GO_Biological_Process_2021 (G), MSigDB_Hallmark_2020 (M), KEGG_2021_Human (K), TRRUST_Transcription_Factors_2019 (TR), and Azimuth_Cell_Types_2021 (A). (J) Heat map highlighting selected regulons, analyzed using the SCENIC package, that are present in either belvarafenib-, dabrafenib-, or DMSO-treated samples.
Figure 5.
Figure 5.
Differentiation of iMGLs from patient-derived iPSCs. (A) Schematic of differentiation of human patient-derived BRAFV600E/WT iPSCs into microglia. iPSCs were first differentiated into iHPCs for 12 days and then further differentiated into iMGLs for 24 days, followed by 4 to 10 days of iMGL maturation (B-E) Bar plot showing the differentiation efficiency of iHPCs toward iMGLs at day 5 of iMGL maturation of 4 independent experiments (except for panel B in which n = 11) determined by expression of lineage markers CD11b and CD45 (B), fractalkine receptor CX3CR1 (C), CD115 (macrophage colony-stimulating factor receptor) (D), and CD11c (E). (F) Bar plot showing the expression of LCH surface markers CD1a and CD207 (G) via flow cytometry of 6 or 4 independent experiments, respectively. Paired parametric Student t test was used when variance was significant between groups, ∗P < .05, ∗∗P < .01. (H) UMAP of 16 818 single living cells sequenced for scRNA-seq; 5 samples (3 × BRAFV600E/WT and 2 × BRAFWT/WT) were collected at day 5 of iMGL maturation. Unsupervised clustering identified 6 iMGL clusters named iMGL1-6. (I) Bar plot showing the distribution of BRAFV600E/WT and BRAFWT/WT cells in the different clusters. Frequencies of <2% are not shown in the bar plot. (J) A microglia marker score was calculated based on the expression of 12 genes (AIF1, C1QA, CSF1R, CD74, C3, CX3CR1, MERTK, P2RY12, TREM2, TYROBP, ITGAM, and ITGAX), commonly used as microglia marker genes. (K) Enrichr analysis for specific markers per cluster of the iMGL data set and (L) for genes upregulated in BRAFV600E/WT iMGLs in comparison to BRAFWT/WT iMGLs. Letter in brackets in panels K-L indicates the database for each ontology/pathway of the heat map or bar plot, respectively: WikiPathway 2023 (W), HDSigDB Human 2021 (H), DisGeNET (N), GO_Biological_Process_2021 (G), MSigDB_Hallmark_2020 (M), and KEGG_2021_Human (K).
Figure 6.
Figure 6.
BRAFV600E/WT iMGLs lead to neurodegeneration of iNeurons. (A) Schematic of differentiation of human patient-derived iPSCs into neuronal precursor cells and further forebrain iNeurons is shown, for midbrain iNeurons cells are kept 1 additional week in maturation medium. On day 36 of iMGL differentiation iMGLs were added to iNeurons on day 27 or day 34 of forebrain or midbrain iNeuron differentiation, respectively. Fresh iMGLs were repeatedly added to iNeurons. (B) At day 8 of differentiation neural rosettes are visible. Original magnification: 10×, scale bar: 100 μm. Image was acquired on an Axio Vert.A1 at room temperature. (C) Mature forebrain iNeurons on day 28 after embryoid body formation. Immunofluorescence staining for TUB3 (yellow, Alexa Fluor 488), synapsin (red, Alexa Fluor 568), and DAPI (4′,6-diamidino-2-phenylindole; blue). (D) Mature midbrain iNeurons on day 35 after embryoid body formation. Immunofluorescence staining for nestin (green, Alexa Fluor 488), TH (red, Alexa Fluor 568), and DAPI (blue). (E) Immunofluorescence staining of TH (yellow, Alexa Fluor 568), synapsin (green, Alexa Fluor 488), CD45 (red, Alexa Fluor647), and DAPI (blue): left panel, midbrain iNeurons with WT patient-derived iMGLs; right panel, with mutant patient iMGLs. For panels C-E, pictures were acquired using a Leica SP8 with 40× water objective. (F) Quantification of TH expression in neurite segments of midbrain iNeurons as sum of intensity per well from 5 independent experiments. At least 7 wells per experiment were acquired. (G) Quantification of synapsin expression in midbrain iNeurons as sum of intensity of a well from 3 independent experiments. At least 7 wells per experiment were acquired. (H) Quantification of released NFL in pg/mL from midbrain iNeurons cocultured with either WT or mutated iMGLs from 3 independent experiments. At least 7 wells were analyzed per experiment. NFL was measured using an enzyme-linked immunosorbent assay (ELISA) assay and the supernatants were diluted 1:45. (I) Immunofluorescence staining of coculture of human patient-derived iPSC forebrain iNeurons with iMGLs, synapsin (magenta, Alexa Fluor 568), TUB3 (green, Alexa Fluor 488), CD45 (red, Alexa Fluor 647), and DAPI (blue); left panel, forebrain iNeurons with WT iMGLs; right panel, with mutant iMGLs. (J) Quantification of TUB3 and (K) synapsin expression as sum of intensity of a well in forebrain iNeurons from 3 independent experiments. At least 7 wells per experiment were acquired. (L) Quantification of released NFL in pg/mL from forebrain iNeurons in coculture with BRAFV600E/WT or BRAFWT/WT iMGLs, from 3 independent experiments. At least 7 wells were analyzed per experiment. NFL was measured using an ELISA assay and the supernatants were diluted 1:45. Unpaired parametric Student t test was used with Welch correction when variance was significant between groups, ∗∗∗∗P < .0001. All results presented in this figure were obtained using human patient-derived iPSC iNeurons and iMGLs.

Comment in

References

    1. McClain KL, Bigenwald C, Collin M, et al. Histiocytic disorders. Nat Rev Dis Primers. 2021;7(1):73. - PMC - PubMed
    1. Emile JF, Cohen-Aubart F, Collin M, et al. Histiocytosis. Lancet. 2021;398(10295):157–170. - PMC - PubMed
    1. Badalian-Very G, Vergilio JA, Degar BA, et al. Recurrent BRAF mutations in Langerhans cell histiocytosis. Blood. 2010;116(11):1919–1923. - PMC - PubMed
    1. Cantwell-Dorris ER, O'Leary JJ, Sheils OM. BRAFV600E: implications for carcinogenesis and molecular therapy. Mol Cancer Ther. 2011;10(3):385–394. - PubMed
    1. Yu RC, Chu C, Buluwela L, Chu AC. Clonal proliferation of Langerhans cells in Langerhans cell histiocytosis. Lancet. 1994;343(8900):767–768. - PubMed

MeSH terms

Substances