Clinical Trial
. 2025 Feb 27;145(9):944-955.
doi: 10.1182/blood.2024026124.

Targeted interferon therapy with modakafusp alfa for relapsed or refractory multiple myeloma

Affiliations
Clinical Trial

Targeted interferon therapy with modakafusp alfa for relapsed or refractory multiple myeloma

Dan T Vogl et al. Blood. .

Abstract

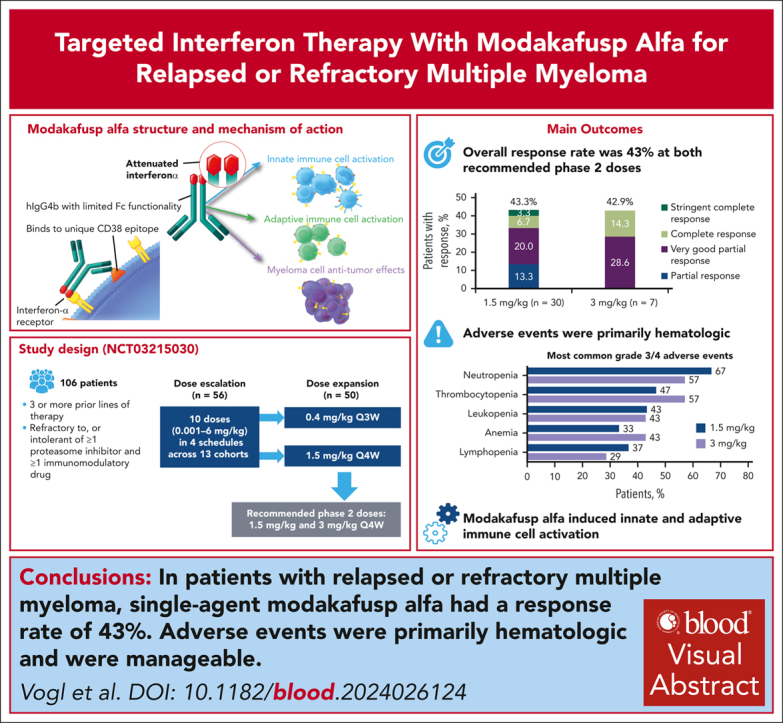
Interferon alfa has activity against multiple myeloma (MM). Modakafusp alfa is an immunocytokine comprising 2 attenuated interferon alfa-2b molecules and an anti-CD38 immunoglobulin G4 antibody, targeting delivery of interferon alfa to CD38-expressing (CD38+) immune and myeloma cells. This phase 1/2 trial enrolled patients with relapsed/refractory multiple myeloma with ≥3 prior lines of treatment and refractory to, or intolerant of, ≥1 proteasome inhibitor and ≥1 immunomodulatory drug. During dose escalation, modakafusp alfa was administered at 10 doses in 4 schedules across 13 cohorts. The primary end point was safety for dose escalation, and overall response rate (ORR) for dose expansion. We enrolled 106 patients who had received a median of 6.5 lines of prior therapy; 84% of patients had myeloma previously refractory to an anti-CD38 antibody. The most feasible dosing schedule was every 4 weeks (Q4W), at which the maximum tolerated dose was 3 mg/kg. Among 30 patients treated at 1.5 mg/kg Q4W, the ORR was 43.3%, with a median duration of response of 15.1 months (95% confidence interval [CI], 7.1-26.1); median progression-free survival was 5.7 months (95% CI, 1.2-14). Grade ≥3 adverse events (AEs) occurred in 28 (93.3%) patients, the most common were neutropenia (66.7%) and thrombocytopenia (46.7%); infections were reported in 8 (26.7%) patients (including grade 3 in 4 [16.7%]). Modakafusp alfa therapy induced upregulation of the type 1 interferon gene signature score, increased CD38 receptor density in CD38+ cells, and innate and adaptive immune cell activation. Modakafusp alfa resulted in antitumor activity and immune activation in patients with MM. AEs were primarily hematologic. This trial was registered at www.clinicaltrials.gov as #NCT03215030.


Conflict of interest statement

Conflict-of-interest disclosure: D.T.V. reports consulting fees from Takeda, GSK, Genentech, Janssen, Karyopharm, and Oncopeptides; and grants or funds from Takeda and Active Biotech. S.A. reports consulting fees from Janssen and GSK, and grants or funds from Amgen, Janssen, GSK, Bristol Myers Squibb, Karyopharm, and Incyte. S.A.H. reports participation on advisory council or committee for Takeda; consulting fees from AbbVie, Bristol Myers Squibb/Celgene, Janssen, Oncopeptides, Secura Bio, and Takeda; and grants or funds from Bristol Myers Squibb and Oncopeptides. O.N. reports participation on advisory council or committee for Janssen, Bristol Myers Squibb, Karyopharm, Sanofi, Takeda, GPCR Therapeutics, GSK, and Adaptive Biotechnologies; consulting fees from GPCR Therapeutics; and grants or funds from Janssen and Takeda. M.C. reports employment with Bristol Myers Squibb. N.B. reports consulting fees from Janssen, Sanofi, Bristol Myers Squibb, GSK, AbbVie, and Pfizer; and participation in speakers bureau for Janssen. K.S., S.C., and C.L. report employment with and ownership of stocks/shares in Takeda. Y.L. and X.P. report employment with Takeda. X.P. reports owning stock/shares in Takeda. J.L.K. reports consulting fees from Bristol Myers Squibb, Ascentage, Roche, Sanofi, and Sebia. D.B. declares no competing financial interests.

Figures

None
Graphical abstract
Figure 1.
Figure 1.
Disposition of patients during dose escalation and dose expansion. ∗Patients were enrolled under the modified QW schedule but treated every 2 weeks. Sequence of doses by schedule: modified QW schedule: started at 0.001 mg/kg, followed by 0.01 mg/kg, 0.1 mg/kg, 0.75 mg/kg, and discontinuation of schedule. Q2W: started at 0.4 mg/kg, deescalated to 0.3 mg/kg, followed by 0.2 mg/kg, and discontinuation of schedule. Q3W: started at 0.4 mg/kg, escalated to 0.75 mg/kg, and discontinuation of schedule. Q4W: started at 0.75 mg/kg, escalated to 1.5 mg/kg, followed by 3 and 6 mg/kg; MTD declared at 3 mg/kg. d, day; Dex, dexamethasone; QW, weekly.
Figure 2.
Figure 2.
Response to single-agent modakafusp alfa in patients with R/R MM. (A) Responses over time in 20 patients who had an overall response (partial or better) among 89 patients in the study who received single-agent modakafusp alfa. (B) Rates of sCR, CR, VGPR, and PR in patients who were treated with modakafusp alfa 1.5 mg/kg Q4W, 3 mg/kg Q4W, and all other doses and schedules of single-agent modakafusp alfa. ∗Includes patients in dose escalation (n = 5) and dose expansion (n = 25). One patient was not response evaluable. (C) Exploratory subgroup analyses in 37 patients treated with modakafusp alfa 1.5 mg/kg or 3 mg/kg Q4W. MR, minimal response; PR, partial response; QW, weekly; SD, standard deviation; sCR, stringent CR; yr, year.
Figure 3.
Figure 3.
Modakafusp alfa binds to CD38 and induces type 1 interferon pathway activation in the peripheral blood of patients with R/R MM. Line graphs (mean ± standard deviation) and box and whisker plots (whiskers 10-90 percentile) depict the percent of CD38 receptors on viable leukocytes occupied by modakafusp alfa (A); the fold change in the type 1 interferon gene signature score, as defined by the average fragments per kilobase of exon per million mapped fragments (FPKM) of 25 interferon-stimulated genes (B); the fold change in CD38 receptor density on NK cells, T cells, and myeloma cells (defined as viable leukocytes that are CD138+ SSC-mid CD19 CD20) (C); the percentage of activated NK cells and CD8 T cells, as defined by CD69 expression (D); and serum concentration of MCP-2 (E) for peripheral blood samples collected during C1. Baseline for all data sets is defined as C1D1 predose. C1D15 statistical evaluations did not include patients dosed on the modified QW schedule (0.001, 0.01, and 0.1 mg/kg dose levels) because of an increased number of doses administered before C1D15 compared with other schedules. Statistical evaluations were not conducted for C1D3 and C1D8 because of limited sample numbers nor C2D1 predose because of the varying cycle lengths and dosing frequency. A linear regression model was used to evaluate the trend DR. Wilcoxon signed rank test was used to determine whether pooled data from all doses, except at C1D15 as noted, per time point were significantly changed from baseline. A significant ΔBL was defined as a fold change of ≥1.5 above, or ≤2/3 below, baseline for cellular markers (panels A,C,D); similarly, for gene expression and cytokines (panels B,E), a significant ΔBL was defined as a fold change ≥2 or ≤1/2. The ΔBL thresholds for CD38 density changes are shaded in gray on panel C. DR and ΔBL P values are depicted above data sets. If there was no significant DR P value, data was collapsed by time point. Statistical analysis findings for panel C can be found in supplemental Figure 5B-D. ΔBL, change from baseline; C, cycle; D, day; DR, dose responsiveness; IFN, interferon; MCP-2, monocyte chemotactic protein-2; MdFI, median fluorescence intensity; n.s., nonsignificant result; QW, once weekly; SSC, side scatter.
Figure 4.
Figure 4.
Correlative analysis of biomarker data in the bone marrow of patients with R/R MM treated with modakafusp alfa. Box and whisker plots (whiskers 10-90 percentile) depict percent of CD38 receptors occupied on viable leukocytes of the bone marrow (A); fold change in the type 1 interferon gene signature score in the bone marrow as defined by the average FPKM of 25 interferon-stimulated genes (B); fold change in CD38 density on NK cells of the bone marrow (C); myeloma cells of the bone marrow (D); and T cells of the bone marrow (E). Baseline for all data sets was defined as the sample collected during screening. Because of limited sampling of the bone marrow, C1D16, C2D2, C3D2, and C4D2 were evaluated for statistical significance together because all assessments were planned 24 hours (±2 days) after modakafusp alfa was administered. A linear regression model was used to evaluate the trend of DR. Wilcoxon signed-rank test was used to determine whether pooled data from all doses were significantly changed from baseline. A significant ΔBL was defined as a fold change of ≥1.5 above, or ≤2/3 below, baseline for cellular markers (panels A,C-E); similarly, for gene expression (panel B), a significant ΔBL was defined as a fold change of ≥2 or ≤1/2. The ΔBL thresholds are shaded in gray on each panel as applicable. DR and ΔBL P values are depicted above data sets. ΔBL, change from baseline; C, cycle; D, day; DR, dose responsiveness; IFN, interferon; ISG, interferon-stimulated gene; n.s., nonsignificant result; SSC, side scatter.

Comment in

References

    1. Podar K, Leleu X. Relapsed/refractory multiple myeloma in 2020/2021 and beyond. Cancers (Basel) 2021;13(20):5154. - PMC - PubMed
    1. Yong K, Delforge M, Driessen C, et al. Multiple myeloma: patient outcomes in real-world practice. Br J Haematol. 2016;175(2):252–264. - PMC - PubMed
    1. Khoo TL, Vangsted AJ, Joshua D, Gibson J. Interferon-alpha in the treatment of multiple myeloma. Curr Drug Targets. 2011;12(3):437–446. - PubMed
    1. Budhwani M, Mazzieri R, Dolcetti R. Plasticity of type I interferon-mediated responses in cancer therapy: from anti-tumor immunity to resistance. Front Oncol. 2018;8:322. - PMC - PubMed
    1. Fritz E, Ludwig H. Interferon-alpha treatment in multiple myeloma: meta-analysis of 30 randomised trials among 3948 patients. Ann Oncol. 2000;11(11):1427–1436. - PubMed

Publication types

Associated data

LinkOut - more resources