. 2025 Jan;12(4):e2409781.
doi: 10.1002/advs.202409781. Epub 2024 Dec 4.

GLP-1 Receptor Agonists Alleviate Diabetic Kidney Injury via β-Klotho-Mediated Ferroptosis Inhibition

Affiliations

GLP-1 Receptor Agonists Alleviate Diabetic Kidney Injury via β-Klotho-Mediated Ferroptosis Inhibition

Shasha Tian et al. Adv Sci (Weinh). 2025 Jan.

Abstract

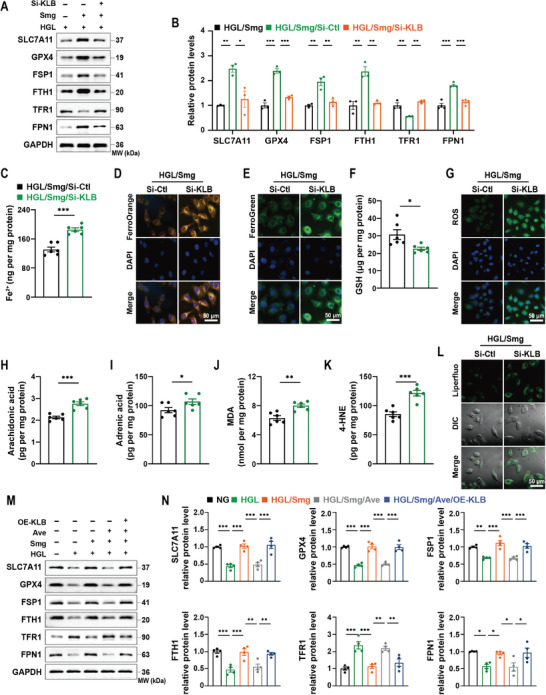
Semaglutide (Smg), a GLP-1 receptor agonist (GLP-1RA), shows renal protective effects in patients with diabetic kidney disease (DKD). However, the exact underlying mechanism remains elusive. This study employs transcriptome sequencing and identifies β-Klotho (KLB) as the critical target responsible for the role of Smg in kidney protection. Smg treatment alleviates diabetic kidney injury by inhibiting ferroptosis in patients, animal models, and HK-2 cells. Notably, Smg treatment significantly increases the mRNA expression of KLB through the activation of the cyclic adenosine monophosphate (cAMP) signaling pathway, specifically through the phosphorylation of protein kinase A (PKA) and cAMP-response element-binding protein (CREB). Subsequently, the adenosine monophosphate-activated protein kinase (AMPK) signaling pathway is activated, reprograming the key metabolic processes of ferroptosis such as iron metabolism, fatty acid synthesis, and the antioxidant response against lipid peroxidation. Suppression of ferroptosis by Smg further attenuates renal inflammation and fibrosis. This work highlights the potential of GLP-1RAs and KLB targeting as promising therapeutic approaches for DKD management.

Keywords: GLP‐1 receptor agonist; diabetic kidney disease; ferroptosis; semaglutide; β‐Klotho.


Conflict of interest statement

The authors declare no conflict of interest.

Figures

Figure 1
Figure 1
Semaglutide (Smg) protects the kidney and inhibits ferroptosis in patients with diabetic kidney disease (DKD). Representative magnetic resonance images of DKD patients receiving insulin detemir (once daily, DKD/Ins) or Smg (0.5 mg once weekly, DKD/Smg) at the timepoints of baseline and week 28: A–D) ASL, mDixon, BOLD, and DTI‐FA. E–H) Comparison of the change of RBF, FF, R 2*, and FA. I–L) The changes in serum levels of Fe2+, GSH, MDA, and 4‐HNE in DKD/Ins and DKD/Smg groups. M–P) The changes in urine levels of Fe2+, GSH, MDA, and 4‐HNE in the two groups. ASL: arterial spin labeling, mDixon: modified Dixon; BOLD: blood oxygenation level‐dependent; DTI‐FA: diffusion tensor imaging for fractional anisotropy; RBF: renal blood flow; FF: fat fraction; GSH: glutathione; MDA: malondialdehyde; 4‐HNE 4‐hydroxynonenal. Data are presented as mean ± standard error (A–D, n = 3; I–P, n ≥13). Statistical comparison was performed using an unpaired two‐tailed Student's t‐test. ns, no significant difference, *p < 0.05, **p < 0.01, ***p < 0.001.
Figure 2
Figure 2
Smginhibits ferroptosis and reduces kidney injury in DKD mice. A) Schematic illustration of dosing regimen for control (Ctl), DKD, DKD/Smg, and DKD/Fer‐1 groups. B) Graphs of blood glucose changes after STZ injection (40 mg kg−1, five consecutive days) in four groups of mice. C, D) Immunoblot analysis and quantification of proteins associated with ferroptosis in kidney tissues of Ctl, DKD, DKD/Smg, and DKD/Fer‐1 mice. E–H) Quantification of Fe2+, GSH, MDA, and 4‐HNE of kidney tissues in the indicated groups. I‐K) The concentration of kidney injury biomarkers in the indicated groups. L) Immunoblot of renal tubular injury markers of kidney tissues in the indicated groups. M, N) Representative images and quantification of H&E, Masson, and PAS staining of kidney tissues in Ctl, DKD, DKD/Smg, and DKD/Fer‐1 groups. DKD mice received Smg (DKD/Smg, 60 µg kg−1, twice a week) or Fer‐1 (DKD/Fer‐1, 1 mg kg−1, daily) for eight weeks. Fer‐1: Ferrostatin‐1; SLC7A11, solute carrier family 7 member 11; GPX4, glutathione peroxidase 4; FSP1, ferroptosis suppressor protein 1; FTH1, ferritin heavy chain; TFR1, transferrin receptor 1; FPN1, ferroportin; GSH: glutathione; MDA: malondialdehyde; 4‐HNE: 4‐hydroxynonenal; KIM‐1: Kidney injury molecule 1; NGAL: Neutrophil gelatinase‐associated lipocalin. Data are presented as mean ± standard error (n ≥ 6). Statistical comparison was performed using one‐way ANOVA with a Tukey post‐hoc analysis, *p < 0.05, **p < 0.01, ***p < 0.001.
Figure 3
Figure 3
Smg attenuates kidney inflammation and fibrosis in the mice model of DKD. A–E) ELISA quantification of IL‐1β, TNF‐α, IL‐6, MCP‐1, and IL‐10 in kidney tissues from three different mice models. F, G) Immunoblot analysis and quantification of proteins associated with inflammation in kidney tissues of Ctl, DKD, DKD/Smg, and DKD/Fer‐1 mice. H) ELISA quantification of TGF‐β1. I, J) Immunoblot analysis and quantification of proteins associated with fibrosis in kidney tissues of Ctl, DKD, DKD/Smg, and DKD/Fer‐1 mice. K–N) Representative immunostaining images related to fibrosis of kidney tissues in Ctl, DKD, DKD/Smg, and DKD/Fer‐1 groups. DKD mice received Smg (DKD/Smg, 60 µg kg−1, twice a week) or Fer‐1 (DKD/Fer‐1, 1 mg kg−1, daily) for eight weeks. Fer‐1: Ferrostatin‐1; NFκB, nuclear factor kappa B; IL‐1β, interleukin‐1β; TNF‐α, tumor necrosis factor‐α; IL‐6, interleukin‐6; MCP‐1, monocyte chemoattractant protein‐1; TGF‐β1, transforming growth factor‐beta 1; E‐cad, E‐cadherin; α‐SMA, alpha‐smooth muscle action. Data are presented as mean ± standard error (n ≥ 6). Statistical comparison was performed using one‐way ANOVA with a Tukey post‐hoc analysis, *p < 0.05, **p < 0.01, ***p < 0.001.
Figure 4
Figure 4
Smg alleviates ferroptosis in HK‐2 cells induced by a high concentration of glucose and lipid (i.e., HGL). A) Quantification of intracellular Fe2+. B, C) Confocal imaging of cytosolic and mitochondrial ferrous iron (Fe2+) by fluorescent FerroOrrange and FerroGreen probe, respectively. D–F). Quantification of intracellular GSH, NAD+/NADH, and NADP+/NADPH. G) Confocal imaging of intracellular ROS. H–K) Quantification of intracellular arachidonic acid, adrenic acid, MDA, and 4‐HNE. L) Confocal imaging of lipid peroxides. M) Mitochondrial morphology analysis by transmission electron microscope. N, O) Immunoblot analysis and quantification of proteins associated with ferroptosis of HK‐2 cells in the indicated groups. HK‐2 cells were cultured in NG: 5.5 mM glucose; HGL: 35 mM glucose and 120 µM palmitic acid/PA; HGL/Smg: HGL plus 400 nM Smg; ferroptosis inducers: 0.3 µM RSL3 or 4 µM Erastin. All of these assays were performed after the HK‐2 cells culturing for 48 hours under different conditions. GSH: glutathione; ROS: reactive oxygen species; MDA: malondialdehyde; 4‐HNE: 4‐hydroxynonenal; SLC7A11, solute carrier family 7 member 11; GPX4, glutathione peroxidase 4; FSP1, ferroptosis suppressor protein 1; FTH1, ferritin heavy chain; TFR1, transferrin receptor 1; FPN1, ferroportin. Data are presented as mean ± standard error (n ≥ 3). Statistical comparison was performed using one‐way ANOVA with a Tukey post‐hoc analysis, *p < 0.05, **p < 0.01, ***p < 0.001.
Figure 5
Figure 5
Smg alleviates inflammation, fibrosis, and kidney damage via ferroptosis inhibition in HK‐2 cells. A, B) Immunoblot analysis and quantification of proteins associated with inflammation of HK‐2 cells in the indicated groups. C, D) Immunoblot analysis and quantification of proteins associated with fibrosis of HK‐2 cells in the indicated groups. E, F) Immunoblot analysis and quantification of proteins associated with tubular damage of HK‐2 cells in the indicated groups. G) Schematic illustration of diabetes‐induced renal ferroptosis promoting renal inflammation and fibrosis. HK‐2 cells were cultured in NG: 5.5 mM glucose; HGL: 35 mM glucose and 120 µM palmitic acid/PA; HGL/Smg: HGL plus 400 nM Smg; ferroptosis inducers: 0.3 µM RSL3 or 4 µM Erastin. All of these assays were performed after the HK‐2 cells culturing for 48 hours under different conditions. NFκB, nuclear factor kappa B; IL‐1β, interleukin‐1β; TNF‐α, tumor necrosis factor‐α; IL‐6, interleukin‐6; MCP‐1, monocyte chemoattractant protein‐1; TGF‐β1, transforming growth factor‐beta 1; E‐cad, E‐cadherin; α‐SMA, alpha‐smooth muscle action; KIM‐1: Kidney injury molecule 1; NGAL: Neutrophil gelatinase‐associated lipocalin. Data are presented as mean ± standard error (n ≥ 3). Statistical comparison was performed using one‐way ANOVA with a Tukey post‐hoc analysis, * p < 0.05, **p < 0.01, ***p < 0.001.
Figure 6
Figure 6
Smg regulates the AMPK signaling pathway via KLB under HGL condition. A) Volcano plot showing the upregulated genes in Smg‐incubated HK‐2 cells under HGL condition. B, C) Immunoblot analysis of KLB protein expression in vitro and vivo experiments under diabetic condition and combined with Smg treatment. D, E) The changes of serum and urine concentration of soluble β‐Kloth in DKD/Ins and DKD/Smg patients. F) Bubble diagram of KEGG pathways enrichment analysis for the top ten pathways under Smg treatment. G) The intracellular concentration of cAMP in HK‐2 cells treated by NG, HGL, HGL/Smg, HGL/Smg/Ave. H, I) Immunoblot analysis and quantification of proteins associated with the downstream of GLP‐1R activation in the indicated groups. J) mRNA quantification of KLB and CREB in HK‐2 cells post CREB knockdown by small interfering RNA (siCREB, 100 nM). K) mRNA quantification of KLB in HK‐2 cells post‐treatment by HGL, HGL/Smg, and HGL/Smg/Ave. L, M) Immunoblot analysis and quantification of KLB and proteins associated with the AMPK pathway in HGL, HGL/Smg, and HGL/Smg/Si‐KLB groups. N) Immunoblot analysis of KLB and proteins associated with the AMPK pathway in NG, HGL, HGL/Smg, HGL/Smg/Ave and HGL/Smg/Ave/OE‐KLB groups. HK‐2 cells were cultured in NG: 5.5 mM glucose; HGL: 35 mM glucose and 120 µM palmitic acid/PA; HGL/Smg: HGL plus 400 nM Smg; HGL/Smg/Ave: HGL plus Smg and 300 nM Avexitide/Ave; Si‐KLB: 100 nM si‐RNA of KLB; OE‐KLB: 1.0 µg mL−1 plasmid DNA of KLB. All of these assays were performed after the HK‐2 cells culturing for 48 hours under different conditions. KLB, β‐Klotho; cAMP: cyclic adenosine monophosphate; Ave: Avexitide, a glucagon‐like peptide‐1 (GLP‐1) receptor inhibitor; PKA: Protein kinase A; CREB: cAMP‐response element binding protein; LKB1, liver kinase beta 1; AMPK, AMP‐activated protein kinase; ACC, acetyl‐CoA carboxylase; SIRT1, sirtuin 1; NRF2, nuclear factor erythroid 2‐related factor 2. Data are presented as mean ± standard error (n ≥ 3). Statistical comparison was performed using unpaired two‐tailed Student's t‐test (J) or one‐way ANOVA coupled with a Tukey post‐hoc analysis, *p < 0.05, **p < 0.01, ***p < 0.001.
Figure 7
Figure 7
KLB silence counteracts Smg‐induced ferroptosis inhibition in HGL‐treated HK‐2 cells. A, B) Immunoblot analysis and quantification of proteins associated with ferroptosis in HK‐2 cells treated by HGL, HGL/Smg, HGL/Smg/Si‐KLB. C) Quantification of intracellular Fe2+ in HK‐2 cells treated by Si‐control or Si‐KLB under the HGL/Smg condition. D, E) Confocal imaging of cytosolic and mitochondrial ferrous iron (Fe2+) by fluorescent FerroOrrange and FerroGreen probe, respectively. F) Quantification of intracellular GSH. G) Confocal imaging of intracellular ROS. H–K) Quantification of intracellular arachidonic acid, adrenic acid, MDA, and 4‐HNE. L) Confocal imaging of lipid peroxides. M, N) Immunoblot analysis and quantification of proteins associated with ferroptosis in HK‐2 cells treated by NG, HGL, or HGL/Smg, HGL/Smg/Ave, HGL/Smg/Ave/OE‐KLB. HK‐2 cells were cultured in NG: 5.5 mM glucose; HGL: 35 mM glucose and 120 µM palmitic acid/PA; HGL/Smg: HGL plus 400 nM Smg; HGL/Smg/Ave: HGL plus Smg and 300 nM Avexitide/Ave; Si‐KLB: 100 nM si‐RNA of KLB; OE‐KLB: 1.0 µg mL−1 plasmid DNA of KLB. All of these assays were performed after the HK‐2 cells culturing for 48 h under different conditions. GSH: glutathione; ROS: reactive oxygen species; MDA: malondialdehyde; 4‐HNE: 4‐hydroxynonenal; SLC7A11, solute carrier family 7 member 11; GPX4, glutathione peroxidase 4; FSP1, ferroptosis suppressor protein 1; FTH1, ferritin heavy chain; TFR1, transferrin receptor 1; FPN1, ferroportin. Data are presented as mean ± standard error (n ≥ 3). Statistical comparison was performed using the unpaired, two‐tailed Student's t‐test (C, F, H–K) or one‐way ANOVA with a Tukey post‐hoc analysis (B, N), *p < 0.05, **p < 0.01, ***p < 0.001.

References

    1. Sun H., Saeedi P., Karuranga S., Pinkepank M., Ogurtsova K., Duncan B. B., Stein C., Basit A., Chan J. C. N., Mbanya J. C., Pavkov M. E., Ramachandaran A., Wild S. H., James S., Herman W. H., Zhang P., Bommer C., Kuo S., Boyko E. J., Magliano D. J., Diabetes Res. Clin. Pract. 2022, 183, 109119. - PMC - PubMed
    1. Selby N. M., Taal M. W., Diabetes Obes. Metab. 2020, 22, 3.
    1. Thomas M. C., Cooper M. E., Zimmet P., Nat. Rev. Nephrol. 2016, 12, 73. - PubMed
    1. Gribble F. M., Reimann F., Nat. Metab. 2021, 3, 142. - PubMed
    1. Michos E. D., Bakris G. L., Rodbard H. W., Tuttle K. R., Am. J. Prev. Cardiol. 2023, 14, 100502. - PMC - PubMed

Substances

LinkOut - more resources