. 2025 Feb;12(5):e2309709.
doi: 10.1002/advs.202309709. Epub 2024 Dec 4.

Profiling Pro-Inflammatory Proteases as Biomolecular Signatures of Material-Induced Subcutaneous Host Response in Immuno-Competent Mice

Affiliations

Profiling Pro-Inflammatory Proteases as Biomolecular Signatures of Material-Induced Subcutaneous Host Response in Immuno-Competent Mice

Nam M P Tran et al. Adv Sci (Weinh). 2025 Feb.

Abstract

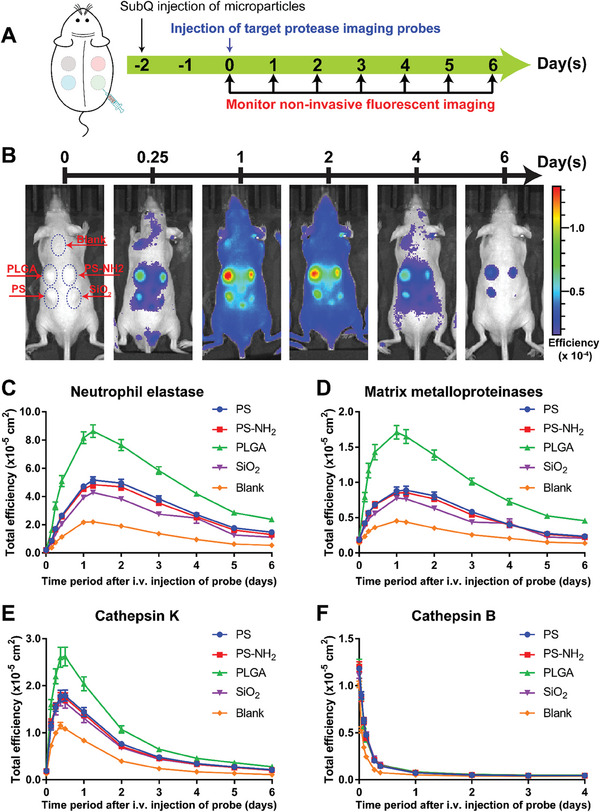
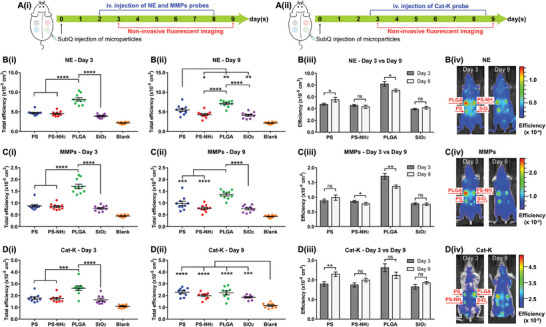
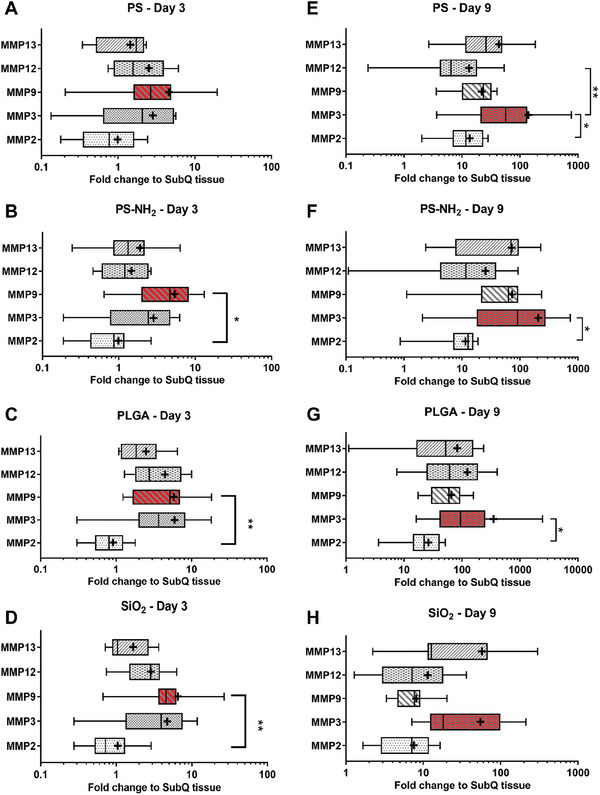
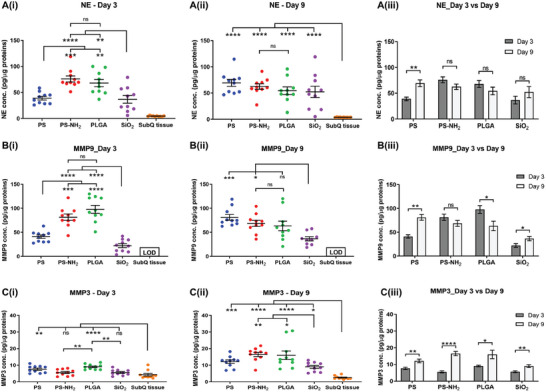
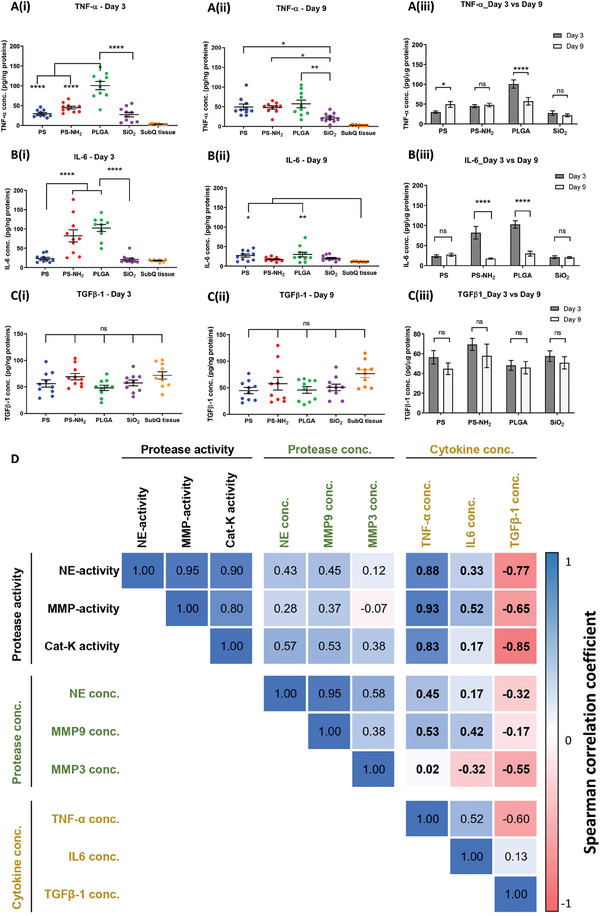
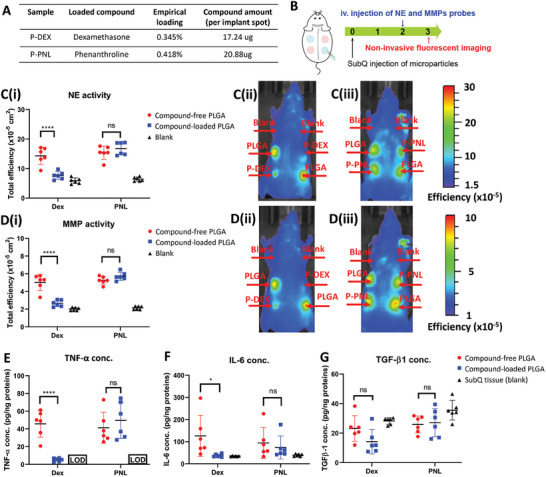
Proteases are important modulators of inflammation, but they remain understudied in material-induced immune response, which is critical to clinical success of biomedical implants. Herein, molecular expression and proteolytic activity of three distinct proteases, namely neutrophil elastase, matrix metalloproteinases, cysteine cathepsins (cathepsin-K and cathepsin-B) are comprehensively profiled, in the subcutaneous host response of immuno-competent mice against different biomaterial implants. Quantitative non-invasive monitoring with activatable fluorescent probes reveals that different microparticulate materials induce distinct levels of protease activity with degradable poly(lactic-co-glycolic) acid inducing the strongest signal compared to nondegradable materials such as polystyrene and silica oxide. Furthermore, protein expression of selected proteases, attributable to both their inactive and active forms, notably deviates from their activities associated only with their active forms. Protease activity exhibits positive correlations with protein expression of pro-inflammatory cytokines tumor necrosis factor α and interleukin 6 but negative correlation with pro-fibrotic cytokine transforming growth factor β1. This study also demonstrates the predictive utility of protease activity as a non-invasive, pro-inflammatory parameter for evaluation of the anti-inflammatory effects of model bioactive compounds on material-induced host response. Overall, the findings provide new insights into protease presence in material-induced immune responses, facilitating future biomaterial assessment to evoke appropriate host responses for implant applications.

Keywords: biomaterial; host immune response; inflammation; protease; subcutaneous implant.


Conflict of interest statement

The authors declare no conflict of interest.

Figures

Figure 1
Figure 1
Distribution and clearance kinetics of protease‐activatable fluorescent probes in subcutaneous material‐induced host response of hairless immunocompetent SKH1‐E mice. A) Schematic of experimental design. B) Representative images of fluorescent signal on mice after intravenous injection of fluorescent probe to monitor activity of neutrophil elastase; distribution and clearance kinetics of fluorescent probe for C) Neutrophil elastase, D) MMPs, E) cathepsin K and F) cathepsin B. NE and MMPs probes were simultaneously injected via tail veins into each mouse of one group with SKH1‐E mice (N = 10). Cat‐K and Cat‐B probes were similarly administered in another group of mice (N = 9). Data represents mean ± S.E.M. of N = 10 (NE and MMPs) and N = 9 (Cat‐K and Cat‐B).
Figure 2
Figure 2
Temporal dynamics of protease activity during the early stage of material‐induced host response. Schematic of experimental design for A(i)) MMPs and NE probes and A(ii)) Cat‐K probe. Fluorescent signal quantified from imaging probes of B) NE, C) MMPs, and D) Cat‐K; fluorescent signal at day 3 of B(i)) NE, C(i)) MMPs, D(i)) Cat‐K, and at day 9 of B(ii)) NE, C(ii)) MMPs, D(ii)) Cat‐K; comparison B(iii), C(iii),D(iii)) of fluorescent signals and representative images B(iv),C(iv),D(iv)) on day 3 versus day 9. Data represents mean ± S.E.M. of N = 10 (NE and MMPs) and N = 9 (Cat‐K). p‐values of B3, C3, D3 were determined by paired 2 tailed t‐test. p‐values of B(i), C(i), D(i), B(ii), C(ii), D(ii) were determined by one‐way ANOVA with Tukey's multiple comparison test. (*), (**), (***), (****), and ns denote p < 0.05, p < 0.01, p < 0.001, p < 0.0001, and non‐significant, respectively.
Figure 3
Figure 3
Fold change of mRNA expression for individual MMP proteases in SKH1‐E mice during material‐induced host response to A,E) PS, B,F) PS‐NH2, C,G) PLGA, and D,H) SiO2 on (A–D) day 3 or (E–H) day 9 following material injection. MMP9 and MMP3 mRNA expression were more sensitive to material‐induced upregulation on day 3 and 9, respectively. Boxes represent medians ± IQR (interquartile range). Whiskers represent the minimum and maximum observations. “+” sign represents mean of data. p‐values were determined by the non‐parametric test (Kruskal–Wallis test) followed by multiple comparison Dunn's test. * p < 0.05, ** p < 0.01, *** p < 0.001. N = 9 injection repeat for PS‐Day 3 and SiO2‐Day 9 and N = 10 for other material at each time point.
Figure 4
Figure 4
Protease protein expression from retrieved subQ tissues containing injected materials. Normalized protein concentration of targeted proteases A(i–iii)) neutrophil elastase, B(i–iii)) MMP9, C(i–iii)) MMP3 in 1 µg total protein of each retrieved subQ tissue containing microparticles. Data represents mean ± S.E.M. of N = 10. p‐values of A(i, ii),B(i, ii),C(i, ii) were determined by one‐way ANOVA with Tukey's multiple comparison test. p‐values of A3, B3, C3 were determined by non‐paired 2 tailed t‐test. MMP9 protein concentration of subQ tissue on day 9 was lower than limit of detection (LOD). (*), (**), (***), and (****) denote p < 0.05, p < 0.01, p < 0.001, and p < 0.0001, respectively.
Figure 5
Figure 5
Correlation analysis of protease activity and protease protein concentration with protein expression of inflammation‐associated cytokines from microparticle‐containing subQ tissues. Normalized protein concentration of pro‐inflammatory cytokines A(i–iii)) TNF‐α, B(i–iii)) IL‐6 and pro‐fibrotic cytokine C(i–iii)) TGF‐β1 in microparticle‐containing subQ tissues retrieved on days 3 and 9. Data represents mean ± S.E.M. of N = 10. p‐values of A(i, ii),B(i, ii),C(i, ii) were determined by one‐way ANOVA with Tukey's multiple comparison test. p‐values of A3, B3, C3 were determined by non‐paired 2 tailed t‐test. (*), (**), (***), and (****) denote p < 0.05, p < 0.01, p < 0.001, and p < 0.0001, respectively. D) Spearman correlation coefficient matrix of 9 variables including protease activity (NE‐activity, MMP‐activity, CatK‐activity), protease protein expression (NE conc., MMP9 conc., MMP3 conc.) and cytokine protein expression (TNF‐α conc., IL‐6 conc., TGF‐β1 conc.). The number within each cell of the matrix indicates the Spearman correlation coefficient between each pair of variables out of 9 variables analyzed for 10 sets of samples. Color intensity of each cell denotes the magnitude of the corresponding correlation efficient with positive correlations shown in blue tone and negative correlations shown in red tone.
Figure 6
Figure 6
Effect of bioactive compounds loaded in PLGA microparticles on protease activity and protein expression of inflammation‐associated biomarkers in subcutaneous material‐induced host response. A) Drug loading characteristics of PLGA microparticles encapsulating dexamethasone or phenanthroline. B) Schematic of experimental design to evaluate effects of microparticles loaded with each candidate compound by fluorescent imaging. C) Fluorescent signal of NE probe (C(i)) and representative fluorescent images of NE probe signal from mice injected with P‐DEX (C(ii)) and P‐PNL (C(iii)) on day 3. D) Fluorescent signal of MMP probe D(i)) and representative fluorescent images of MMP probe signal from mice injected with P‐DEX D(ii)) and P‐PNL D(iii)) on day 3. E–G) Protein concentration of pro‐inflammatory cytokines (E) TNF‐α, (F) IL‐6, and pro‐fibrotic cytokine (G) TGFβ−1 in retrieved subQ tissue containing blank PLGA microparticles and compound‐loaded PLGA microparticles. TNF‐α protein concentration of control subQ tissue in (E) was lower than limit of detection (LOD). Data represents mean ± S.E.M. of N = 6. p‐values of C(i),D(i),E–G) were determined by two‐way ANOVA with Tukey's multiple comparison test. ns, (*), (**), (***), and (****) denote non significance, p < 0.05, p < 0.01, p < 0.001, and p < 0.0001, respectively.

Similar articles

References

    1. Zhang D., Chen Q., Shi C., Chen M., Ma K., Wan J., Liu R., Adv. Funct. Mater. 2021, 31, 2007226.
    1. Veiseh O., Vegas A. J., Adv. Drug Deliv. Rev. 2019, 144, 148. - PMC - PubMed
    1. Anderson J., Cramer S., in Host Response to Biomaterials, (Ed: Badylak S. F.), Academic Press, Oxford: 2015, pp. 13–36.
    1. MacLauchlan S., Skokos E. A., Meznarich N., Zhu D. H., Raoof S., Shipley J. M., Senior R. M., Bornstein P., Kyriakides T. R., J. Leucocyte Biol. 2009, 85, 617. - PMC - PubMed
    1. Jones J. A., McNally A. K., Chang D. T., Qin L. A., Meyerson H., Colton E., I. L. K. Kwon, T. Matsuda, J. M. Anderson, Japan. Soc. Biomater. Austral. Soc. Biomater. Korean Soc. Biomater. 2008, 84, 158.

LinkOut - more resources