. 2024 Dec 4;15(1):744.
doi: 10.1007/s12672-024-01630-9.

Development and validation of a prognostic risk score model for hepatocellular carcinoma in the Asian population based on immunogenic cell death-related genes

Affiliations

Development and validation of a prognostic risk score model for hepatocellular carcinoma in the Asian population based on immunogenic cell death-related genes

Zhengyang Feng et al. Discov Oncol. .

Abstract

Background: Hepatocellular carcinoma (HCC), the predominant form of liver cancer, is marked by limited therapeutic success and unfavorable prognoses. Its etiology varies regionally, with hepatitis B virus (HBV) being the predominant cause in most of Asia. Immunogenic cell death (ICD), a specific type of cell death, has been extensively linked to HCC treatment in numerous studies. This research aims to explore the significance of ICD-related genes in the Asian HCC cohort, potentially offering novel approaches for HCC management.

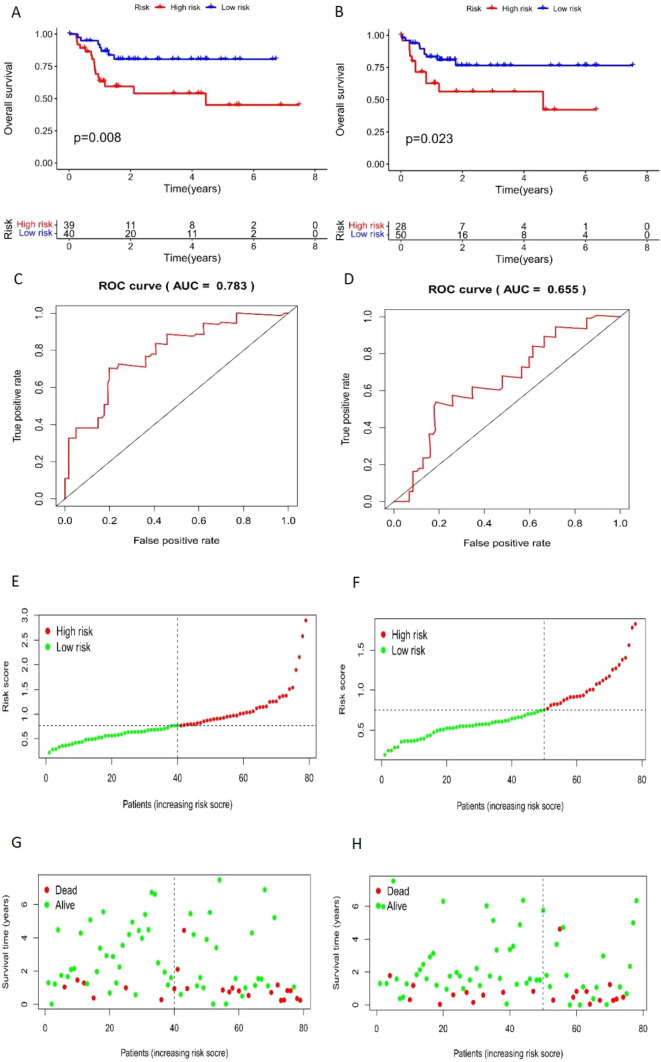
Methods: We initially obtained transcriptomic and clinical data pertinent to Asian HCC from the TCGA database. Subsequently, we classified the samples into distinct subgroups according to ICD gene expression levels and conducted analyses of the tumor microenvironment and enrichment. Furthermore, we randomly allocated the samples into training and testing cohorts, thereafter developing and validating an ICD gene-based prognostic model tailored for the Asian HCC population.

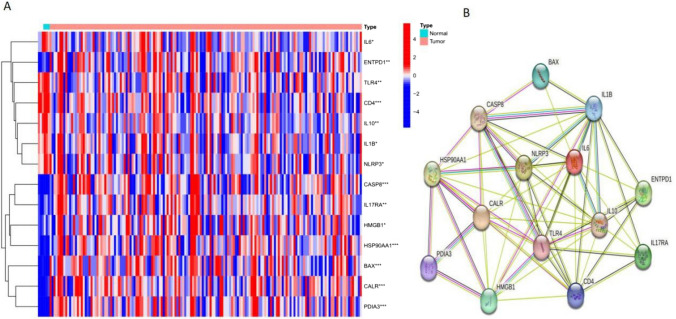
Results: The Asian HCC samples were categorized into two subgroups: high and low ICD expression. In the low ICD expression group, we observed diminished infiltration of immune and stromal cells, increased tumor purity, and improved prognosis. Moreover, we devised a 5-gene risk-score prognostic model comprising BAX, CASP8, HMGB1, HSP90AA1, and IL6, demonstrating efficacy in prognostic predictions for the Asian HCC cohort.

Conclusion: Our investigation unveils new perspectives on the influence of ICDs within Asian HCC populations. The derived 5-gene risk-score prognostic model, based on ICDs, not only serves as a tool for assessing prognosis in Asian HCC cases but also suggests potential therapeutic targets for HCC treatment.

Keywords: Asian population; Hepatocellular carcinoma; Immunogenic cell death; Prognostic model; Tumor microenvironment.


Conflict of interest statement

Declarations. Ethics approval and consent to participate: Not applicable. Consent for publication: Not applicable. Competing interests: The authors declare no competing interests.

Figures

Fig. 1
Fig. 1
Workflow of this study
Fig. 2
Fig. 2
Differential expression of 14 ICD-related genes. A Heat map illustrating the expression levels of 14 ICD-related genes. The horizontal axis represents sample names (blue for normal samples, red for tumor samples), and the vertical axis lists the names of differential ICD related genes. Genes marked with an asterisk indicate significant differences between normal and tumor samples. Significance levels are denoted as follows: ***p-value < 0.001, **p-value < 0.01, *p-value < 0.05. Blue signifies low expression, white indicates intermediate expression, and red denotes high expression. B PPI network among the 14 differential ICD-related genes
Fig. 3
Fig. 3
Subgroup classification of Asian HCC samples based on ICD-related genes. A Heat map showing the consensus clustering result (k = 2) for 34 ICD-related genes in 161 Asian HCC samples. B Heat map displaying the expression of 34 ICD-related genes in C1 and C2 subtypes. The horizontal axis represents sample names, with the front green section indicating C1 subtype samples and the rear red section representing C2 subtype samples. The vertical axis displays the expression levels of ICD-related genes. Color coding for expression levels is as follows: blue for low expression, white for intermediate expression, and red for high expression
Fig. 4
Fig. 4
Kaplan–Meier (K–M) survival curves for ICD high and low expression groups. This figure presents the survival curves, with the horizontal axis indicating survival time in years and the vertical axis showing the survival rate, which diminishes over time. The blue curve represents the low ICD expression group, while the red curve denotes the high ICD expression group
Fig. 5
Fig. 5
Enrichment analysis of differential genes between ICD high and low expression groups. A Heat map illustrating the differential gene expression in ICD high and low expression groups. B Bubble chart of GO enrichment analysis for differential genes. The horizontal axis shows the gene ratio, and the vertical axis lists the GO categories: Biological Process (BP), Cell Component (CC), and Molecular Function (MF). The circle size indicates the number of genes; larger circles represent greater gene enrichment in GO, and a redder hue indicates higher enrichment levels. C Bubble chart of KEGG enrichment analysis for differential genes. The horizontal axis displays the gene ratio, and the vertical axis shows KEGG pathways. As with GO, circle size denotes the number of genes, and a redder color signifies higher enrichment. D GSEA enrichment results for the ICD high expression group. E GSEA results for the ICD low expression group. The horizontal axis represents the sequenced genes, and the vertical axis shows the enrichment score. Different color curves represent distinct pathways
Fig. 6
Fig. 6
Waterfall plot of gene mutations in ICD high and low expression groups. This plot displays gene mutations, with the horizontal axis representing samples and the vertical axis denoting genes. Different colors indicate various mutation types, allowing observation of each gene’s mutation frequency
Fig. 7
Fig. 7
Violin plot of tumor microenvironment in high and low ICD expression groups. A The stromal cell score; B the immune cell score; C the composite score; D tumor purity. The color blue represents the low ICD expression group, while red signifies the high ICD expression group. The vertical axis displays the tumor microenvironment score. ***Represents p < 0.001
Fig. 8
Fig. 8
Differential analysis of immune cells, HLA genes, and immune checkpoint-associated genes in ICD high and low expression groups. A Violin plot illustrating the content of immune cells in both ICD high and low expression groups. The horizontal axis labels the immune cell types, while the vertical axis quantifies their content. Blue denotes the ICD low expression group, and red indicates the ICD high expression group. An asterisk (*) signifies a difference in immune cell content between the high and low expression groups. B Box plot depicting HLA gene expression across the two groups. The horizontal axis shows HLA-related genes, and the vertical axis represents gene expression levels. Blue signifies the ICD low expression group, red the ICD high expression group. Significance levels are indicated: ***p value < 0.001, **p value < 0.01, *p value < 0.05. C Box plot of immune checkpoint-associated genes expression in the ICD high and low expression groups. The horizontal axis categorizes the sample groups, and the vertical axis measures gene expression. A p-value < 0.05 indicates significant differences
Fig. 9
Fig. 9
Lasso–Cox analysis results in the training group. This figure displays the point of minimum cross-validation error, marked by a dotted line. The number of genes at this point corresponds to the number used in model construction
Fig. 10
Fig. 10
Validation of the prognostic model. A K–M survival curves for the training group. B K–M survival curves for the testing group. The red curve represents the high-risk group, while the blue curve denotes the low-risk group. In both training and testing groups, the low-risk group exhibited significantly higher survival rates and longer survival times than the high-risk group (p < 0.05), indicating statistical significance. C ROC curve for the training group. D ROC curve for the testing group. The horizontal axis represents the false-positive rate, and the vertical axis the true-positive rate. The area under the curve reflects the model’s accuracy. E Risk plot for the training group. F Risk plot for the testing group. Risk scores increase from left to right, with the median value indicated by a dotted line. The left green line represents low-risk patients, and the right red line indicates high-risk patients. G Survival time and status graph for the training group. H Survival time and status graph for the testing group. Red dots signify deceased patients, and green dots indicate living patients. As risk scores rise, survival time decreases and mortality rates incrementally increase
Fig. 11
Fig. 11
Independent prognostic analysis. A Univariate cox independent prognostic analysis. B Multivariate cox independent prognostic analysis
Fig. 12
Fig. 12
Immune cell correlation
Fig. 13
Fig. 13
Clinical correlation. A age; B grade; C stage

References

    1. McGlynn KA, Petrick JL, El-Serag HB. Epidemiology of hepatocellular carcinoma. Hepatology. 2021;73(Suppl 1):4–13. - PMC - PubMed
    1. Rahib L, Smith BD, Aizenberg R, Rosenzweig AB, Fleshman JM, Matrisian LM. Projecting cancer incidence and deaths to 2030: the unexpected burden of thyroid, liver, and pancreas cancers in the United States. Cancer Res. 2014;74(11):2913–21. - PubMed
    1. Llovet JM, Kelley RK, Villanueva A, Singal AG, Pikarsky E, Roayaie S, Lencioni R, Koike K, Zucman-Rossi J, Finn RS. Hepatocellular carcinoma. Nat Rev Dis Prim. 2021;7(1):6. - PubMed
    1. Huang DQ, Mathurin P, Cortez-Pinto H, Loomba R. Global epidemiology of alcohol-associated cirrhosis and HCC: trends, projections and risk factors. Nat Rev Gastroenterol Hepatol. 2023;20(1):37–49. - PMC - PubMed
    1. Sia D, Jiao Y, Martinez-Quetglas I, Kuchuk O, Villacorta-Martin C, Castro de Moura M, Putra J, Camprecios G, Bassaganyas L, Akers N, Losic B, Waxman S, Thung SN, Mazzaferro V, Esteller M, Friedman SL, Schwartz M, Villanueva A, Llovet JM. Identification of an immune-specific class of hepatocellular carcinoma, based on molecular features. Gastroenterology. 2017;153(3):812–26. - PubMed

LinkOut - more resources