. 2024 Dec 4;135(2):e171164.
doi: 10.1172/JCI171164.

YAP1 induces bladder cancer progression and promotes immune evasion through IL-6/STAT3 pathway and CXCL deregulation

Affiliations

YAP1 induces bladder cancer progression and promotes immune evasion through IL-6/STAT3 pathway and CXCL deregulation

Pritam Sadhukhan et al. J Clin Invest. .

Abstract

The Hippo signaling pathway plays a key role in tumorigenesis in different cancer types. We investigated the role of the Hippo effector YAP1 in the tumor immune microenvironment (TIME) of urothelial carcinoma of the bladder (UCB) and evaluated the efficacy of immunotherapy in the context of YAP1 signaling. We performed numerous in vitro and in vivo experiments to determine the role of YAP1 using genetic and pharmacological attenuation of YAP1 activity. Briefly, RNA sequencing was carried out with mouse and human cell lines to identify novel YAP1-regulated downstream targets unbiasedly. We then experimentally confirmed that YAP1 regulates the TIME through the IL-6/STAT3 signaling pathway and varied C-X-C motif chemokine regulation. We analyzed several human sample sets to explore the TIME status in the context of YAP1 expression. Our data indicate that YAP1 attenuation decreases M2 macrophages and myeloid-derived suppressor cells in the TIME compared with YAP1-expressing cells. In summary, this study provides insights into YAP1 signaling as a driver for cancer stemness and an inducer of immunosuppressive TIME. Moreover, the therapeutic efficacy of YAP1 attenuation indicates that combined blockade of YAP1 and immune checkpoints may yield clinical value for treating patients with UCB.

Keywords: Cancer immunotherapy; Oncogenes; Oncology; Therapeutics; Tumor suppressors.


Conflict of interest statement

Conflict of interest: The authors have declared that no conflict of interest exists.

Figures

Figure 1
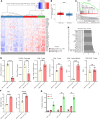
Figure 1. YAP1 is a potential candidate driver of UCB progression and cancer cell malignant stemness.
(A and B) The overall survival (A) and disease-free survival (B) of patients with a high (top 25%) and a low level (bottom 25%) of YAP1 expression in the TCGA-BLCA database. TPM, transcripts per million. (C) Cell proliferation rate in different YAP1 clones. Sh-ct, Sh-control; Sh-74 and Sh-77, YAP1-KD clones. (D) Representative images of sphere formation assay of different YAP1-KD and Sh-control of MB49 cells. (E) RT-qPCR analysis of candidate cancer stem cell (CSC) markers in YAP1-KD and YAP1 Sh-control MB49 cells. (F) Immunoblots showing the YAP1 expression in different mouse parental bladder cancer cell lines and after treatment with 1 μM verteporfin (VP), a potent and specific YAP1 inhibitor. (G) RT-qPCR analysis of several YAP1 downstream targets in YAP1-Sh MB49 cells (left) and VP-treated mouse UCB cell lines (right). (H) Cell proliferation rate is shown in MB49 cells treated with different concentrations of VP. (I) Sphere formation assay of VP-treated (1 μM) mouse bladder cancer cell lines. (J) RT-qPCR analysis of the candidate CSC markers using the samples from VP-treated (1 μM) mouse bladder cancer cell lines. (K) Representative images of wound healing assay of pharmacological (left) and genetic (right) inhibition of YAP1 in UPPL1595 cells compared with controls. Data are presented as means ± SD of at least 3 independent experiments. *P < 0.05, **P < 0.01, ***P < 0.001, ****P < 0.0001 by unpaired t test.
Figure 2
Figure 2. YAP1 drives bladder cancer progression in vivo.
(A) Tumor growth curve (left) and weight of tumor mass (right) of cell-derived xenograft (CDX) of MB49 YAP1 clones in C57BL/6 mice. (B) Tumor growth curve (left) and weight of tumor mass (right) of CDX using MB49 YAP1 clones in immunocompromised NSG mice. (CE) Tumor growth curve (top) and tumor mass (bottom) of CDX of MB49, UPPL1595, and BBN975 cells treated with DMSO (control) and YAP1 inhibitor (VP) using C57BL/6 mice. VP was administered 3 times a week, 50 mg/kg body weight. (F) Immunoblots showing YAP1 expression level in CDX tissues treated with VP for 25 days (pharmacodynamics of VP). (G) RT-qPCR analysis of two YAP1 downstream targets of VP-treated and DMSO-treated mouse xenografted tissues. Data are presented as means ± SD of at least 3 independent experiments. *P < 0.05, **P < 0.01, ***P < 0.001, ****P < 0.0001 by unpaired t test.
Figure 3
Figure 3. YAP1 might be critical in enabling tumor immune evasion in UCB.
(A) Fast Gene Set Enrichment Analysis (FGSEA) showed the top 10 downregulated pathways in MB49 YAP1 Sh-Y74 (YAP1-KD) cells compared with MB49 YAP1 Sh-control (Sh-ct; YAP1-expressing) cells. (B) FGSEA showed the top 10 upregulated pathways in MB49 YAP1 Sh-Y74 (YAP1-KD) cells compared with MB49 YAP1 Sh-ct (YAP1-expressing) cells. (C) Heatmap showing the expression of different key regulatory genes from the interleukin signaling pathway significantly different in MB49 YAP1 Sh-ct cells compared with MB49 YAP1 Sh-Y74 cells. (D) RT-qPCR analysis of the candidate immunoregulatory genes in MB49 YAP1-KD and YAP1 Sh-ct clones. (E) RT-qPCR analysis of the key immunogenicity markers (H-2K, CD80, and H2-Ab) in YAP1-KD and YAP1 Sh-ct clones. (F) RT-qPCR analysis of the key immunogenicity markers (H-2K, CD80, and H2-Ab) in VP-treated mouse UCB cell lines. Data are presented as means ± SD of at least 3 independent experiments. *P < 0.05 by unpaired t test.
Figure 4
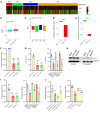
Figure 4. YAP1 potentially induces an immunosuppressive tumor microenvironment.
(A) Heatmap of human TCGA bladder samples using 36 MDSC signature genes. Samples were clustered into 3 groups: MDSC-high, MDSC-low, and MDSC-medium. (B) Expression of YAP1 in MDSC-high and MDSC-low groups of tumors analyzed from TCGA bladder samples. (C and D) Gene set enrichment analysis (GSEA) showed enrichment of YAP1 signature genes in MDSC-high bladder TCGA samples. (E) Flow cytometric analysis showing the infiltration of MDSCs, FOXP3+ Tregs, CD8+ T cells, and CD4+ T cells in xenografted tumors. (F) Flow cytometric analysis showing the expression of CD107 and IFN-γ in CDX tissues. n = 5 in each group. (G) Coculture cytotoxicity assay of CD8+ T cells and cancer cells measured by quantification of the released lactate dehydrogenase in the culture media. Data are presented as means ± SD of at least 3 independent experiments. **P < 0.01, ***P < 0.001, ****P < 0.0001 by unpaired t test.
Figure 5
Figure 5. YAP1 potentially modulates the activity of MDSCs and macrophages in the xenograft tumor.
(A) Migration assay using primary macrophages from the peritoneum of WT C57BL/6 mice and conditioned medium (CM) from in vitro–cultured MB49 YAP1-Sh and YAP1-Sh clones. (B) Migration assay using MDSCs from WT MB49 xenografts and CM from in vitro–cultured MB49 YAP1-Sh and YAP1-Sh clones. (C) Representative IHC images showing the presence of macrophages (F4/80+) in xenografts developed from MB49 YAP1 Sh-control (Sh-ct) and YAP1-Sh clones (n = 3). Scale bar: 200 μm. (D) RT-qPCR analysis of macrophage polarization markers in RAW 264.7 cell line cultured with CM from YAP1 Sh-ct and YAP1-Sh clones. (E) Flow cytometric analysis showing the expression of candidate macrophage polarization markers in RAW 264.7 cell line cultured with CM from MB49 YAP1-Sh and Sh-ct clones. (F) ELISA showing the level of 2 cytokines (IL-10 and TNF-α) released from macrophages incubated with the CM of YAP1-Sh clones. (G) Griess assay showing the level of nitric oxide (NO) in the culture medium of macrophages incubated with the CM of YAP1-Sh and Sh-ct clones. (H) RT-qPCR assay showing the expression level of CXCR2-associated ligands in YAP1-KD MB49 cells. (I) FACS analysis showing CXCR2 expression level in the tumor, blood, and spleen of MB49 YAP1-Sh and Sh-ct clones bearing xenografts. Data are presented as means ± SD of at least 3 independent experiments. *P < 0.05, **P < 0.01, ***P < 0.001, ****P < 0.0001 by unpaired t test.
Figure 6
Figure 6. YAP1 activates the IL-6/STAT3 pathway in UCB.
(A) Heatmap showing expression level of IL-6 and YAP1 in a clinical cohort (IMvigor210 database). The patient data were divided into 4 groups: CR, complete response; PR, partial response; SD, stable disease; PD, progressive disease. (B) YAP1 expression was significantly high in immunotherapy-nonresponsive group (SD and PD) compared with responsive group (CR and PR) in IMvigor210 clinical cohort (P < 0.05 by t test). (C) Expression level of IL-6 in different subgroups (CR, PR, SD, and PD) of immunotherapy-treated IMvigor210 clinical cohort (ANOVA, P = 0.23). (D and E) RNA-Seq data showing downregulation of the key regulatory genes of interleukin signaling and IL-6/STAT3 signaling in MB49 YAP1-Sh cells. (F) RT-qPCR analysis of IL-6 expression in MB49 YAP1-Sh and Sh-control (Sh-ct) clones. (G) ELISA for IL-6 expression in MB49 YAP1-Sh and Sh-ct clones (left) and VP-treated mouse UCB cell lines (right). (H) Immunoblot showing the expression of IL-6 in VP-treated mice bearing CDX from WT MB49, UPPL1595, and BBN975 cells. (I) ELISA showing the phospho-STAT3/total STAT3 expression ratio in MB49 YAP1-KD and Sh-ct clones (left) and in VP-treated WT mouse UCB cell lines (right). (J) ELISA showing phospho-STAT3/total STAT3 in YAP1-Sh (BFTC905) and YAP1-overexpressed (lentiviral vector [LV]) (BFTC909) human UCB cell lines (left), and ELISA showing phospho-STAT3/total STAT3 in VP-treated human UCB cells (right). Data are presented as means ± SD of at least 3 independent experiments. *P < 0.05, **P < 0.01, ***P < 0.001 by unpaired t test.
Figure 7
Figure 7. STAT3 inhibition mimics the antitumor activity of YAP1 attenuation.
(A) MB49 WT cell–derived tumors in C57BL/6 mice treated with STAT3 inhibitor (S3I-201), YAP1 inhibitor (VP), and combination of S31-201 and VP. Left: Growth curve. Right: Tumor mass. (B) RT-qPCR analysis showing the expression of different CSC markers in MB49 WT xenografts collected from drug- and vehicle-treated mice. (C) RT-qPCR analysis showing the expression of different CXCR1/CXCR2-associated ligands in the MB49 WT xenografts collected from drug- and vehicle-treated mice. (D) IHC showing the infiltration of MDSCs (Gr-1) and CD8+ T cells in the tumor site of S3I-201–treated and control mouse tumor. Scale bar: 100 μm. Data are presented as means ± SD of at least 3 independent experiments. *P < 0.05, **P < 0.01, ***P < 0.001 by 1-way ANOVA.
Figure 8
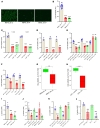
Figure 8. YAP1 influences the accumulation of lipid droplets in cancer cells.
(A) Micrographs (original magnification, ×10) showing the lipid droplets (LDs) in MB49 YAP1-Sh and Sh-control (Sh-ct) clones. Scale bar: 400 μm. (B) Quantification of LD accumulation in MB49 YAP1-Sh clones by fluorescent spectroscopy. (C) Quantification of LD accumulation in MB49 YAP1-Sh clones exposed to exogenous oleic acid. (D) Quantification of LD accumulation in VP-treated WT mouse UCB cell lines. (E) Quantification of LD accumulation in YAP1-Sh (BFTC905 and T24) and YAP1-overexpressed (LV) (BFTC909) human UCB cell lines. (F) Quantification of LD accumulation in WT human UCB cell lines. C, control; T, treated. (G and H) RNA-Seq data from MB49 (G) and UC3 (H) YAP1-KD cells showing downregulation of the glycolytic pathway–regulatory genes. (I) Quantification of l-lactate in MB49 YAP1-Sh clones (Sh-74 and Sh-77) and Sh-ct. (J) Quantification of l-lactate in VP-treated WT mouse UCB cell lines. (K) Quantification of l-lactate in YAP1-Sh (BFTC905 and T24) and YAP1-overexpressed (LV) (BFTC909) human UCB cell lines. (L) Quantification of l-lactate in WT human UCB cell lines. C, control; T, treated. AU, arbitrary units. Data are presented as means ± SD of at least 3 independent experiments. *P < 0.05, **P < 0.01, ***P < 0.001 by unpaired t test.
Figure 9
Figure 9. YAP1 silencing in tumors stimulates host adaptive immunity.
(A) A schematic showing the cell injection scheme in the mice. YAP1-expressing MB49 cells were injected in one flank and MB49 YAP1-Sh clones were injected in the opposite flank. (B) Tumor growth curve of WT MB49 or MB49 YAP1-Sh clones. WT: mice were injected with WT cells in both flanks; YAP1 Sh-74: mice were injected with MB49 YAP1 Sh-Y74 cells in both flanks; YAP1 Sh-77: mice were injected with MB49 YAP1 Sh-Y77 cells in both flanks; WT-YAP1 Sh-74: mice were injected with WT cells in the left flank and MB49 YAP1 Sh-Y74 cells in the right flank; WT-YAP1 Sh-77: mice were injected with WT cells in the left flank and MB49 YAP1 Sh-Y77 cells in the right flank. (C) Tumor mass. Data are presented as means ± SD of at least 3 independent experiments. **P < 0.01, ***P < 0.001 by 1-way ANOVA.
Figure 10
Figure 10. YAP1 inhibition shows synergistic antitumor efficacy in combination with anti–PD-L1.
(A) Tumor growth curve of genetically YAP1-attenuated MB49 cells (YAP1 Sh) treated with anti–PD-L1. T, treated group. (B) WT MB49 cells were subcutaneously injected into C57BL/6 mice and treated with VP, anti–PD-L1, and combination of VP and anti–PD-L1. Tumor growth was monitored at the indicated times. (C) IHC showing the expression of MDSCs (Gr-1) in xenograft tissues obtained from VP-, anti–PD-L1–, or VP + anti–PD-L1–treated MB49 WT tumors after the completion of treatment (25 days). Scale bar: 100 μm. (D) IHC showing CD8+ cells in xenograft tissues obtained from VP-, anti–PD-L1–, or VP + anti–PD-L1–treated MB49 tumors after the completion of treatment (25 days). Scale bar: 100 μm. (E) RT-qPCR analysis of selected CSC markers using RNA from xenograft tumors treated with indicated drugs after the completion of treatment (25 days). (F) RT-qPCR analysis of different tumor-promoting CXCLs using the same RNA as in E. (G) RT-qPCR analysis of selected immunogenicity markers after the completion of treatment (25 days). (H) RT-qPCR analysis of various key immune-regulatory molecules after the completion of treatment. Data are presented as means ± SD of at least 3 independent experiments. *P < 0.05, **P < 0.01, ***P < 0.001, ****P < 0.0001 by 1-way ANOVA.
Figure 11
Figure 11. A schematic representation showing a possible mechanism of YAP1-driven induction of immunosuppression in UCB mediated by the IL-6/STAT3 pathway.

References

    1. Hayashi M, et al. GULP1 regulates the NRF2-KEAP1 signaling axis in urothelial carcinoma. Sci Signal. 2020;13(645):eaba0443. doi: 10.1126/scisignal.aba0443. - DOI - PubMed
    1. Shimwell NJ, et al. Combined proteome and transcriptome analyses for the discovery of urinary biomarkers for urothelial carcinoma. Br J Cancer. 2013;108(9):1854–1861. doi: 10.1038/bjc.2013.157. - DOI - PMC - PubMed
    1. Malladi S, et al. Metastatic latency and immune evasion through autocrine inhibition of WNT. Cell. 2016;165(1):45–60. doi: 10.1016/j.cell.2016.02.025. - DOI - PMC - PubMed
    1. Miao Y, et al. Adaptive immune resistance emerges from tumor-initiating stem cells. Cell. 2019;177(5):1172–1186. doi: 10.1016/j.cell.2019.03.025. - DOI - PMC - PubMed
    1. Su R, et al. Targeting FTO suppresses cancer stem cell maintenance and immune evasion. Cancer Cell. 2020;38(1):79–96. doi: 10.1016/j.ccell.2020.04.017. - DOI - PMC - PubMed

MeSH terms