. 2024 Dec 6;10(49):eadk9944.
doi: 10.1126/sciadv.adk9944. Epub 2024 Dec 4.

A trafficking regulatory subnetwork governs αVβ6 integrin-HER2 cross-talk to control breast cancer invasion and drug resistance

Affiliations

A trafficking regulatory subnetwork governs αVβ6 integrin-HER2 cross-talk to control breast cancer invasion and drug resistance

Horacio Maldonado et al. Sci Adv. .

Abstract

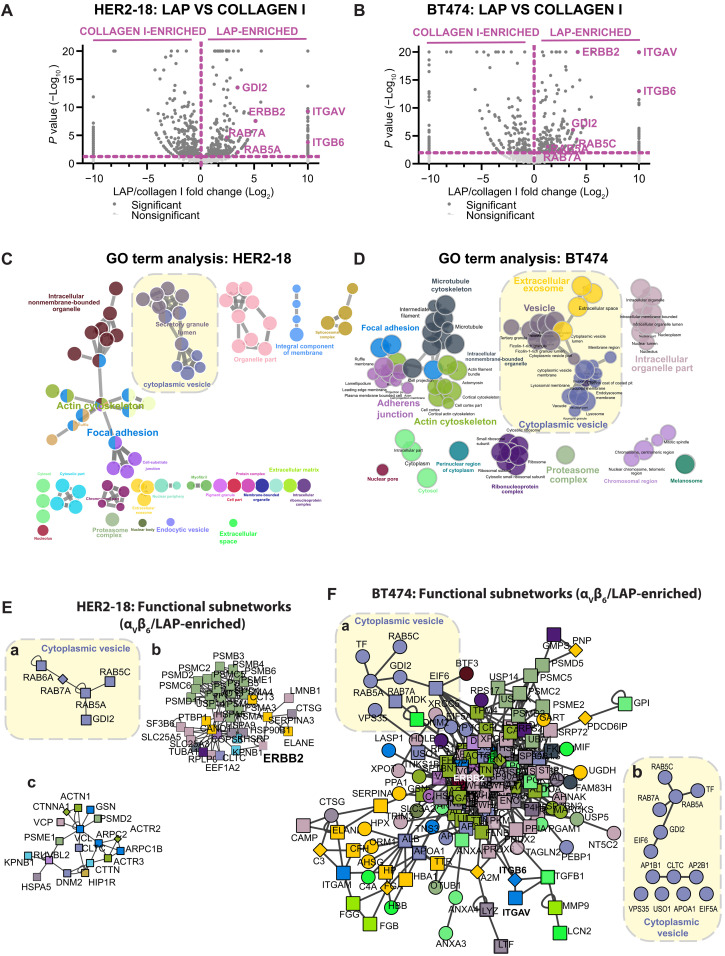
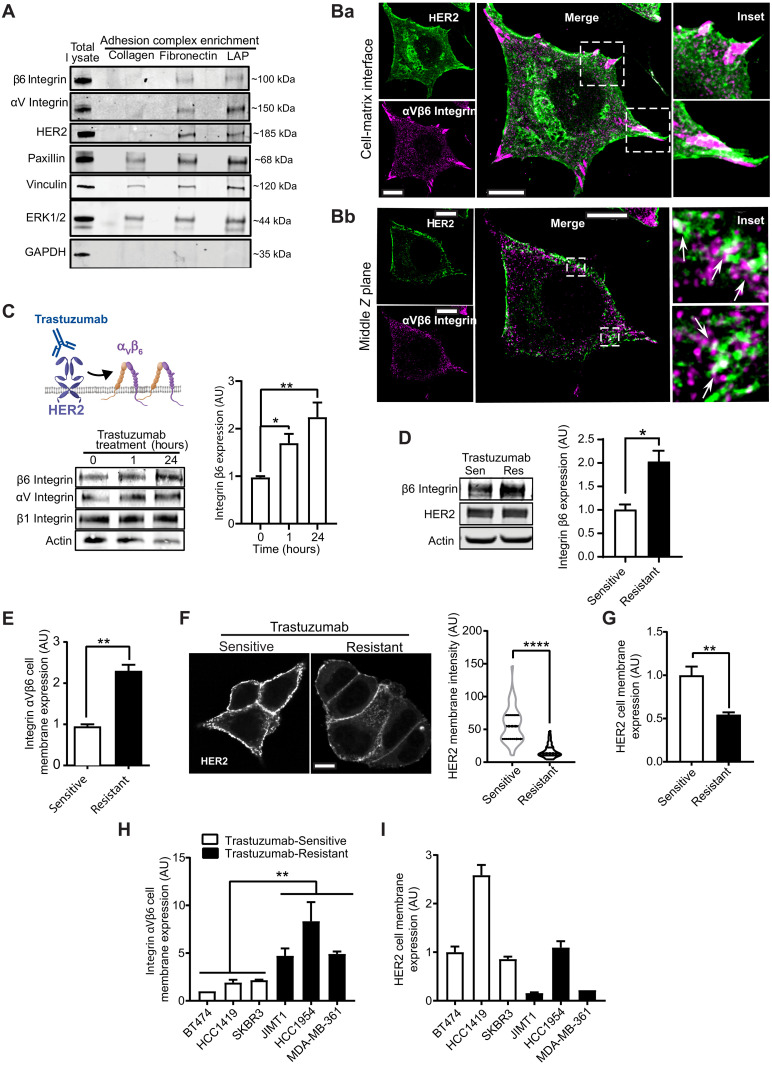
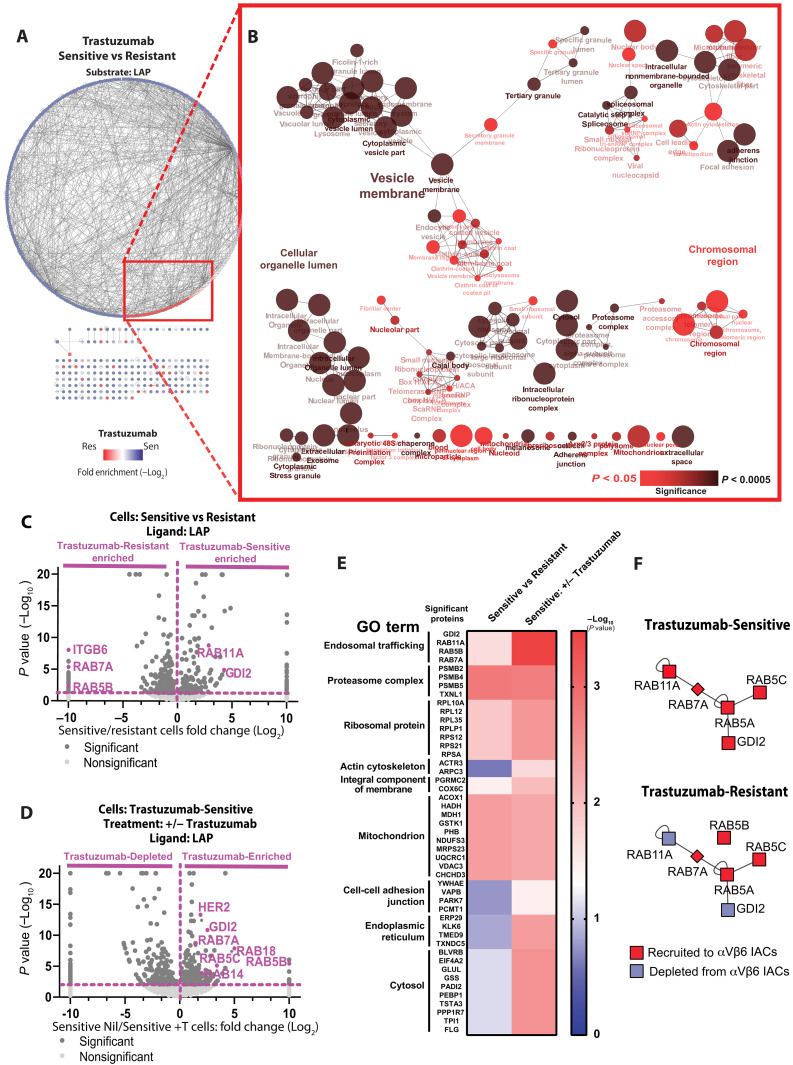
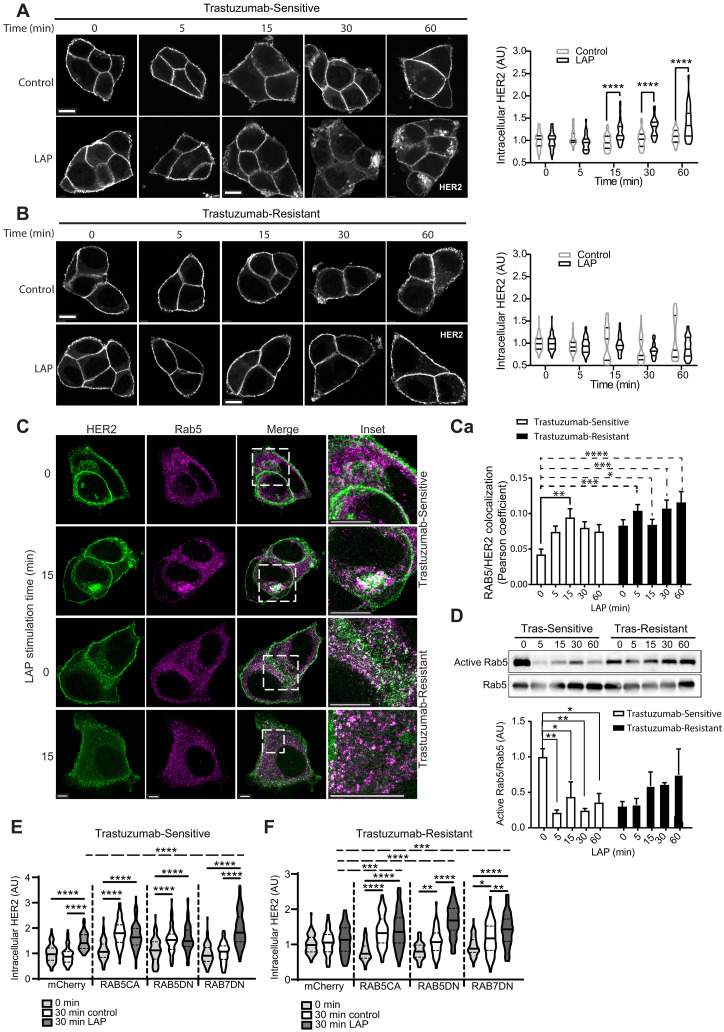
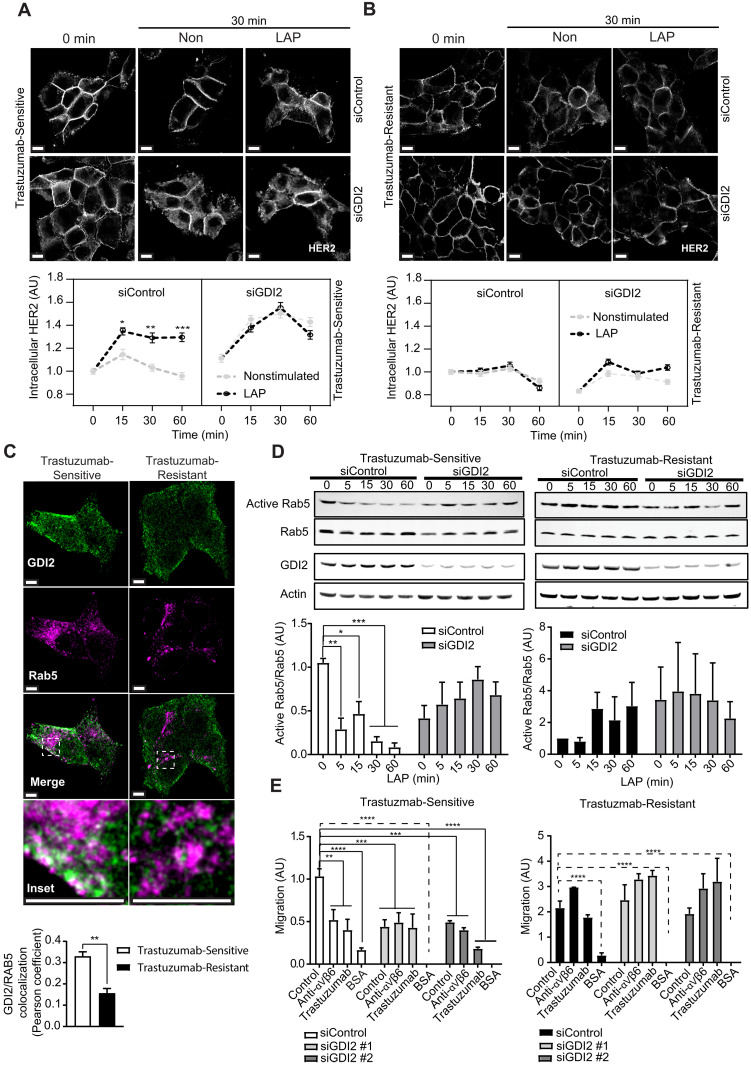
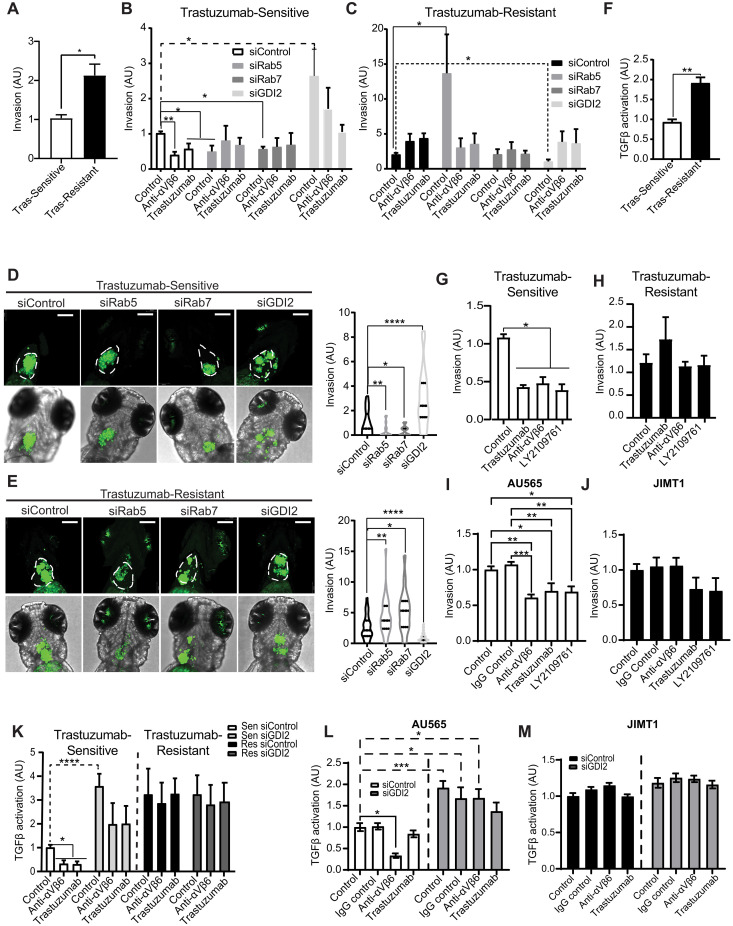
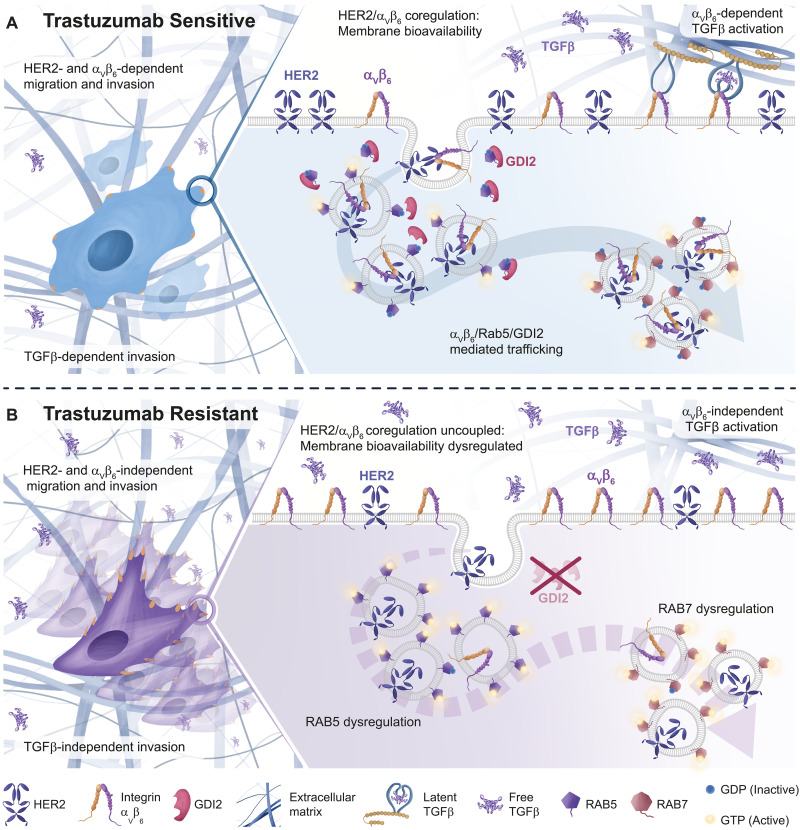
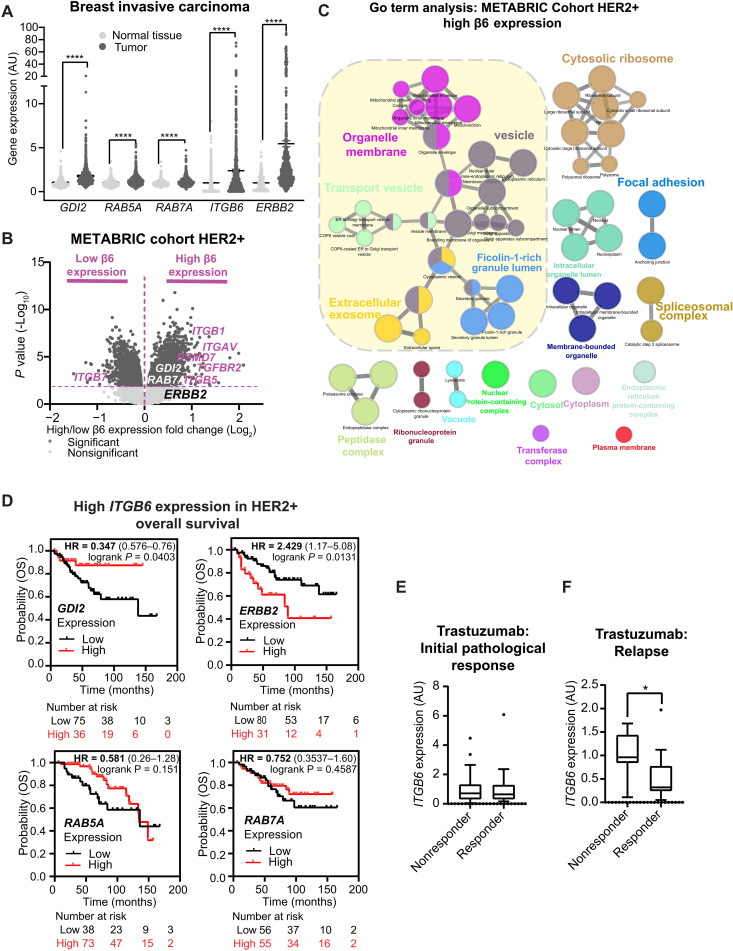
HER2 and αVβ6 integrin are independent predictors of breast cancer survival and metastasis. We identify an αVβ6/HER2 cross-talk mechanism driving invasion, which is dysregulated in drug-resistant HER2+ breast cancer cells. Proteomic analyses reveal ligand-bound αVβ6 recruits HER2 and a trafficking subnetwork, comprising guanosine triphosphatases RAB5 and RAB7A and the Rab regulator guanine nucleotide dissociation inhibitor 2 (GDI2). The RAB5/RAB7A/GDI2 functional module mediates direct cross-talk between αVβ6 and HER2, affecting receptor trafficking and signaling. Acute exposure to trastuzumab increases recruitment of the subnetwork to αVβ6, but trastuzumab resistance decouples GDI2 recruitment. GDI2, RAB5, and RAB7A cooperate to regulate migration and transforming growth factor-β activation to promote invasion. However, these mechanisms are dysregulated in trastuzumab-resistant cells. In patients, RAB5A, RAB7A, and GDI2 expression correlates with patient survival and αVβ6 expression predicts relapse following trastuzumab treatment. Thus, the RAB5/RAB7A/GDI2 subnetwork regulates αVβ6-HER2 cross-talk to drive breast cancer invasion but is subverted in trastuzumab-resistant cells to drive αVβ6-independent and HER2-independent tumor progression.


Figures

Fig. 1.
Fig. 1.. Integrin αVβ6 recruits HER2 and a trafficking regulatory subnetwork comprising RAB5/RAB7A/GDI2 in HER2+ breast cancer cells.
IAC enrichment coupled with free-label MS was used to define proteins specifically recruited to ligand-bound αVβ6 in HER2+ breast cancer cell lines. (A and B) Volcano plots demonstrating enrichment of proteins identified on LAP (αVβ6 integrin–selective ligand; right) and Coll-I (non-αVβ6 integrin binding ligand; left) matrices in (A) HER2-18 and (B) BT474 cells. Statistical analysis: Fisher’s exact test; quantitative method: weighted spectra; significance level: P < 0.05. Significant proteins (dark gray); nonsignificant proteins (light gray); proteins of interest highlighted in purple. (C and D) Visual representation of ClueGO cellular compartment GO analyses of proteins significantly enriched on LAP in comparison with Coll-I in (C) HER2-18 and (D) BT474 cells. Colors represent specific merged GO term groups, node size represents level of significance of each GO term, and clustering and edge length represent functionally grouped networks based on kappa score. Yellow boxes highlight the cytoplasmic vesicle GO term cluster. (E and F) Top functional subnetworks of proteins significantly enriched on LAP in comparison with Coll-I in (E) HER2-18 and (F) BT474 cells, identified using the OH-PIN algorithm. Colors represent the primary cellular compartment GO term associated with each protein as identified in (C) and (D), respectively. Yellow boxes [(Ea) and (Fa)] highlight the clusters of proteins related to GO term cytoplasmic vesicle, in the top functional subnetwork isolated from each cell line. [(Eb) and (Ec)] Second and third most significant subnetworks in HER2-18 cells. (Fb) All proteins in the cytoplasmic vesicle GO term within the primary functional subnetwork in αVβ6 integrin/LAP-enriched IACs in BT474 cells. All MS data represent three independent experiments. See also figs. S1 (HER2-18) and S3 (BT474) and data files S1 and S2.
Fig. 2.
Fig. 2.. HER2 and integrin αVβ6 colocalize and trastuzumab regulates HER2 and integrin αVβ6 expression.
(A) Immunoblot analysis of β6 integrin, αV integrin, HER2, paxillin, vinculin, ERK1/2, and GAPDH protein levels in IACs isolated from BT474 cells on LAP, FN, and Coll-I (N = 3). (B) HER2 (magenta) and β6 integrin (green) immunofluorescence in BT474 cells. Two Z planes of the same cell: (Ba) cell-matrix interface and (Bb) middle Z plane. Dashed boxes: insets. Arrows: membrane-proximal vesicular HER2/β6 colocalization; scale bars, 10 μm. (C) Immunoblot analysis of integrin β6, αV, and β1 and actin (loading control) expression in BT474 cells treated with trastuzumab (10 μg/ml) for 0, 1, and 24 hours (N = 3). One-way ANOVA, Šídák’s multiple comparison test. (D) Immunoblot analysis of total β6 integrin and HER2 expression, normalized to actin, in trastuzumab-sensitive (Sen) and trastuzumab-resistant (Res) BT474 cells (N = 3). Two-sided t test, Welch’s correction. (E) Flow cytometry analysis of cell surface αVβ6 integrin expression in trastuzumab-sensitive and trastuzumab-resistant BT474 cells [mean fluorescence intensity (MFI) normalized to Sen cells, N = 4]. Two-sided t test. (F) Fluorescence analysis of HER2 expression at the plasma membrane of trastuzumab-sensitive and trastuzumab-resistant nonpermeabilized BT474 cells surface labeled with FITC-conjugated HER2 affibody (N = 3; 44 to 52 cells per condition); scale bar, 10 μm. Two-sided Mann-Whitney test. (G) Flow cytometry analysis of HER2 cell surface expression in trastuzumab-sensitive (Sen) and trastuzumab-resistant (Res) BT474 cells (MFI normalized to Sen cells, N = 3). Two-sided t test. (H and I) Cell surface expression of αVβ6 integrin (H) and HER2 (I) by flow cytometry in HER2+ breast cancer cells that are endogenously sensitive (white) or resistant (black) to trastuzumab (N = 4). One-way ANOVA, Dunnett’s multiple comparison test. [(C) to (I)] Data shown are arbitrary units (AU) normalized to control means (untreated trastuzumab-sensitive BT474 cells) ± SEM. Statistical significance: *P < 0.05; **P < 0.01; ****P < 0.0001.
Fig. 3.
Fig. 3.. RAB5/RAB7A/GDI2 trafficking subnetwork is differentially recruited to αVβ6 IACs in HER2+ breast cancer cells by trastuzumab.
IAC enrichment coupled with free-label MS was used to define proteins specifically recruited to ligand-bound αVβ6 in BT474 cells. (A) Protein-protein interaction network of proteins significantly enriched in αVβ6-mediated complexes of trastuzumab-sensitive (blue nodes) and trastuzumab-resistant cells (red nodes). Lines (edges) linking nodes represent protein-protein interactions. (B) Visual representation of ClueGO cellular compartment GO analyses of proteins significantly enriched in αVβ6-mediated complexes of trastuzumab-resistant cells in comparison with trastuzumab-sensitive cells. Node size represents the number of mapped proteins in each GO term, color indicates the level of significance of each GO term, and node clustering and edge length represent functionally grouped networks based on kappa score. See also fig. S6 (C and D) [BT474 Trastuzumab-Sensitive +/− trastuzumab (10 μg/ml)]. (C and D) Volcano plots demonstrating enrichment of proteins identified on LAP in (C) BT474 Trastuzumab-Sensitive cells (right) versus BT474 Trastuzumab-Resistant cells (left) and (D) BT474 Trastuzumab-Sensitive cells following 96 hours pretreatment with sublethal concentration of trastuzumab (10 μg/ml) or vehicle control. Statistical analysis: Fisher’s exact test; quantitative method: weighted spectra; significance level: P < 0.05. Significant proteins (dark gray); nonsignificant proteins (light gray); proteins of interest highlighted in purple. (E) Heatmap displaying statistical significance (−log10 P values) of the best hit protein per group, clustered by their main GO terms. Data obtained from analysis displayed in (C) and (D). (F) Schematic representation of differential enrichment of trafficking regulatory subnetwork components in trastuzumab-sensitive and trastuzumab-resistant BT474 cells. Proteins recruited to, or depleted from, αVβ6 IACs are shown in red and blue, respectively. All MS data represent three independent experiments. See also fig. S6 (C and D) and data file S3.
Fig. 4.
Fig. 4.. Integrin αVβ6 engagement triggers internalization and vesicular accumulation of surface-labeled HER2 and modulates RAB5 activity in trastuzumab-sensitive cells.
(A and B) Affibody-chase experiments. Cells surface labeled with FITC-conjugated HER2 affibody and stimulated with soluble LAP (LAP) to stimulate αVβ6 integrin and trigger αVβ6 endocytosis, or vehicle (Control), 0- to 60-min time course. Quantitation represents cytoplasmic HER2 fluorescence intensity analysis in (A) trastuzumab-sensitive or (B) trastuzumab-resistant BT474 cells (N = 3; 27 to 50 cells per condition), normalized to control trastuzumab-sensitive BT474 cells (0 min); scale bar, 10 μm. Two-way ANOVA with Šídák’s multiple comparison test. Image intensity increased in (B), relative to (A), due to low cell surface HER2 levels in trastuzumab-resistant cells to highlight internalization differences. (C) HER2 (green) and RAB5 (magenta) immunofluorescence in trastuzumab-sensitive and trastuzumab-resistant BT474 cells, treated with soluble LAP, 0 to 60 min (N = 3; 16 to 28 cells per condition); scale bar, 10 μm. (Ca) HER2/RAB5 colocalization quantitation (Pearson’s coefficient ± SEM). Two-way ANOVA with Dunnett’s multiple comparison test. (D) Active RAB5 pull-down assays. 0- to 60-min LAP stimulation time course. Quantitation of mean RAB5 activity (pull-down eluate), relative to total RAB5 (lysate) ± SEM (N = 3), normalized to 0-min trastuzumab-sensitive cells. One-way ANOVA with Dunnett’s multiple comparison test. (E and F) Affibody-chase experiments in (E) siControl Trastuzumab-Sensitive or (F) Trastuzumab-Resistant BT474 cells expressing constitutively active RAB5 (RAB5CA), dominant-negative RAB5 (RAB5DN), dominant-negative RAB7 (RAB7DN), or mCherry vector control. Cells were surface labeled with FITC-conjugated HER2 affibody and stimulated with soluble LAP (LAP), or vehicle control (control), for 0 or 30 min. Quantitation represents cytoplasmic HER2 fluorescence intensity (N = 3; 81 to 87 cells per condition); scale bar, 10 μm. One-way ANOVA with Tukey’s multiple comparison test. Representative images in fig. S10 (A and B). Further HER2 internalization analyses: Supplementary Results and fig. S11 (A to D). [(A), (B), and (D) to (F)] Data are arbitrary units (AU) normalized to control means ± SEM. [(A) to (F)] Statistical significance: *P < 0.05; **P < 0.01; ***P < 0.001; ****P < 0.0001.
Fig. 5.
Fig. 5.. GDI2 regulates RAB5 activity and controls αVβ6-dependent HER2 endocytosis and cell migration.
(A and B) Affibody-chase experiments: siControl-transfected or siGDI2-transfected BT474 cells surface labeled with FITC-conjugated HER2 affibody and stimulated with soluble LAP (LAP) to stimulate αVβ6 integrin and trigger αVβ6 endocytosis, or vehicle (Control), 0- to 60-min time course. Quantitation represents cytoplasmic HER2 fluorescence intensity analysis in (A) trastuzumab-sensitive or (B) trastuzumab-resistant BT474 cells (N = 3; 74 to 160 cells per condition); scale bars, 10 μm. Two-way ANOVA with Tukey’s multiple comparison test. Image intensity increased in (B), relative to (A), due to low cell surface HER2 levels in trastuzumab-resistant cells to highlight internalization differences. (C) GDI2 (green) and RAB5 (magenta) immunofluorescence in trastuzumab-sensitive and trastuzumab-resistant BT474 cells (N = 3; >120 cells per condition); scale bars, 5 μm. GDI2/RAB5 colocalization quantitation (Pearson’s coefficient ± SEM), two-sided t test. (D) Role of GDI2 in αVβ6-dependent RAB5 activity modulation. Trastuzumab-sensitive and trastuzumab-resistant BT474 cells transfected with siRNA against GDI2 (siGDI2 #1 and #2) or control siRNA. 0- to 60-min LAP stimulation time course. Quantitation of mean RAB5 activity (pull-down eluate), relative to total RAB5 (lysate) ± SEM (N = 3), normalized to 0-min trastuzumab-sensitive cells. N = 4 independent replicate experiments. Two-way ANOVA with Šídák’s multiple comparison tests. (E) Haptotactic migration analysis of BT474 cells (Trastuzumab-Sensitive and Trastuzumab-Resistant) in Transwell coated with FN or BSA as a negative control. Cells were transfected with siRNA against GDI2 (siGDI2 #1 and #2) or siRNA control. Migration was assessed over 24 hours in the presence or absence of αVβ6 integrin blocking antibody or trastuzumab. Data shown are means ± SEM (N = 3). One-way ANOVA with Šídák’s multiple comparison tests. [(A), (B), (D), and (E)] Data are arbitrary units (AU) normalized to control means ± SEM. [(A) to (E)] Statistical significance: *P < 0.05; **P < 0.01; ***P < 0.001; ****P < 0.0001.
Fig. 6.
Fig. 6.. RAB5, RAB7A, and GDI2 differentially regulate invasion and TGFβ activity in trastuzumab-sensitive and trastuzumab-resistant cells.
(A) Invasion of trastuzumab-sensitive versus trastuzumab-resistant through the cross-linked collagen-rich and FN-rich ECM (N = 3). Two-sided t test. (B and C) Invasion of siControl, siRAB5A, siRAB7A, and siGDI2 trastuzumab-sensitive (B) or trastuzumab-resistant (C) cells, in the presence or absence of integrin αVβ6 blocking antibody (10 μg/ml) or trastuzumab (10 μg/ml). Note different y axis scales: (B) 0 to 4; (C) 0 to 20. N = 4. (D and E) Invasion/dissemination of CFSE-labeled siRAB5A, siRAB7A, siGDI2, or siControl BT474 trastuzumab-sensitive (D) or resistant cells (E) in a zebrafish xenograft model. Xenografts imaged 48 hours after injection. Images: maximum intensity projections; scale bars, 30 μm. n = 20 to 35 animals per condition. [(B) to (E)] Welch’s ANOVA with Dunnett’s multiple comparisons test. (F) TGFβ activity coculture assay comparing BT474 trastuzumab-sensitive and trastuzumab-resistant cells (N = 3). Two-sided t test. (G and H) Invasion of trastuzumab-sensitive (G) or trastuzumab-resistant (H) BT474 cells in the presence or absence of αVβ6 integrin blocking antibody (10 μg/ml), trastuzumab (10 μg/ml), or TGFβ receptor 1/2 inhibitor (LY2109761; 10 μM) (N = 3). (I and J) Invasion of trastuzumab-sensitive AU565 cells (I) or trastuzumab-resistant JIMT1 cells (J) in the presence or absence of αVβ6 integrin blocking antibody (10 μg/ml), trastuzumab (10 μg/ml), or TGFβ receptor 1/2 inhibitor (10 μM) (N = 6). (K) TGFβ activity analysis of siGDI2 and siControl trastuzumab-sensitive and trastuzumab-resistant BT474 cells treated with αVβ6 integrin blocking antibody or trastuzumab (N = 4; 4 wells per biological replicate). [(G) to (K)] One-way ANOVA with Tukey’s multiple comparison tests. (L and M) TGFβ activation assays with trastuzumab-sensitive AU565 (L) and trastuzumab-resistant JIMT1 (M) cells expressing siGDI2 or siControl treated in the presence or absence of αVβ6 integrin antibody (10 μg/ml) or trastuzumab (10 μg/ml) (N = 3; 5 wells per biological replicate). Two-way ANOVA with Šídák’s multiple comparison test. [(A) to (M)] Data are arbitrary units (AU) normalized to control means ± SEM. Statistical significance: *P < 0.05; **P < 0.01; ***P < 0.001; ****P < 0.0001.
Fig. 7.
Fig. 7.. Integrin αVβ6/HER2 cross-talk and trafficking drive breast cancer invasion and are dysregulated by trastuzumab resistance.
(A) Trastuzumab-Sensitive Cells: GDI2 is recruited to sites proximal to αVβ6 IACs and coordinates HER2 and αVβ6 trafficking and signaling by locally modulating RAB5 activity. GDI2-mediated cross-talk between αVβ6 and HER2 affects membrane availability of both receptors, ultimately influencing migration, invasion, and TGFβ activation. (B) Trastuzumab-Resistant Cells: GDI2 is excluded from αVβ6 IACs, leading to dysregulation of RAB5 activation dynamics, followed by increased RAB7 activation. Consequently, HER2/αVβ6 cross-talk is impaired, altering receptor trafficking dynamics and disrupting bioavailability of both HER2 and αVβ6 integrin at the plasma membrane. This dysregulation further affects TGFβ activation, resulting in increased cell invasiveness and metastatic potential. Overall, these changes may increase the ability of cells to evade HER2 targeting drugs.
Fig. 8.
Fig. 8.. Trafficking regulatory subnetwork is highly expressed in high αVβ6 expressing breast tumors and αVβ6 correlates with therapeutic response.
(A) Differential gene expression data (RNA-seq) for the GDI2/RAB5A/RAB7A/ERBB2/ITGB6 cluster in normal breast tissue (n = 403; light gray) and breast invasive carcinoma (n = 1097; dark gray). Data were extracted from the TNMplot database (tnmplot.com). Black lines in violin blots represent the median. Mann-Whitney test. (B) Volcano plot showing statistical analysis (ANOVA) of RNA-seq gene expression data of patients with HER2+ breast cancer from the METABRIC cohort expressing high (Right) and low (Left) levels of ITGB6 (Q1 versus Q4). Significant genes (dark gray); nonsignificant genes (light gray); relevant genes are highlighted in purple. (C) Visual representation of GO terms analysis (ClueGO, cellular compartment) of genes highly and significantly expressed in tumors expressing high levels of ITGB6 (Q4). Colors represent specific merged GO term groups, node size represents the level of significance of each GO term, and clustering and edge length represent functionally grouped networks based on kappa score. (D) OS of patients with HER2+ breast cancer and with high (above median) expression of ITGB6, expressing high (red) or low (black) levels of GDI2, ERBB2, RAB5A, and RAB7A. (E and F) Differential ITGB6 gene expression (gene chip) in patients with HER2+ breast cancer subdivided according to therapeutic response to trastuzumab. (E) Initial pathological complete response (responder) versus residual disease after completing therapy (nonresponder) (n = 77 patients). (F) RFS at 5 years (responder) versus samples relapsed before 5 years (nonresponder) (n = 24 patients). Two-sided Student’s t test. [(A), (E), and (F)] Statistical significance: *P < 0.05; ****P < 0.0001.

References

    1. Ross J. S., Fletcher J. A., The HER-2/neu oncogene in breast cancer: Prognostic factor, predictive factor, and target for therapy. Oncologist 3, 237–252 (1998). - PubMed
    1. Yarden Y., Sliwkowski M. X., Untangling the ErbB signalling network. Nat. Rev. Mol. Cell Biol. 2, 127–137 (2001). - PubMed
    1. Ren Y., Chen D., Zhai Z., Chen J., Li A., Liang Y., Zhou J., JAC1 suppresses proliferation of breast cancer through the JWA/p38/SMURF1/HER2 signaling. Cell Death Discov. 7, 85 (2021). - PMC - PubMed
    1. Andersson J., Linderholm B., Greim G., Lindh B., Lindman H., Tennvall J., Tennvall-Nittby L., Pettersson-Skold D., Sverrisdottir A., Soderberg M., Klaar S., Bergh J., A population-based study on the first forty-eight breast cancer patients receiving trastuzumab (Herceptin) on a named patient basis in Sweden. Acta Oncol. 41, 276–281 (2002). - PubMed
    1. Carlsson J., Nordgren H., Sjostrom J., Wester K., Villman K., Bengtsson N. O., Ostenstad B., Lundqvist H., Blomqvist C., HER2 expression in breast cancer primary tumours and corresponding metastases. Original data and literature review. Br. J. Cancer 90, 2344–2348 (2004). - PMC - PubMed

Publication types

MeSH terms