. 2024 Dec 6;10(49):eadl0649.
doi: 10.1126/sciadv.adl0649. Epub 2024 Dec 4.

Phosphatidylinositol 4,5-bisphosphate drives the formation of EGFR and EphA2 complexes

Affiliations

Phosphatidylinositol 4,5-bisphosphate drives the formation of EGFR and EphA2 complexes

Pradeep Kumar Singh et al. Sci Adv. .

Abstract

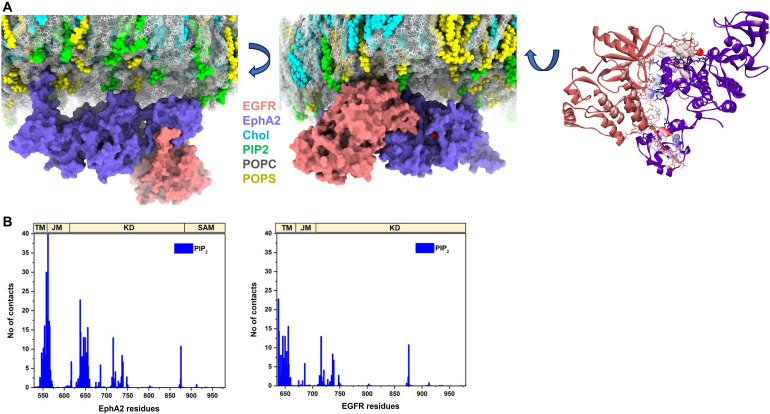
Receptor tyrosine kinases (RTKs) regulate many cellular functions and are important targets in pharmaceutical development, particularly in cancer treatment. EGFR and EphA2 are two key RTKs that are associated with oncogenic phenotypes. Several studies have reported functional interplay between these receptors, but the mechanism of interaction is still unresolved. Here, we use a time-resolved fluorescence spectroscopy called PIE-FCCS to resolve EGFR and EphA2 interactions in live cells. We tested the role of ligands and found that EGF, but not ephrin A1 (EA1), stimulated heteromultimerization between the receptors. To determine the effect of anionic lipids, we targeted phospholipase C (PLC) activity to alter the abundance of phosphatidylinositol 4,5-bisphosphate (PIP2). We found that higher PIP2 levels increased homomultimerization of both EGFR and EphA2, as well as heteromultimerization. This study provides a direct characterization of EGFR and EphA2 interactions in live cells and shows that PIP2 can have a substantial effect on the spatial organization of RTKs.


Figures

Fig. 1.
Fig. 1.. Sketch layout of PIE-FCCS and its role in membrane protien interaction.
(A) Diagram illustrates the optical path of dual-color PIE-FCCS. A super-continuum, pulsed laser-generated excitation beams (488 and 561 nm) that were directed into the sample by a dichroic mirror and microscope objective. The lasers were focused to a diameter of about 250 nm on the plasma membrane of live cells. Fluorescence emission was collected by the objective, filtered, and directed to single-photon counting modules connected to a TCSPC module for data recording. (B) Epifluorescence images are shown for COS-7 cells expressing EGFR-mCH (top) and EphA2-eGFP (bottom). (C) Summary data from independent experiments collected on five different days of single-cell measurements are shown for the controls and EGFR with EphA2 (***P < 0.0004). (D to F) Representative single-cell PIE-FCCS data are shown for a monomer control (SRC), dimer control (GCN4), and EGFR with EphA2 in COS-7 cells, respectively. In each graph, the green line is the autocorrelation function (ACF) for eGFP, the red line is the ACF for mCH, and the blue line is the cross-correlation function (CCF) between both protein constructs.
Fig. 2.
Fig. 2.. PIE-FCCS investigation of the homomeric interactions of EGFR and EphA2.
(A) Self-assembly of EGFR was studied under various conditions. PIE-FCCS data were recorded, and the resulting fc values are reported before treatment (white), after the addition of EGF (gray), after treatment with the PLC inhibitor U73122 (blue), and after treatment with the PLC activator 3M3FBS (green). (B) Diffusion coefficients for EGFR are shown for each treatment condition. (C) Epifluorescence images of EGFR expressing COS-7 cells without (top) and with (bottom) EGF ligand treatment. (D) Homomultimerization state of EphA2 was recorded under the same treatments except the ligand treatment was with EA1. (E) Diffusion coefficients are shown for EphA2 under each treatment condition. (F) Epifluorescence images of EphA2 expressing COS-7 cells are shown without (top) and with (bottom) EA1 ligand treatment. In the box-and-whiskers plots, the whiskers indicate the maximum and minimum values; the box indicates the 25th to 75th percentile, and the line is the median value (median value shown as text). We performed one-way analysis of variance (ANOVA) tests with uncorrected Fisher’s least significant difference (LSD) post hoc tests to obtain adjusted and individual P values (*P < 0.0367, **P < 0.0034, and ****P < 0.0001). Diffusion coefficient data are represented as mean values ± SEM. NS, not significant.
Fig. 3.
Fig. 3.. Heteromultimerization of EGFR and EphA2 in the presence of ligands and PLC drugs.
(A) PIE-FCCS data for EGFR-mCH and EphA2-eGFP coexpressed in COS-7 cells. Data were recorded before treatment (white), after the addition of EGF (gray) or EA1 (orange), and after treatment with the PLC inhibitor U73122 (blue) or with the PLC activator 3M3FBS (green). (B) Diffusion coefficients of EGFR-mCH after treatment with ligands and PLC-regulating drugs. (C) Diffusion coefficients of EphA2-eGFP after treatment with ligands and PLC-regulating drugs. (D) Representative epifluorescence images from each set of experiments. One-way ANOVA tests with uncorrected Fisher’s LSD post hoc tests show the individual P values (*P < 0.0259, **P < 0.003, and ****P < 0.0001). Diffusion coefficient data are represented as mean values ± SEM.
Fig. 4.
Fig. 4.. EGFR and EphA2 phosphorylation changes after treatment with ligand and PLC drugs.
(A) Representative Western blots after treatment with EA1 (15 min, 500 ng/ml), 3M3FBS (45 min, 25 μM), or 3M3FBS followed by EA1. (B) Representative Western blots after treatment with U73122 (15 min, 5 μM), EA1 (as above), EGF (15 min, 100 ng/ml), or U73122 followed by each ligand. (C) Quantification of EphA2 pS897 levels in all conditions normalized to the corresponding total EphA2 bands. N = 6 to 12. Statistical analysis was performed using a Kruskal-Wallis test [H(7) = 19.45, P = 0.007] with a Mann-Whitney U test for comparisons between groups. Significance values were adjusted by the Bonferroni correction for multiple tests. (D) Quantification of total EphA2 levels in all conditions normalized to actin. N = 6 to 12. Statistical analysis was performed using a Kruskal-Wallis test [H(7) = 38.44, P = 3.0 × 10⁻⁶] with a Mann-Whitney U test for comparisons between groups. Significance values were adjusted by the Bonferroni correction for multiple tests. *P < 0.05, **P < 0.01, and ***P < 0.001.
Fig. 5.
Fig. 5.. AlFoM model of the heterodimer of EGFR residues 669 to 1210 (cyan) and EphA2 residues 559 to 976 (purple).
Predictions are shown for EphA2 WT (A) or for the S897E/S901E mutant (B) representative of phosphorylation at serine residues (red bubbles). Yellow residues indicate the active site of each kinase region. The purple halo encompasses the EphA2 SAM domain, while the cyan halo shows the EGFR JM domain. The red arrow indicates the EphA2 kinase active site, which is sterically blocked by the EGFR kinase domain in (A), but not in (B).
Fig. 6.
Fig. 6.. Comparison of EGFR and EphA2 interactions with the lipid bilayer.
(A) Snapshots illustrating the predominant conformation of the EGFR-EphA2 heterodimer after molecular dynamics simulations. The intracellular view highlights the EGFR-EphA2 heterodimer’s association with the lipid bilayer, where EGFR is shown in salmon and EphA2 in purple-blue surfaces. Cholesterol, PIP2, and POPS are depicted as cyan, green, and yellow spheres, respectively, while POPC is displayed as gray lines for clarity. The image on the right shows the interaction interface surface of the heterodimer viewed from the intracellular side. (B) Comparison of the number of contacts between EGFR and EphA2 with PIP2 in the membrane over the course of the simulation. The number of contacts is averaged across four replica simulations, considering a 6-Å cutoff distance. KD, kinase domain; SAM, sterile alpha motif.
Fig. 7.
Fig. 7.. Model for EGFR-EphA2 heterodimerization.
When PIP2 levels are normal, EGFR (blue) and EphA2 (orange) do not interact in the absence of ligand. When EGF is present, active heterodimer forms in which EGFR Y1068 and EphA2 S897 are phosphorylated. The active conformation of the ICDs allows a more open EphA2 kinase domain with the EGFR JM free to move away from the membrane. Under increased PIP2 conditions, PIP2 promotes inactive heterodimer formation. The inactive dimer is likely stabilized by the EGFR JM electrostatically interacting with the membrane, and the EGFR ICD is pulled toward the membrane to close the EphA2 kinase domain.

Update of

References

    1. Santos R., Ursu O., Gaulton A., Bento A. P., Donadi R. S., Bologa C. G., Karlsson A., Al-Lazikani B., Hersey A., Oprea T. I., Overington J. P., A comprehensive map of molecular drug targets. Nat. Rev. Drug Discov. 16, 19–34 (2017). - PMC - PubMed
    1. Groves J. T., Kuriyan J., Molecular mechanisms in signal transduction at the membrane. Nat. Struct. Mol. Biol. 17, 659–665 (2010). - PMC - PubMed
    1. Paul M. D., Hristova K., The transition model of RTK activation: A quantitative framework for understanding RTK signaling and RTK modulator activity. Cytokine Growth Factor Rev. 49, 23–31 (2019). - PMC - PubMed
    1. Lemmon M. A., Schlessinger J., Cell signaling by receptor tyrosine kinases. Cell 141, 1117–1134 (2010). - PMC - PubMed
    1. Paul M. D., Hristova K., The RTK Interactome: Overview and perspective on RTK heterointeractions. Chem. Rev. 119, 5881–5921 (2019). - PMC - PubMed

Publication types

MeSH terms