. 2024 Dec 16;4(12):100911.
doi: 10.1016/j.crmeth.2024.100911. Epub 2024 Dec 3.

Single chromatin fiber profiling and nucleosome position mapping in the human brain

Affiliations

Single chromatin fiber profiling and nucleosome position mapping in the human brain

Cyril J Peter et al. Cell Rep Methods. .

Abstract

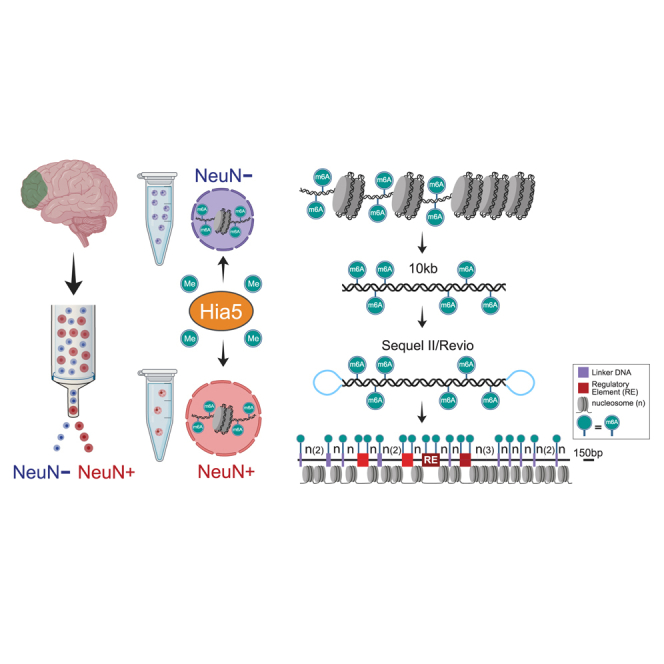
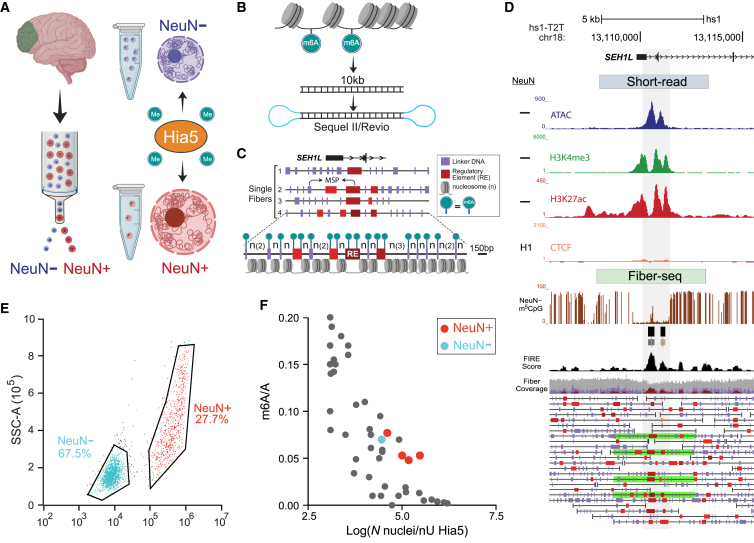
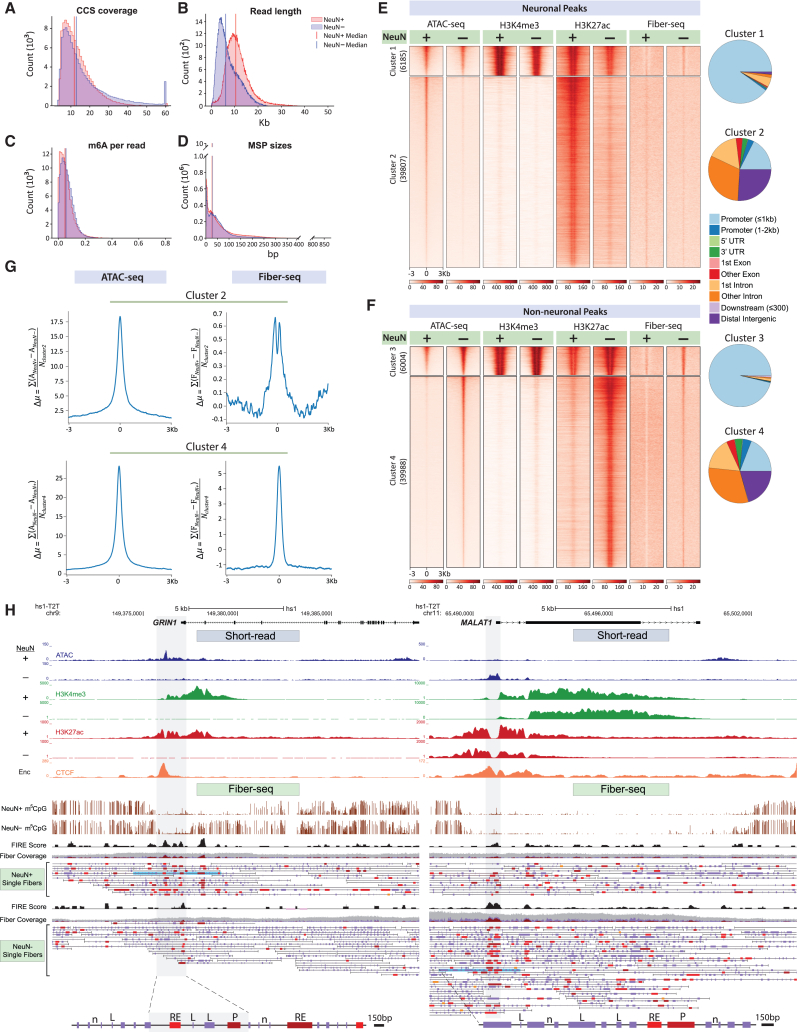
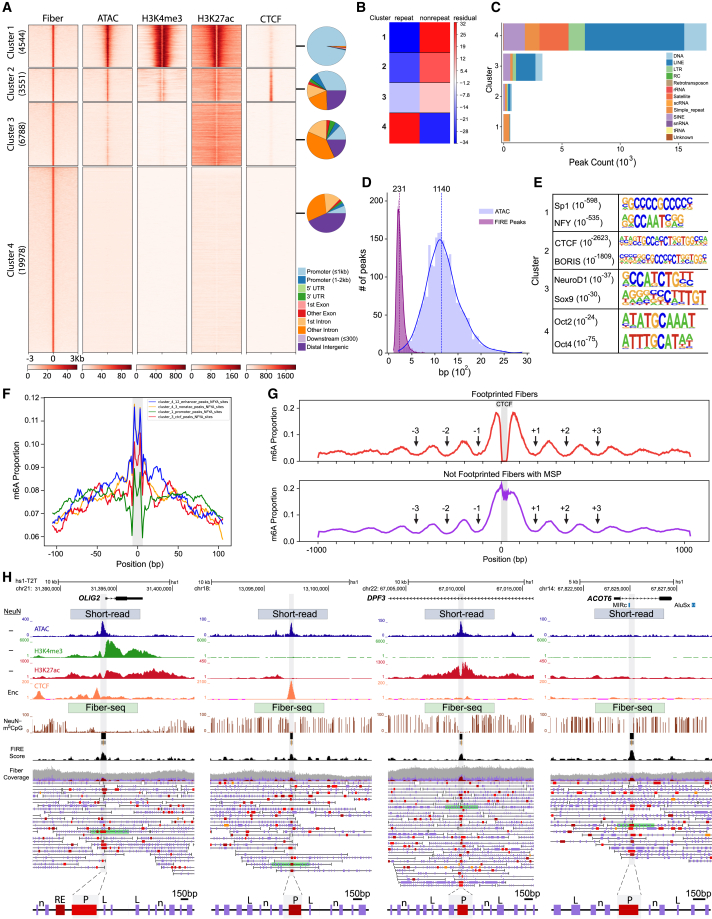
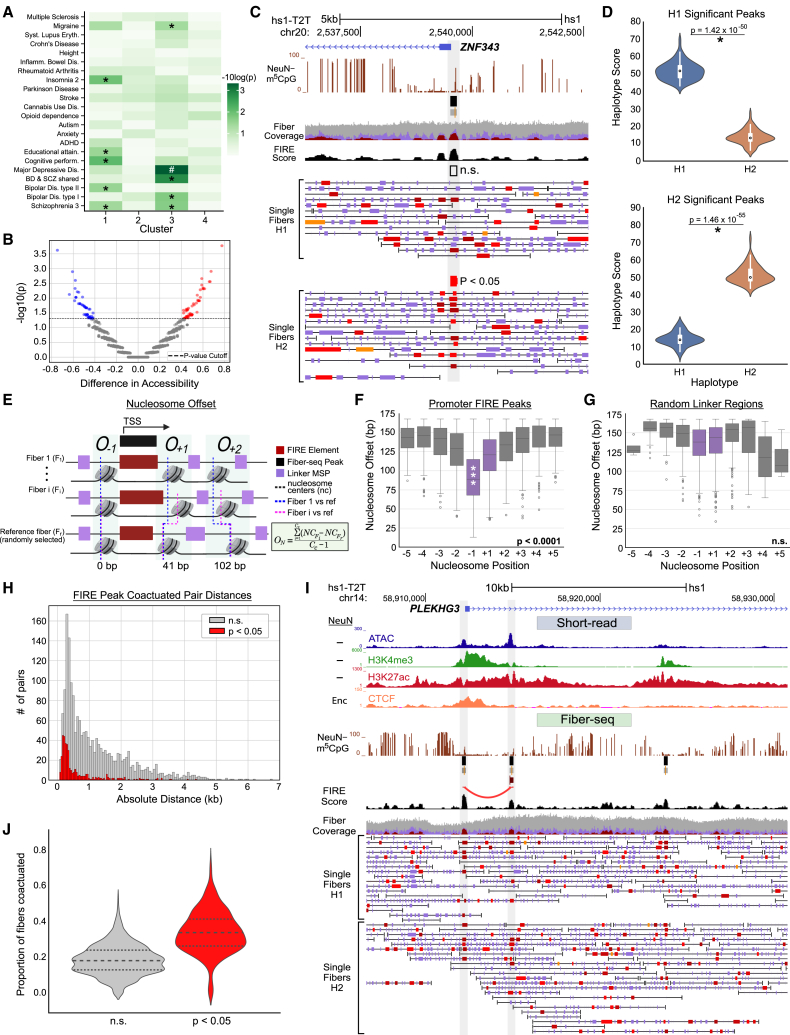
We apply a single-molecule chromatin fiber sequencing (Fiber-seq) protocol designed for amplification-free cell-type-specific mapping of the regulatory architecture at nucleosome resolution along extended ∼10-kb chromatin fibers to neuronal and non-neuronal nuclei sorted from human brain tissue. Specifically, application of this method enables the resolution of cell-selective promoter and enhancer architectures on single fibers, including transcription factor footprinting and position mapping, with sequence-specific fixation of nucleosome arrays flanking transcription start sites and regulatory motifs. We uncover haplotype-specific chromatin patterns, multiple regulatory elements cis-aligned on individual fibers, and accessible chromatin at 20,000 unique sites encompassing retrotransposons and other repeat sequences hitherto "unmappable" by short-read epigenomic sequencing. Overall, we show that Fiber-seq is applicable to human brain tissue, offering sharp demarcation of nucleosome-depleted regions at sites of open chromatin in conjunction with multi-kilobase nucleosomal positioning at single-fiber resolution on a genome-wide scale.

Keywords: CP: Biotechnology; CP: Neuroscience; Hia5 methyltransferase; adenine methylation; cytosine methylation; long-read sequencing; nucleosomal array; nucleosomal offset; postmortem brain; transcription factor footprint.


Conflict of interest statement

Declaration of interests A.B.S. is a co-inventor on a patent relating to the Fiber-seq method (US17/995,058).

Figures

None
Graphical abstract
Figure 1
Figure 1
Single chromatin fiber long-read epigenomic profiling by cell type in human brain (A–D) Work flow. (A) Fluorescence-activated cell sorting (FACS) of NeuN immunostained neuronal and non-neuronal nuclei from the region of interest (PFC) and in situ incubation of the intact nuclei with adenine methyltransferase Hia5 for m6A tagging of extranucleosomal genomic DNA, followed by (B) amplification-free PacBio (Sequel II or Revio) long-read sequencing of ∼10-kb single DNA molecules derived directly from the brain nuclei. (C and D) Early step computational analyses include annotation to the telomere-to-telomere T2T-CHM13v2.0/hs1 genome, mapping of Hia5 methylation-sensitive patches (MSPs)/nucleosome-depleted regions, and calling of linker DNA (purple) and regulatory elements (red, brown), such as promoters and enhancers, at single-fiber resolution. (C) Example fiber visualizations were taken from the NeuN Fiber-seq reference set, showing the promoter region of the chr18 SEH1L gene locus. Portions of fibers shown (fiber 1–4) are marked by green bars in (D). Fiber 4 in (C) is shown at enlarged scale, highlighting Fiber-seq-generated nucleosomal position map at single-nucleosome resolution. (D) hs1-T2T genome browser shots for PFC non-neuronal chromatin profiles at the SEH1L locus, including (top to bottom) “peak” landscapes for (blue) ATAC, (green) H3K4me3, (red) H3K27ac-seq, and (orange) CTCF ENCODE (Enc.) neural cell line (CTCF short-read-based peak landscapes). Fiber-seq long-read sequencing: (brown) m5CpG tracks, (black) Fiber-seq FIRE scores of MSPs. NeuN single DNA molecules = single chromatin fibers as indicated; green-shaded single DNA molecules/chromatin fibers are highlighted as representative fiber examples shown in (C), including the fourth fiber at 150 bp resolution. Purple vertical rectangles mark linker DNA. Red/brown MSPs scoring as regulatory elements (P, promoter, and other REs, regulatory elements) on fiber (FIRE false discovery rate [FDR], orange, 0.10 ≥ q > 0.05; bright red, 0.05 ≥ q > 0.01; dark red-brown, q ≤ 0.01). (E) Representative FACS showing efficient separation of non-neuronal (NeuN) from neuronal (NeuN+) nuclei. (F) Genome-scale proportion of methyladenines (m6A/total A; y axis) in 46 Fiber-seq-processed samples of human brain nuclei. Each sample/aliquot was sequenced at low depth (see text), and the m6A/A was computed as an average across all DNA molecules of a sample. The x axis marks the number of nuclei/nU Hia5 enzyme for each sample of nuclei (log scale, x axis). Blue dot, NeuN reference sample sequenced with 11,143,795 reads/median of 30-fold genomic coverage; red dots, NeuN+ samples (4 aliquots × 2 brains) picked for sequencing to a total of 4,749,556 reads/median of 20-fold genomic coverage.
Figure 2
Figure 2
Hia5 m6A tagging of accessible chromatin and internucleosomal DNA in neurons and non-neurons at single-molecule resolution (A–D) Quality controls for PFC NeuN+ (red) and NeuN (blue) Fiber-seq, including (A) proportional representation of DNA molecules by circular consensus sequence (CCS) coverage, (B) read length, (C) m6A/A per read, and (D) genome-wide counts of (Hia5) methylation sensitive patches (MSPs) (y axis) by base pair length (x axis). (E and F) Heatmap for 6-kb sequences centered on 45,992 ATAC-seq peaks each for (E) NeuN+ and (F) NeuN, split by k-means (k = 2) into promoter prominent (NeuN+) ATAC cluster 1 and (NeuN) cluster 3 and enhancer prominent (NeuN+) ATAC cluster 2 and (NeuN) cluster 4, as indicated. Numbers in parentheses indicate number of peaks by cluster. Pie charts display the genomic annotation of each cluster. Cell-type-specific alignments (NeuN+, NeuN) are shown for (left to right) ATAC-seq, H3K4me3 and H3K27ac ChIP-seq, and m6A signal in the (by cell type) corresponding Fiber-seq libraries (see text). Notice strong cell-type-specific NeuN+ versus NeuN differential regulation for enhancer-dominated clusters 2 and 4 compared to promoter-dominated clusters 1 and 3. (G) Signal difference by cell type (NeuN+ versus NeuN) for each of the 39,807 neuronal ATAC-seq peaks from cluster 2 (E) and for each of the 39,988 non-neuronal ATAC-seq peaks from cluster 4 (F), using the formula shown on the y axis of each plot. For each set of enhancer peaks, the difference in ATAC counts and percentage accessibility was computed for every peak at each position and then divided by the total number of peaks in the cluster to determine the average difference in ATAC-seq counts and Fiber-seq percentage accessibility at each position relative to the center of the ATAC-seq peaks. For NeuN+ enhancers, NeuN signal was subtracted from NeuN+ signal, while for NeuN enhancers, NeuN+ signal was subtracted from NeuN signal. The exact equation used to calculate the per-position difference in ATAC-seq counts and Fiber-seq percentage accessibility is noted in the y axis label of each plot. The ATAC-seq counts for NeuN+ and NeuN are denoted as ANeuN+ and ANeuN−, respectively, while for Fiber-seq percentage accessibility they are referred to as FNeuN+ and FNeuN−. The NeuN+ and NeuN enhancer ATAC peaks are denoted as Ncluster2 and Ncluster4. (H) Representative browser shots, ∼15 kb wide, comparing hs1-T2T genome annotated neuronal and non-neuronal chromatin from PFC (top) short-read epigenomic landscapes with (bottom) Fiber-seq signals for (left) GRIN1 NMDA receptor gene locus (chromosome 9q34.3) and (right) long non-coding RNA MALAT1 locus (chromosome 11q13.1) (right). Top to bottom, as indicated, GRIN1 gene map, NeuN+- and, separately, NeuN- specific “peak” landscapes for (blue) ATAC, (green) H3K4m3, (red) H3K27ac-seq, and (orange) H1 neural cell line (ENCODE) CCCTC-binding factor (CTCF) peak landscape. Fiber-seq long-read sequencing: (brown) m5CpG tracks by cell type, (black) NeuN+ Fiber-seq FIRE scores of methylation-sensitive patches (MSPs); NeuN+ and NeuN single DNA molecules are as indicated; blue-shaded single DNA molecules/chromatin fibers are highlighted as representative examples and shown at the bottom again at a higher (150 bp) resolution, with purple-colored vertical rectangles marking linker DNA (examples marked by “L” on fiber), with single-nucleosome (“n” on fiber) resolution, and red/brown-colored MSPs scoring as regulatory elements (P, promoter, and RE, regulatory element on fiber) by FIRE analyses (orange, FDR 0.10 ≥ q > 0.05; bright red, FDR 0.05 ≥ q > 0.01; dark red-brown FDR q ≤ 0.01). Notice prominence of FIRE nucleosome-depleted regions (NDRs) for GRIN1 in neuronal and for MALAT1 in non-neuronal fibers.
Figure 3
Figure 3
Fiber-seq FIRE peak-based analysis of nucleosome-depleted regions (NDRs) (A) Fiber-seq FIRE-defined peak heatmap of PFC NeuN nuclei population, with k-means Fiber-seq clusters 1–4 and their alignments by corresponding sequences from PFC NeuN open chromatin ATAC-seq, transcriptional histone marks H3K4me3 and H3K27ac, and Encode H1 neural cell line CTCF ChIP-seq conventional short-read sequencing. (B) Cluster-specific enrichment scores for repeat and non-repeat sequences; note that repeat enrichment is specific for cluster 4 (chi-squared, df = 3, p = 2.2 × 10−16). (C) Total peak count by type of DNA repeat and Fiber-seq cluster, as indicated. Notice that retroelements, including LINEs, SINEs, and LTR-associated fiber peaks (NDRs), are overwhelmingly locating to fiber cluster 4 with only very minimal contributions by clusters 1–3. (D) PFC NeuN Fiber-seq and ATAC-seq peak size distribution profiles; notice several-fold sharper peak size in former compared to latter. (E) Top scoring HOMER regulatory motifs to each for the four Fiber-seq peak clusters, 1–4 (p, Kolmogorov-Smirnov). (F) Fine-grained regulatory motif footprint for NFY TF with fiber cluster-specific binding scores as indicated (∗∗∗p < 1e−16, Kruskal-Wallis); note sharp footprints centered in NDRs. (G) Plots depicting the average proportion of adenines that are methylated in fibers centered on n =1,855 specific CTCF binding sites (see text), with fibers with (top) MSP harboring a CTCF footprint and (bottom) MSP with no footprint. Arrows point to local minima adjacent to MSP, indicating strong phasing with well-positioned nucleosomes and cis actuation of flanking nucleosomal array. See also, as additional control, Figure S6F for fibers with a CTCF motif but no MSP. (H) Representative hs1-T2T genome browser shots of cluster-specific genomic loci, with single-fiber resolution by cluster. (Left to right) Cluster 1 OLIG2, cluster 2 intergenic, cluster 3 DPF3, and cluster 4 ATOC6 gene locus. (Top to bottom) PFC NeuN-specific “peak” landscapes for (blue) ATAC, (green) H3K4me3, (red) H3K27ac-seq, and (orange) CTCF ENCODE neural cell line CTCF short-read-based peak landscapes. Fiber-seq long-read sequencing: (brown) m5CpG tracks by cell type, (black) NeuN+ Fiber-seq FIRE scores of MSPs; NeuN+ and NeuN single DNA molecules are as indicated; green-shaded single DNA molecules/chromatin fibers are highlighted as representative examples and shown at the bottom again at a higher (150 bp) resolution, with purple vertical rectangles marking linker DNA (examples marked by “L” on fiber), and single-nucleosome (“n” on fiber) resolution. Red/brown-colored MSPs scoring as regulatory elements (P, promoter, and other RE, regulatory element, on fiber) (FIRE FDR, orange, 0.10 ≥ q > 0.05; bright red, 0.05 ≥ q > 0.01; dark red-brown, q ≤ 0.01).
Figure 4
Figure 4
Nucleosomes show sequence-specific fixation proximal to accessible TSS (A) Enrichment of brain-specific traits based on the identity of GWAS-locus-specific SNPs in each cluster of Fiber-seq-called peaks, excluding peaks located at repetitive regions. Significant traits are labeled with ∗ (p < 0.05) and # (p < 0.01). (B) Volcano plot of Fiber-seq peaks with haplotype-specific differences (N = 3,708), with the difference in accessibility on the x axis and the −log10 p value on the y axis. Peaks with nominal p < 0.05 by a Fisher test are colored red (H1 high) and blue (H2 high). (C) UCSC genome browser visualization of fiber-to-fiber variability including a significantly haplotype differential Fiber-seq peak and Fiber-seq reads phased for haplotype at the ZNF343 promoter (H1, n.s. as indicated; H2, p < 0.05, Fisher test). (D) Violin plots showing the distribution of haplotype-specific FIRE score at significant (top) H1-high and (bottom) H2-high peaks. The p value comparing the score was calculated using a paired t test (p < 1.42e−50 for both). (E) Schematic showing the calculation of nucleosome offsets for a single NDR at a TSS region. Each row represents a fiber, with the accessible patches colored red (FIRE) and purple (linker) and the nucleosomes positioned between them, in stylized fashion. The offset was computed by subtracting the center of the nucleosome at a randomly selected reference fiber from all other nucleosomes at that position relative to the location of the NDR. (F) Boxplots showing the distribution of nucleosome offsets for the first five nucleosomes upstream and downstream TSSs with a FIRE peak. Peak-adjacent nucleosomes are colored purple, while all others are shown in gray. The p values were computed across all distributions comparing the most proximal nucleosomes to all others using Wilcoxon rank sum (p < 0.0001). (G) Boxplots showing the distribution of nucleosome offsets for the first five nucleosomes upstream and downstream centered at randomly selected internucleosomal linker regions; linker-adjacent nucleosomes are shown in purple, while all others are shown in gray. In the randomly picked regions, no nucleosomes showed significant differences in offsets compared to the rest, via Wilcoxon rank sum. (H) Histogram showing the absolute genomic distance between each two peaks within pairs of significant (red, N = 436, p < 0.05) and not significant (gray, N = 1,472) co-actuated pairs of peaks. (I) Representative UCSC genome browser capture of the PLEKHG3 promoter, which is detected to have a significant co-actuation event with a nearby peak (p < 0.05). (J) Violin plot showing the proportion of co-actuated fibers versus total fibers across all significant (red) and non-significant (gray) co-actuated pairs. Significant pairs have a median co-actuation proportion of 0.33 with an interquartile range (IQR) of 0.15. Non-significant pairs have a median co-actuation proportion of 0.18 with an IQR of 0.11.

References

    1. Cutter A.R., Hayes J.J. A brief review of nucleosome structure. FEBS Lett. 2015;589:2914–2922. doi: 10.1016/j.febslet.2015.05.016. - DOI - PMC - PubMed
    1. Struhl K., Segal E. Determinants of nucleosome positioning. Nat. Struct. Mol. Biol. 2013;20:267–273. doi: 10.1038/nsmb.2506. - DOI - PMC - PubMed
    1. Michael A.K., Thomä N.H. Reading the chromatinized genome. Cell. 2021;184:3599–3611. doi: 10.1016/j.cell.2021.05.029. - DOI - PubMed
    1. Gourisankar S., Krokhotin A., Wenderski W., Crabtree G.R. Context-specific functions of chromatin remodellers in development and disease. Nat. Rev. Genet. 2024;25:340–361. doi: 10.1038/s41576-023-00666-x. - DOI - PMC - PubMed
    1. Oberbeckmann E., Oudelaar A.M. Genome organization across scales: mechanistic insights from in vitro reconstitution studies. Biochem. Soc. Trans. 2024;52:793–802. doi: 10.1042/BST20230883. - DOI - PMC - PubMed

LinkOut - more resources