. 2024 Dec 17;5(12):101838.
doi: 10.1016/j.xcrm.2024.101838. Epub 2024 Dec 3.

Genetic and microenvironmental evolution of colorectal liver metastases under chemotherapy

Affiliations

Genetic and microenvironmental evolution of colorectal liver metastases under chemotherapy

Min Shi et al. Cell Rep Med. .

Abstract

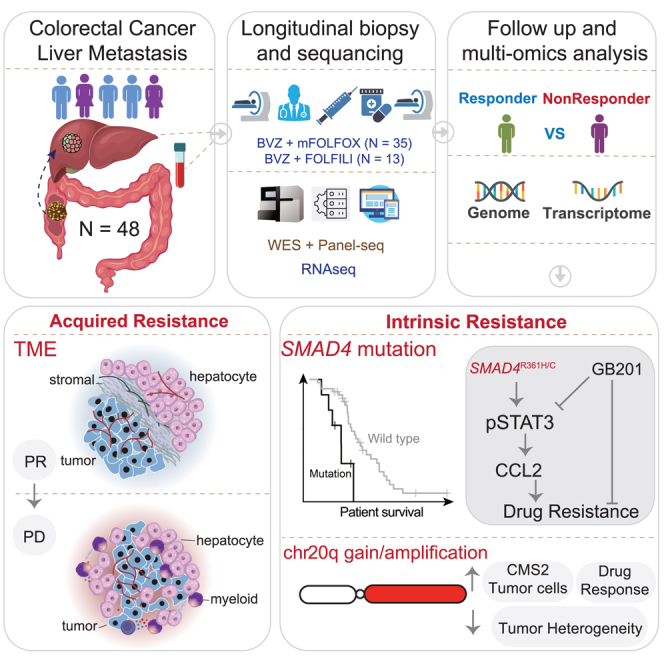
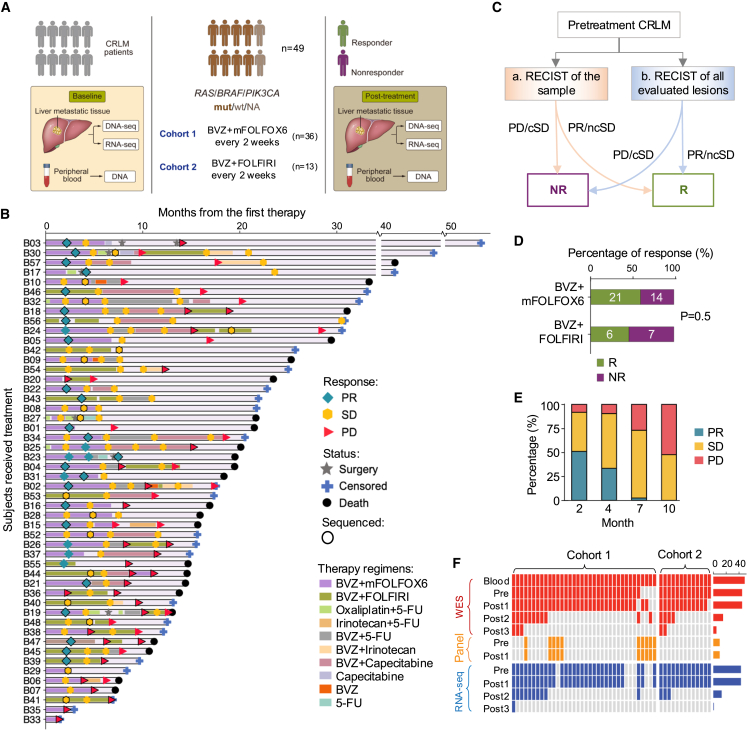
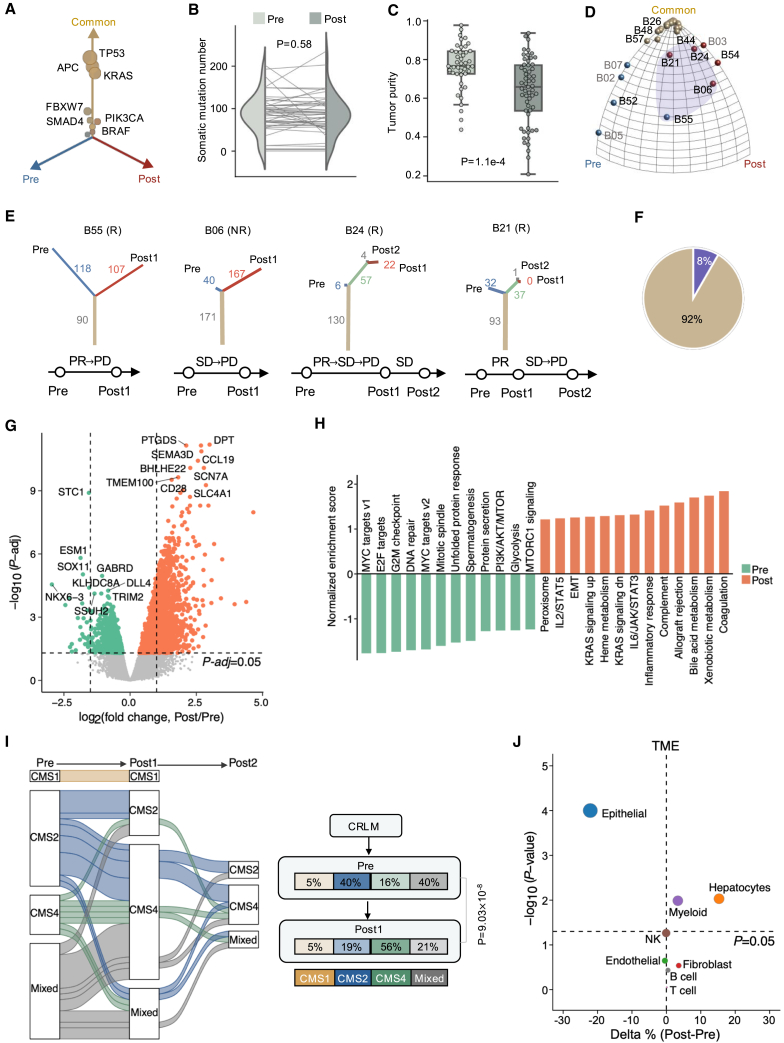
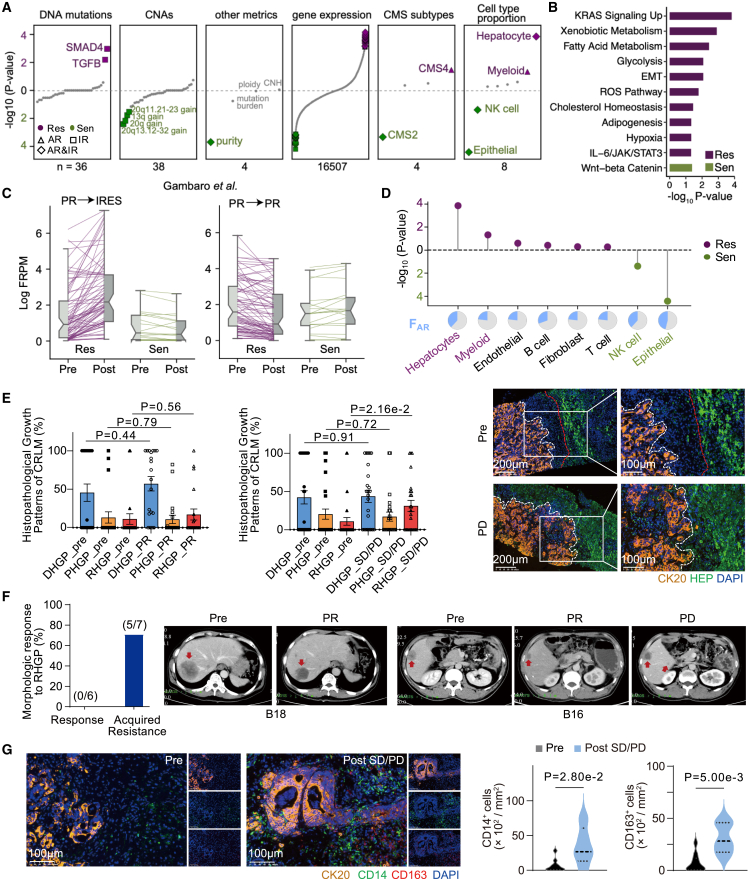
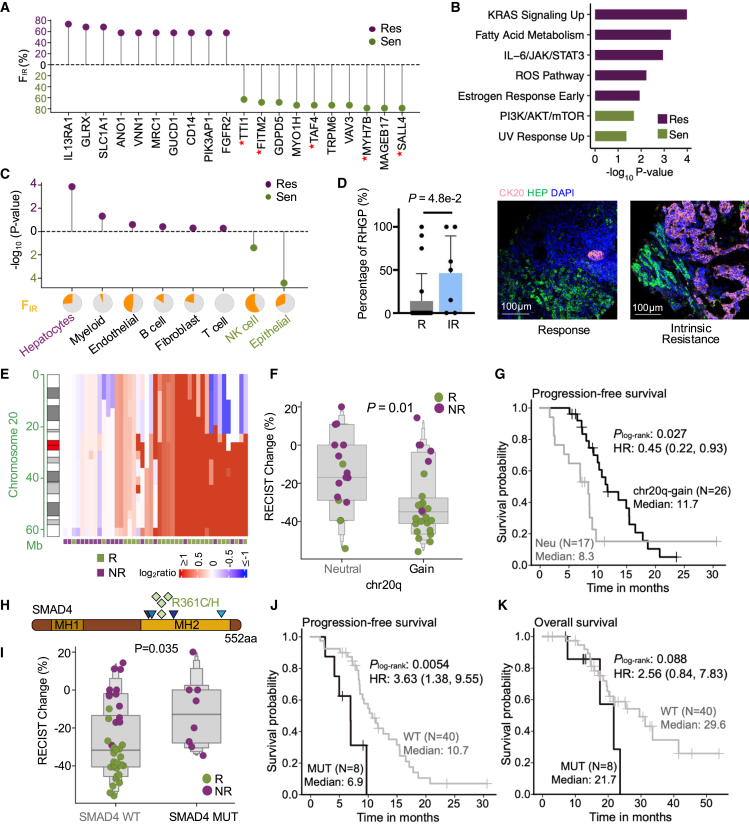
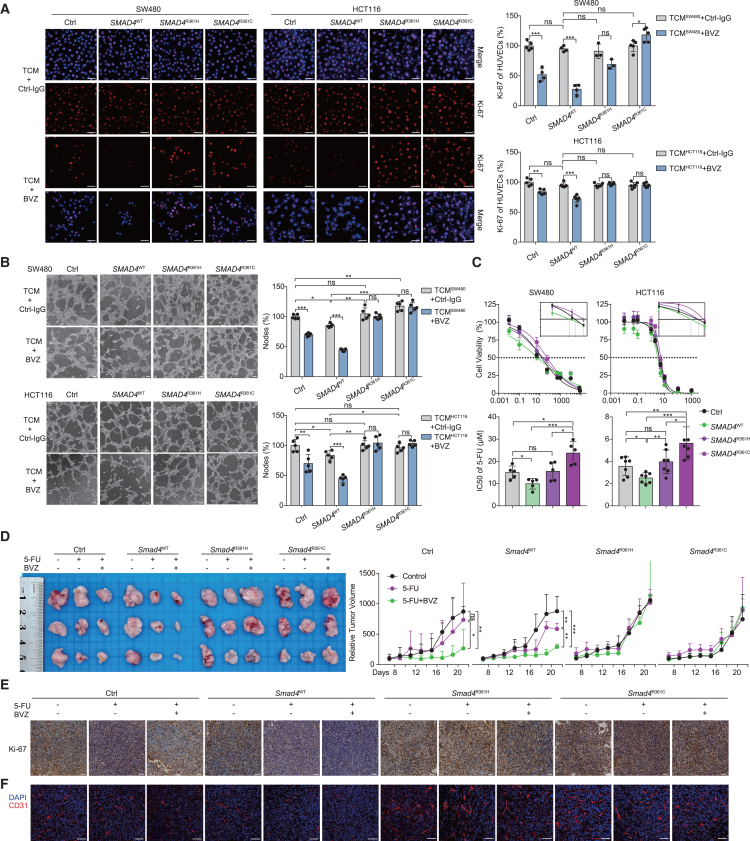
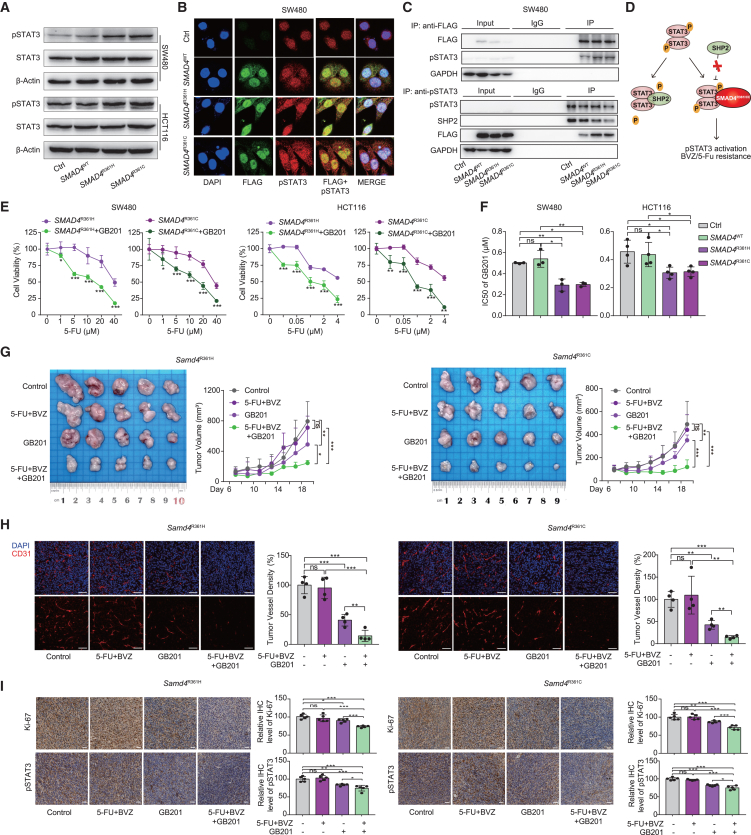
Drug resistance limits the efficacy of chemotherapy for colorectal cancer liver metastasis (CRLM). However, the evolution of CRLM during drug treatment remains poorly elucidated. Multi-omics and treatment response data from 115 samples of 49 patients with CRLM undergoing bevacizumab (BVZ)-based chemotherapy show little difference in genomic alterations in 92% of cases, while remarkable differences are observed at the transcriptomic level. By decoupling intrinsic and acquired resistance, we find that hepatocyte and myeloid cell infiltration contribute to 38.5% and 23.1% of acquired resistance, respectively. Importantly, SMAD4 mutations and chr20q copy-number gain are associated with intrinsic chemoresistance. Gene interference experiments suggest that SMAD4R361H/C mutations confer BVZ and 5-fluorouracil (5-FU) resistance through STAT3 signaling. Notably, supplementing BVZ and 5-FU with the STAT3 inhibitor GB201 restores therapeutic efficacy in SMAD4R361H/C cancer cells. Our study uncovers the evolutionary dynamics of CRLM and its microenvironment during treatment and offers strategies to overcome drug resistance.

Keywords: Bevacizumab; SMAD4 mutation; cancer genomics; chemoresistance; chr20q copy-number gain; colorectal liver metastases; tumor microenvironment.


Conflict of interest statement

Declaration of interests The authors declare no competing interests.

Figures

None
Graphical abstract
Figure 1
Figure 1
Longitudinal follow-up and multi-omics characterization of CRLM under chemotherapy (A) Schematic diagram of patient enrollment and sample collection. (B) Swimmer plot depicting time on treatment, duration of treatment, response, and survival characteristics. Each lane represents a single patient’s data. The x axis represents the duration of therapy for each patient. The key within the plot describes all symbols and color coding. Samples sequenced are encircled with black border. (C) Guideline of response classification based on RECIST 1.1. Samples with inconsistent assessment are labeled with criteria b. cSD, continuous stable disease (SD for 4 months or SD for 2 months and then PD for 2 months); ncSD, non-continuous stable disease (SD for 2 months and then PR for 2 months). R: responder; NR: non-responder. (D) Bar plot comparing differences in objective response rate between treatment arms. (E) Bar plot depicting response rate over time in our cohort. The x axis indicates the number of months after the start of treatment and y axis denotes the fraction of different response groups. (F) Summary of DNA and RNA sequencing data collected in this study. See also Figure S1.
Figure 2
Figure 2
Genomic and transcriptomic profiles of pre- and post-treatment CLRMs (A) Three-dimensional bubble plot showing the frequency of pre-treatment-private (blue; left axis), post-treatment-private (red; right axis), and common somatic mutations (yellow; upper axis). (B) Somatic mutation number of pre-treatment tumors versus post-treatment tumors. p value: two-sided paired t test. (C) Tumor purity (inferred by ESTIMATE) of pre-treatment versus post-treatment tumors. p value: two-sided Mann-Whitney U test. (D) Ternary plot of moduli space of evolutionary trees inferred by ETRIP. Each ball represents a patient, with colors indicating three clusters within moduli space. Patients with a higher fraction of shared somatic mutations between pre- and post-treatment stages are clustered near the “Common” corner, while those with a significant reduction in mutations after treatment are located near the “Pre” corner. Purple shading highlights patients with branched tumor evolution. (E) The phylogenetic tree and response history for the four patients highlighted in (D). (F) The proportion of patients with linear evolution (yellow) and branched evolution (purple). (G) Volcano plot showing DEGs in post-treatment versus pre-treatment tumor samples. (H) The enriched hallmark gene sets in baseline compared with post-treatment samples. (I) Consensus molecular subtype (CMS) transitions under treatment (left). Right: proportion change in each subtype. p value: chi-squared test. (J) Percentage changes of various cell types between post-treatment and pre-treatment samples. Relative percentage of each cell type within the bulk RNA-seq samples is inferred by the deconvolution method BayesPrism. Percentage changes (delta %) are calculated by subtracting the average cell type proportions in treated samples from those in baseline samples. The bubble size is proportional to −log10(p value). p value: two-sided Mann-Whitney U test. See also Figures S2–S5.
Figure 3
Figure 3
Genomic and transcriptomic factors associated with AR (A) Different types of features prioritized by SRFS. Each dot represents an individual feature and significant AR or IR-associated features are highlighted in green (pro-sensitive) or purple (pro-resistant). The digital number at the bottom summarizes total feature numbers for the corresponding feature type. Shapes indicate the therapeutic resistance types (triangle: AR-only, square: IR-only, diamond: AR and IR). (B) The enriched hallmark gene sets from the AR-related genes identified from (A). (C) Validation of AR-related genes in samples from an independent cohort. Re-analysis of previously reported patients demonstrated that pro-resistant genes are remarkably upregulated in P029 (left side) but downregulated in P135 (right side). Both patients were partial response (PR) when treated by oxaliplatin plus BVZ, and P029 became IRES (lesions continue to grow under therapy) when the post-treatment sample was collected, while P135 remained PR. (D) Lollipop plot showing −log10 p values of the AR relevance for different cell type proportions calculated by SRFS. Relative proportion for each cell type is inferred by BayesPrism. Pie charts (bottom) show the fraction of patients whose AR was potentially contributed by certain cellular type. (E) Comparison of three histopathological growth patterns (HGPs) of CRLMs before and after treatment. Left: proportion of HGPs by HE staining in SD/PD (n = 36) or PR (n = 20) and corresponding pre-treatment nodes. p value: unpaired t test. Right: representative immunofluorescence images of HGPs from tissues of hepatic metastases in the PD and pre-treatment stages. Scale bars, 100 and 200 μm, respectively. The white and red dashed lines indicate the tumor interface and liver-stromal interface, respectively. DHGP, desmoplastic HGP; PHGP, pushing HGP; RHGP, replacement HGP; CK20, cytokeratin 20 (cancer cell marker); HEP, hepatocyte (hepatocyte marker). (F) A histogram (left) and representative images (right) demonstrate the proportion of RHGP based on CT images in response (n = 6) and acquired resistance (n = 7) CRLM cohorts. Red arrows indicate liver metastases. (G) Representative IF images (left) and quantification (right) of monocytes (CD14+) and macrophages (CD163+) in CRLM samples from SD/PD (n = 5) and pre-treatment (n = 10). p value: two-sided Mann-Whitney U test. Scale bars, 100 μm. See also Figure S6.
Figure 4
Figure 4
Genomic and transcriptomic factors associated to IR (A) Lollipop plot showing the top 10 genes related to IR. The y axis represents the proportion of patients whose IR might be driven by the corresponding gene expression. (B) The enriched hallmark gene sets from the significant IR-related genes in Figure 3A. (C) Lollipop plot showing −log10 p values of the relevance of various cell types to IR, prioritized by SRFS. Pie charts (bottom) show the proportion of patients whose IR might be driven by the corresponding cell type. (D) Comparison of the proportion of RHGP in responders (n = 21) and patients with IR (n = 7). A bar chart (left) and representative IF images (right) illustrate the proportion of RHGP. p value: Mann-Whitney U test. Scale bars, 100 μm. (E) Chromosomal ideogram and heatmap, annotated with response status of first-line therapy, showing that chr20q-gain was frequently observed in responders. (F) Boxplot showing the association between RECIST changes and chr20q-gain. p value: two-sided Mann-Whitney U test. (G) Kaplan-Meier estimates of PFS for patients segregated by chr20q-gain. p value: log rank test. HR: hazard ratio. (H) Schematics of the protein structures showing the locations of SMAD4 mutations. MH: Mad homology. (I) The association between RECIST changes and SMAD4 mutation. p value: two-sided Mann-Whitney U test. (J and K) Kaplan-Meier estimates of PFS (J) and OS (K) for patients segregated by SMAD4mutated. p value: log rank test. See also Figures S7–S9.
Figure 5
Figure 5
SMAD4R361H/C mutations promote 5-FU and BVZ resistance in CRC (A) IF staining for Ki-67 (red) and DAPI (blue) in HUVECs incubated with tumor conditioned medium (TCM) collected from the indicated cells and BVZ (0.25 mg/mL). Representative IF images (left) and the quantification (right) of mean fluorescence intensity (MFI) are shown (n = 4–5). Scale bar, 100 μm. (B) Representative images (left) and quantification (right) of the formation of HUVECs tubules following incubation with TCM and treatment with BVZ (n = 4–5). Scale bar, 100 μm. (C) Cell viability assay of SW480 and HCT116 cells following treatment with 5-FU for 48 h, IC50 value of 5-FU (bottom) and representative curve-fitting graphs (top) are shown (n = 5, 7). (D) Stably transfected CT26 cells were subcutaneously injected in BALB/c mice. Mice were treated with PBS, 5-FU (25 mg/kg), or 5-FU (25 mg/kg, twice a week) combined with monoclonal BVZ (B20.4-1.1, 5 mg/kg, twice a week). Representative images (left) and tumor growth curve (right) are shown (n = 3). (E and F) Transplanted subcutaneous tumors with treatment are collected for immunohistochemical staining of Ki-67 (E) and immunofluorescence of vascular marker CD31 (F); blue: DAPI, red: CD31. Scale bar, 100 μm. Data are graphed as the mean ± SD; ∗, p < 0.05; ∗∗, p < 0.01; ∗∗∗, p < 0.001; ns, non-significant, p > 0.05. See also Figure S10.
Figure 6
Figure 6
GB201 can target SMAD4R361H/C mutation-mediated activation of the pSTAT3 pathway to reverse resistance in CRC (A) Western blot analysis of pSTAT3 protein in SW480 and HCT116 cells. (B) IF staining for FLAG-labeled SMAD4 protein (green), pSTAT3 protein (red), and DAPI (blue) in SW480. Scale bar, 100 μm. (C) Co-IP assay shows a complex containing pSTAT3 and FLAG-SMAD4R361H, SMAD4R361C, or SHP2 in SW480 cells. Top, FLAG antibody co-precipitating pSTAT3. Bottom, pSTAT3 antibody co-precipitating FLAG-SMAD4R361H, SMAD4R361C, or SHP2 protein. Input, protein expression in cell lysates detected by western blot. IgG, negative control. IP, expression of compound co-precipitated by pSTAT3 or FLAG antibody. (D) Schematic diagram of SMAD4R361H/C protein activating pSTAT3 through competitive binding with SHP2. (E) Cell viability of SW480 and HCT116 cells with SMAD4R361H/C exposed to 5-FU at the gradient concentrations, with or without combination with GB201. (F) IC50 value of SW480 and HCT116 cells with SMAD4R361H/C exposed to GB201 is shown (n = 3, 4). (G) Stably transfected CT26 cells with Smad4R361H/C were subcutaneously injected in BALB/c mice. Mice were treated with PBS, 5-FU (25 mg/kg, twice a week) combined with monoclonal BVZ (5 mg/kg, twice a week), GB201 (10 mg/kg, q2d), and three-drug combination for 2 weeks. Representative images (left) and tumor growth curve (right) of transplanted subcutaneous tumors of CT26 cells with Smad4R361H/C are shown (n = 5). (H) Transplanted subcutaneous tumors with treatment and Smad4R361H/C are collected for IF staining of CD31, representative IF images and the quantification are shown; blue: DAPI, red: CD31. Scale bar, 100 μm. (I) Representative immunohistochemical staining for Ki-67 and pSTAT3 and their quantification of xenograft tumor with Smad4R361H/C mutations. Scale bar, 100 μm. See also Figure S11.

References

    1. Wang R., Li J., Zhou X., Mao Y., Wang W., Gao S., Wang W., Gao Y., Chen K., Yu S., et al. Single-cell genomic and transcriptomic landscapes of primary and metastatic colorectal cancer tumors. Genome Med. 2022;14:93. - PMC - PubMed
    1. Hurwitz H., Fehrenbacher L., Novotny W., Cartwright T., Hainsworth J., Heim W., Berlin J., Baron A., Griffing S., Holmgren E., et al. Bevacizumab plus irinotecan, fluorouracil, and leucovorin for metastatic colorectal cancer. N. Engl. J. Med. 2004;350:2335–2342. - PubMed
    1. Cremolini C., Loupakis F., Antoniotti C., Lupi C., Sensi E., Lonardi S., Mezi S., Tomasello G., Ronzoni M., Zaniboni A., et al. FOLFOXIRI plus bevacizumab versus FOLFIRI plus bevacizumab as first-line treatment of patients with metastatic colorectal cancer: updated overall survival and molecular subgroup analyses of the open-label, phase 3 TRIBE study. Lancet Oncol. 2015;16:1306–1315. - PubMed
    1. Bennouna J., Sastre J., Arnold D., Österlund P., Greil R., Van Cutsem E., von Moos R., Viéitez J.M., Bouché O., Borg C., et al. Continuation of bevacizumab after first progression in metastatic colorectal cancer (ML18147): a randomised phase 3 trial. Lancet Oncol. 2013;14:29–37. - PubMed
    1. Masi G., Vivaldi C., Fornaro L., Lonardi S., Buccianti P., Sainato A., Marcucci L., Martignetti A., Luca Urso E.D., Castagna M., et al. Total neoadjuvant approach with FOLFOXIRI plus bevacizumab followed by chemoradiotherapy plus bevacizumab in locally advanced rectal cancer: the TRUST trial. Eur. J. Cancer. 2019;110:32–41. - PubMed

MeSH terms