. 2025;19(3):101435.
doi: 10.1016/j.jcmgh.2024.101435. Epub 2024 Dec 2.

Retinoblastoma-binding Protein 9 Suppresses Intestinal Inflammation and Inflammation-induced Tumorigenesis in Mice

Affiliations

Retinoblastoma-binding Protein 9 Suppresses Intestinal Inflammation and Inflammation-induced Tumorigenesis in Mice

Kensuke Hamada et al. Cell Mol Gastroenterol Hepatol. 2025.

Abstract

Background & aims: Retinoblastoma-binding protein 9 (RBBP9) was initially reported as cell cycle regulator via RB/E2F. Accumulating evidence has revealed the importance of RBBP9 in physiological and pathological states including inflammatory disease. However, the functional role of RBBP9 in ulcerative colitis (UC) and colitis-associated cancer (CAC) remains elusive.

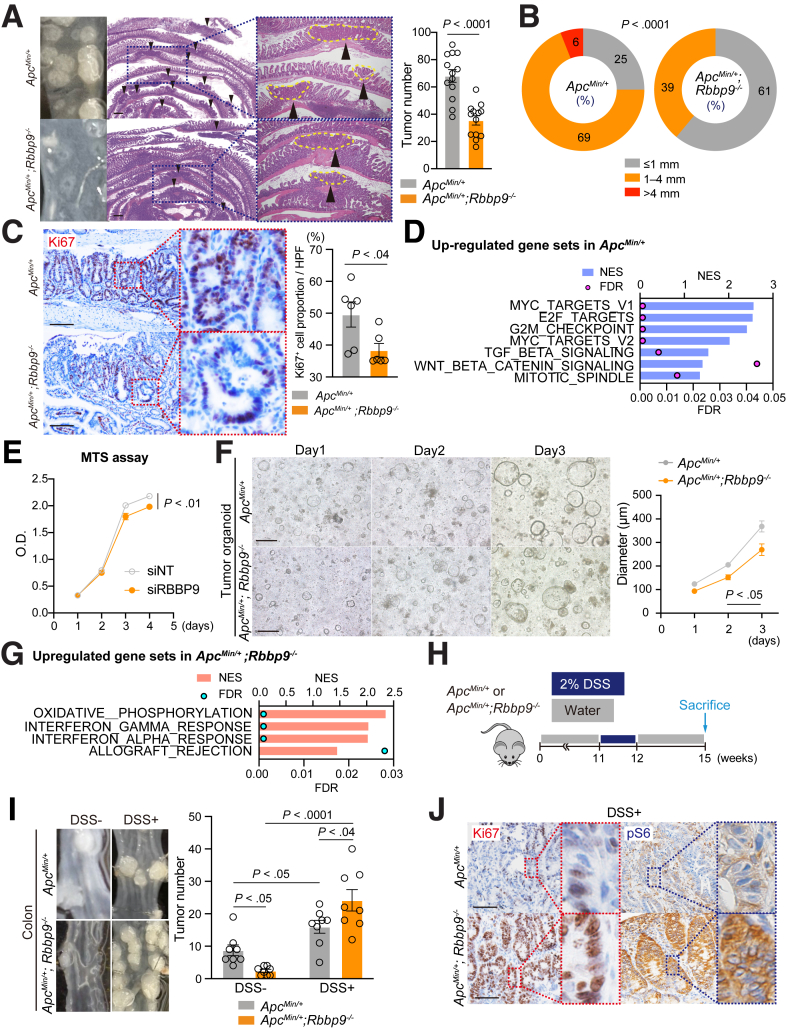
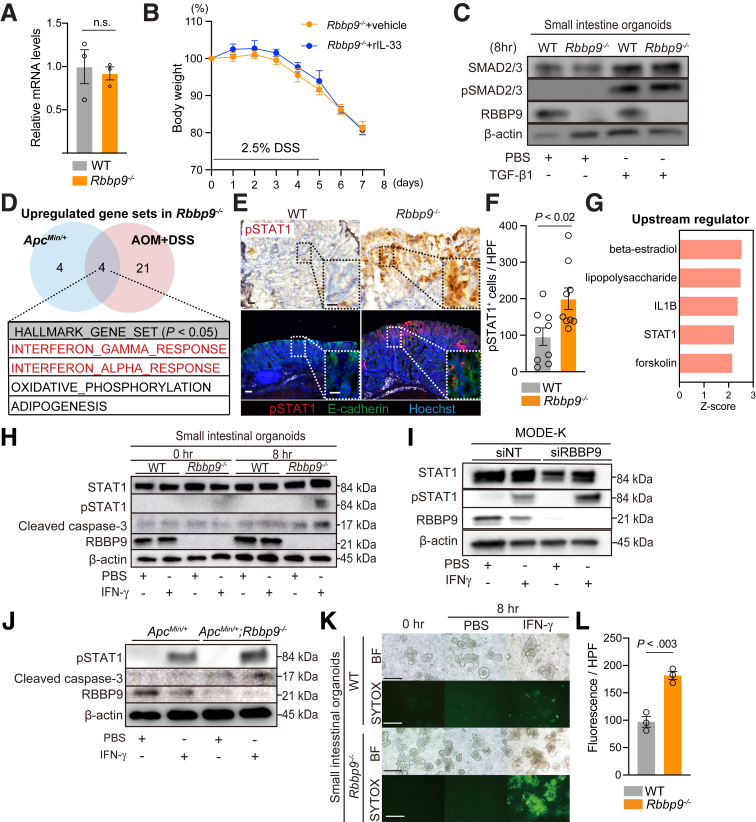
Methods: Human samples of UC and CAC were examined by immunohistochemical and bioinformatics analyses. We established dextran sodium sulfate (DSS)-induced colitis, azoxymethane (AOM)/DSS-induced CAC model, and ApcMin/+ sporadic tumor model using wild-type and Rbbp9-/- mice. RNA sequencing was analyzed to identify the phenotype alternation upon Rbbp9 deletion. In addition, genetic and pharmacological inhibition of the Janus kinase (JAK)/signal transducer and activator of transcription 1 (STAT1) pathway was performed.

Results: The expression of RBBP9 was reduced in human UC and CAC samples. The loss of RBBP9 enhanced the activation of interferon (IFN)/JAK/STAT1 signaling, resulting in susceptibility to DSS-induced colitis and AOM/DSS-induced CAC tumors by increasing epithelial cell apoptosis and immune activation. An in vitro kinase assay revealed that RBBP9 directly regulated JAK/STAT1 signaling by suppressing STAT1 phosphorylation. A positive feedback loop involving epithelial cell apoptosis, commensal microbiome invasion, and activation of submucosal immune activity was identified in Rbbp9-/- mouse intestines through enhanced JAK/STAT1 signaling in RBBP9-deficient epithelial cells and macrophages. The genetic inhibition of STAT1 or treatment with the JAK/STAT inhibitor reversed epithelial cell apoptosis and mitigated the enhanced susceptibility to DSS-induced colitis in Rbbp9-/- mice.

Conclusions: RBBP9 suppresses the intestinal inflammation by negatively regulating JAK/STAT1 signaling pathway.

Keywords: Colitis-associated Cancer; Interferon Signaling; Retinoblastoma-binding Protein 9; Ulcerative Colitis.


Figures

None
Graphical abstract
Figure 1
Figure 1
Reduced expression of RBBP9 in patient samples of active UC and CAC was observed. (A) GSEA of transcriptomic data for the indicated gene sets in active UC vs healthy patient samples in GSE38713 (n: healthy = 13, active UC = 15). (B) RNA expression levels of RBBP9 in the indicated human samples from UC datasets (n: healthy = 5, inactive = 13, active = 8 in GSE9452; healthy = 13, inactive = 8, active = 15 in GSE38713; healthy = 11, inactive = 23, active = 74 in GSE59071). (C, D) GSEA of transcriptomic data (C) and enrichment plots (D) for the indicated gene sets in GSE38712, stratified based on correlation with RBBP9 expression (n = 43). NES, normalized enrichment score; FDR, false-discovery rate. (E) Immunohistochemistry for RBBP9 (left) and quantification (right) in inactive or active UC lesions. (F) IHC for RBBP9 (left) and quantification (right) in sCRC or CAC. (G) IHC for pSTAT1 (left) and quantification (right) in inactive or active UC lesions. The positive cell proportion represents the percentage of pSTAT1-positive cells among all nuclei-positive cells. (H) IHC for RBBP9 or pSTAT1 (left), and quantification of pSTAT1-positive cells (right) in UC, stratified by RBBP9 intensity. (I) Correlation of RBBP9 with the indicated genes in GSE38713. Scale bars, 50 μm. Mean ± SEM.
Figure 2
Figure 2
Rbbp9-/-mice exhibit susceptibility to DSS-induced colitis. (A) Schematic protocol of the DSS-induced colitis in WT and Rbbp9-/- mice. (B–E) Percentage of change in body weight (B), representative images (C), and quantification (D) of colon length upon sacrifice, H&E staining and pathological scores (E) of WT and WT and Rbbp9-/- colon sections (n = 8) in (A). Pathological score includes assessment of inflammation severity, crypt damage, and inflammatory extent. Scale bars, 50 μm. (F–H) Immunostaining and quantification of CD45 (F), CD11b (G), and CD8a (H) of WT and Rbbp9-/- colon sections (n = 5) in (A). The positive cell proportion represents the percentage of immunostaining-positive cells among all nuclei-positive cells. Scale bars, 50 μm. (I) Relative mRNA expression levels of the indicated genes by qRT-PCR. Mean ± SEM.
Figure 3
Figure 3
Loss of RBBP9 enhances inflammation-induced tumorigenesis. (A) Schematic protocol of the AOM/DSS-induced colorectal tumor model in WT and Rbbp9-/- mice. (B) Total and size-dependent classified numbers of colon tumors in (A; n = 9). (C) Representative H&E staining (left) and proportion of submucosal invasion of tumors (right) of colonic sections in (A). Yellow dashed lines denote colon tumors. Black arrowheads denote invasive areas of the tumors. Scale bars, 100 μm. (D) Immunostaining of Ki67 and its quantification in AOM/DSS-induced tumors (n = 7). The positive cell proportion represents the percentage of immunostaining-positive cells among all nuclei-positive cells. Scale bars, 50 μm. (E) Co-immunostaining of cleaved caspase-3 and E-cadherin and quantification in AOM/DSS-induced tumors (n = 7). Scale bars, 50 μm. (F, G) Immunostaining of CD45 (F) and CD11b (G). Scale bars, 50 μm.
Figure 4
Figure 4
Inflammation-mediated proliferation pathways are upregulated in tumors of AOM/DSS-treated Rbbp9-/-mice. (A–C) GSEA of RNA-seq data from AOM/DSS-induced tumors in WT and Rbbp9-/- colons (n = 3 for each group). (A) GSEA plots in Rbbp9-/- vs WT colon tumor. FDR, False discovery rate; NES, normalized enrichment score. Upregulated gene sets in Rbbp9-/- (B) and in WT tumors (C). FDR, False-discovery rate. (D–G) Representative immunostaining of pS6 (D), p4EBP1 (E), pSTAT1 (F), and β-catenin (G) in AOM/DSS-induced tumors (n = 3). Scale bars, 50 μm. Mean ± SEM.
Figure 5
Figure 5
Enhanced inflammation due to loss of RBBP9 overrides the reduced tumor development in the ApcMin/+mouse model. (A, B) Macroscopic pictures, H&E staining, and total numbers of small intestinal tumors (A), and tumor size distribution (B) in ApcMin/+ and ApcMin/+; Rbbp9-/- mice (n = 14). Scale bars, 500 μm. (C) Immunostaining and quantification of Ki67 in ApcMin/+ and ApcMin/+; Rbbp9-/- mouse tumors (n = 6). The positive cell proportion represents the percentage of immunostaining-positive cells among all nuclei-positive cells. Scale bars, 100 μm. (D) GSEA of RNA-seq data from ApcMin/+ and ApcMin/+; Rbbp9-/- mouse tumors (n = 3). Upregulated gene sets in ApcMin/+. FDR, False-discovery rate. (E) MTS assay measuring the growth of MC38 cells treated with siNT or siRBBP9 over the indicated days (n = 5 for each group). (F) Representative images of tumor organoids derived from ApcMin/+ and ApcMin/+; Rbbp9-/- small intestines on days 1, 2, and 3. (left, n = 9 for each group) and diameter of organoids in (right; n = 9 for each group). Scale bars, 200 μm. (G) Upregulated gene sets in ApcMin/+;Rbbp9-/- tumors. FDR, False-discovery rate. (H) Schematic protocol of the DSS-induced colitis experiment in ApcMin/+ and ApcMin/+; Rbbp9-/- mice. (I, J) Total numbers (I; n = 8) and immunostaining for the specified antibodies (J) of colorectal tumors in ApcMin/+ and ApcMin/+; Rbbp9-/- treated with or without DSS. Scale bars, 50 μm. Mean ± SEM.
Figure 6
Figure 6
Loss of RBBP9 enhanced IFN-γ-induced apoptosis in intestinal epithelium. (A) Relative mRNA levels of Il33 analyzed using qRT-PCR (n = 3 for each group). n.s., Not significant. (B) Percentage of change in body weight of Rbbp9-/- mice treated either with vehicle or recombinant IL33 (n = 6 for each group). (C) Immunoblotting for the indicated proteins in WT and Rbbp9-/- intestinal organoids treated with either PBS or TGF-β1 (10 ng/mL) for 8 hours. (D) Common gene sets upregulated in ApcMin/+; Rbbp9-/- tumors (vs ApcMin/+ tumors); and in AOM/DSS-treated Rbbp9-/- tumors (vs WT tumors) among the HALLMARK sets in GSEA. (E, F) Immunostaining (E, top) and quantification (F) of pSTAT1 and co-immunostaining of pSTAT1 and E-cadherin (E, bottom) in AOM/DSS-induced tumors in WT and Rbbp9-/- mice. Scale bars, 50 μm (E, top), 100 μm (E, bottom). (G) The “Upstream Regulator” analysis in Ingenuity Pathway Analysis (IPA) on RNA-seq data of AOM/DSS-induced tumors. The absolute z-score, representing the degree of activation, is expressed among the total genes assigned to the activated upstream regulator by IPA. (H) Immunoblotting for the indicated proteins in WT and Rbbp9-/- intestinal organoids treated with PBS or IFN-γ (10 ng/mL). (I) Immunoblotting for the indicated proteins in siNT- or siRBBP9-treated MODE-K cells stimulated with PBS or IFN-γ (10 ng/mL) for 4 hours. (J) Immunoblotting for the indicated proteins in ApcMin/+ and ApcMin/+; Rbbp9-/- tumor organoids stimulated with PBS or IFN-γ (10 ng/mL) for 8 hours. (K, L) Representative images of bright field microscopy (BF) and SYTOX Green staining (K) and quantification (L) of WT and Rbbp9-/- organoids treated with PBS or IFN-γ (10 ng/mL) (n = 3). Scale bars, 200 μm.
Figure 7
Figure 7
RBBP9 interferes with the IFN-γ-induced JAK/STAT1 pathway by inhibiting STAT1 phosphorylation. (A) Quantitative serum FITC-dextran in DSS-treated WT and Rbbp9-/- mice. (B) Schematic protocol of the DSS-induced colitis pretreated with antibiotic (Abx) cocktails in WT and Rbbp9-/- mice. (C, D) Percentage of change in body weight (C), images and quantification (D) of colon length (n = 9) upon sacrifice in (B). (E) Immunoblotting for the indicated proteins in BMDMs from WT and Rbbp9-/- mice, stimulated with PBS or IFN-γ (10 ng/mL) for 2 hours. (F) In vitro kinase assay of recombinant STAT1 by recombinant JAK1 with or without the presence of recombinant RBBP9, followed by immunoblotting for the indicated proteins. (G) Schematics illustrating that RBBP9 regulates the IFN/JAK/STAT1 pathway by inhibiting STAT1 phosphorylation. (H, I) Schematics depicting MODE-K cells stimulated with either PBS or IFN-γ (10 ng/mL) for 4 hours, with or without the presence of emetine (H). Immunoblotting for the indicated proteins (I). Mean ± SEM.
Figure 8
Figure 8
Simultaneous loss of STAT1 alleviates epithelial cell apoptosis and mitigates colitis exacerbation in RBBP9-/-mice. (A, B) Representative images (A) of bright field microscopy (BF) and SYTOX green staining and quantification (B) of intestinal organoids derived from mice with the indicated genotypes, treated with either PBS or IFN-γ (10 ng/mL) for 8 hours (n = 3). Scale bars, 200 μm. (C) Immunoblotting for the indicated proteins in intestinal organoids derived from WT, Rbbp9-/-, Stat1-/-, and Rbbp9-/-;Stat1-/- mice, treated with PBS or IFN-γ (10 ng/mL) for 8 hours. (D) Schematic protocol of DSS-induced colitis. (E–I) Percentage of change in body weight (E), representative images (F), and quantification (G) of colon length upon sacrifice, H&E staining and pathological scores (H) of mouse colon sections from the indicated genotypes (n = 6 for each group) in (D). Pathological score includes assessment of inflammation severity, crypt damage, and inflammatory extent. Scale bars, 50 μm. Mean ± SEM. (I) Immunostaining of CD45 in colon sections from mice with the indicated genotypes subjected to a DSS-induced colitis model, and quantification (n = 4 for each group). Scale bars, 50 μm.
Figure 9
Figure 9
Upadacitinib ameliorates enhanced inflammation in RBBP9-/-mice in the DSS colitis model. (A) Immunoblotting for the indicated antibodies in WT and Rbbp9-/- intestinal organoids stimulated with PBS or IFN-γ (10 ng/mL) in the presence or absence of UPA (50 nM) for 8 hours. (B) Representative images of bright field microscopy (BF) and SYTOX green staining of WT and Rbbp9-/- intestinal organoids treated with IFN-γ (10 ng/mL) in the presence or absence of UPA (50 nM) for 8 hours. Scale bars, 200 μm. (C) Schematic protocol of DSS-induced colitis with UPA treatment in WT and Rbbp9-/- mice. (D–H) Percentage of change in body weight (D), Kaplan-Meier survival curve (E), images and quantification (F) of colon length upon sacrifice, H&E staining and pathological scores (G) of colon sections from the indicated genotypes (n = 8) in (C). Pathological score includes assessment of inflammation severity, crypt damage, and inflammatory extent. Scale bars, 50 μm. (H) Immunostaining of CD45 in colon sections from WT and Rbbp9-/- mice treated with either vehicle or UPA (20 mg/kg/day) in the DSS-induced colitis model. Scale bars, 50 μm.

References

    1. Jäger S., Stange E.F., Wehkamp J. Inflammatory bowel disease: an impaired barrier disease. Langenbecks Arch Surg. 2013;398:1–12. - PubMed
    1. Peterson L.W., Artis D. Intestinal epithelial cells: regulators of barrier function and immune homeostasis. Nat Rev Immunol. 2014;14:141–153. - PubMed
    1. Nakanishi Y., Reina-Campos M., Nakanishi N., et al. Control of paneth cell fate, intestinal inflammation, and tumorigenesis by PKCλ/ι. Cell Rep. 2016;16:3297–3310. - PMC - PubMed
    1. Matsumoto Y., Nakanishi Y., Yoshioka T., et al. Epithelial EP4 plays an essential role in maintaining homeostasis in colon. Sci Rep. 2019;9 - PMC - PubMed
    1. Linares J.F., Zhang X., Martinez-Ordoñez A., et al. PKCλ/ι inhibition activates an ULK2-mediated interferon response to repress tumorigenesis. Mol Cell. 2021;81:4509–4526.e10. - PMC - PubMed

MeSH terms