. 2025 Jan 26:565:440-456.
doi: 10.1016/j.neuroscience.2024.11.076. Epub 2024 Dec 2.

Anesthesia alters complexity of spontaneous and stimulus-related neuronal firing patterns in rat visual cortex

Affiliations

Anesthesia alters complexity of spontaneous and stimulus-related neuronal firing patterns in rat visual cortex

Duan Li et al. Neuroscience. .

Abstract

Complexity of neuronal firing patterns may serve as an indicator of sensory information processing across different states of consciousness. Recent studies have shown that spontaneous changes in brain states can occur during general anesthesia, which may influence neuronal complexity and the state of consciousness. In this study, we investigated how the firing patterns of cortical neurons, both at rest and during visual stimulation, are affected by spontaneously changing brain states under varying levels of anesthesia. Extracellular unit activity was measured in the primary visual cortex of unrestrained rats as the inhaled concentration of desflurane was incrementally reduced to 6%, 4%, 2%, and 0%. Using dimensionality reduction and density-based clustering on individual unit activities, we identified five distinct population states, which underwent dynamic transitions independent of the anesthetic level during both resting and stimulus conditions. One population state that occurred mainly in deep anesthesia exhibited a paradoxically increased number of active neurons and asynchronous spiking, suggesting a spontaneous reversal towards an awake-like condition. However, this was contradicted by the observation of low neuronal complexity in both spontaneous and stimulus-related spike activity, which more closely aligns with unconsciousness. Our findings reveal that transient neuronal states with distinct spiking patterns can emerge in visual cortex at constant anesthetic concentrations. The reduced complexity in states associated with deep anesthesia likely indicates a disruption of conscious sensory information processing.

Keywords: Anesthesia; Consciousness; Neuronal complexity; Spike dynamics; Visual cortex.


Conflict of interest statement

Declaration of Competing Interest The authors declare that they have no known competing financial interests or personal relationships that could have appeared to influence the work reported in this paper.

Figures

Figure 1.
Figure 1.
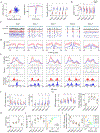
Schematic of unit recording, anesthetic protocol, and analysis pipeline. A. Multielectrode array (MEA) was implanted in the monocular region of the rat primary visual cortex for extracellular recording. A red light-emitting diode (LED) for visual flash stimulation was implanted extracranially behind the contralateral eye. B. Desflurane was administered at steady-state concentration and decreased in a stepwise manner. After a 15-min equilibration period, spontaneous (blue bars) and visual flash-induced spike activity (red bars) at each concentration of desflurane were recorded. C. Distinct population states were first identified by applying principal component analysis (PCA) to spontaneous spike activity, followed by a density-based clustering (DBC) with the mean value and permutation entropy (PE) of the retained principal components (PCs) as classification features. Based on the Gaussian mixture model (GMM) of spontaneous population states, a state membership was assigned to the pre-stimulus spike data of each trial. Spontaneous and stimulus-related spike patterns of individual neurons, neuronal ensembles (detected via functional clustering algorithm [FCA]), and neuronal complexity (assessed by Spontaneous Complexity Index [SCI] for spontaneous and Perturbational Complexity Index [PCI] for stimulus-related spike activity) were characterized across spontaneous and pre-stimulus population states respectively.
Figure 2.
Figure 2.
Classification of spontaneous population states. A. For a representative rat, five population states (a) were identified by applying principal component analysis (PCA) to cortical unit activity (b, c), followed by a density-based clustering based on the mean value and permutation entropy (PE) (d) of the retained principal components (PCs). B. Scatterplots of the population features in PC1 mean activity vs. PE and PC2 mean activity vs. PE in six rats. Note that state 5 was absent in rat 3. C. Occurrence rate of each population state at each concentration of desflurane from pooled data of all 6 rats. States do not strictly map on anesthetic concentrations. D. Summary of state-dependent population features from all rats. Box plots indicate median and the interquartile interval (IQR), whiskers extend to the most extreme values. Values from each rat are indicated by dots. *: p<0.0125 relative to state 1 (linear mixed models).
Figure 3.
Figure 3.
Spontaneous spiking patterns of individual neurons across the five population states. A. Classification of units into putative inhibitory (narrow-spiking) and excitatory (wide-spiking) neurons based on the trough-to-peak duration of their spike waveform (Left). Trough-to-peak times are plotted against spike half-width measured as the width at the half of the most negative value (Middle). Mean and 95% confidence interval (CI) of the spike trough-to-peak time of narrow- and wide-spiking neurons across five population states (Right). #: p<0.01 narrow vs. wide. B. Average spike rate of narrow- and wide-spiking neurons in different population states. The red and blue shaded areas represent the distribution of values, thick and thin horizontal lines indicate the median and the IQR, respectively, of the spike rate. *: p<0.0125 relative to state 1, #: same as in panel A, right. C. Five seconds of local field potentials (LFPs), neuron population activity, and individual spike trains in five population states from one rat as an example. D. Mean and 95% CI of normalized autocorrelogram (ACG) of all active neurons from all rats. E. Mean and 95% CI of the frequency distribution of interspike interval (ISI) across all active neurons from all rats (Top). Local peaks of the distribution are reflected by neuron spike times (Middle). The gray shaded areas indicate neurons from a rat without state 5. In each bin of the ISI distribution, the ratio between the number of neurons that exhibited a peak and the total number of active neurons in the state (Bottom). F. State-dependent changes in ACG peak time and peak ratio. G. State-dependent changes in the bimodality coefficients of individual units and the number of neurons with multimodal ISI. Data are from all rats. G-J. The state-dependent changes in the rightmost ISI peak (H) correlated with the suppression ratio (SR) of population activity (I) and the SR-corrected median frequency in LFP ([1-SR%] × median frequency) (J) (Spearman’s rank correlation). In F-G, *: p<0.0125 relative to state 1, #: p<0.01 narrow vs. wide. All tests are linear mixed models. In D-H, units with mean spike rate <1 Hz were excluded, leaving n=33, 29, 22, 18, and 15 narrow-spiking neurons, n=106, 98, 77, 36, and 58 wide-spiking neurons in states 1–5, respectively.
Figure 4.
Figure 4.
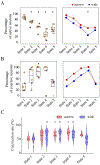
Coactivation of neurons during spontaneous activity in five population states. A. Percentage of active neurons among all neurons across the rats (left) and the same for narrow- and wide-spiking neurons (right). *: p<0.0125 relative to state 1, #: p<0.01 narrow vs. wide. B. Percentage of coactive neurons among active neurons across the rats (left) and the same for narrow- and wide-spiking neurons (right). *: same as in panel A. C. Coactivation rate of narrow- and wide-spiking neurons as a function of state. *: p<0.0125 relative to state 1. In right panel of B and C, no significant difference between narrow- and wide-spiking neurons was detected at p=0.01 in each state. All tests are linear mixed models except Fisher’s exact test in panels A and B, right.
Figure 5.
Figure 5.
Neuronal complexity of spontaneous spiking patterns across the five population states. A. An example of 1-s binned spike trains from individual neurons in each state. The neurons were sorted by their mean firing rate in each state. B-E. State-dependent changes in Lempel-Ziv Complexity (LZC) (B), the probability of spiking (C), entropy (D), and the derived Spontaneous Complexity Index (SCI) (E). *: p<0.0125 relative to state 1 (linear mixed models).
Figure 6.
Figure 6.
Identification of pre-stimulus states. A. Scatterplots of the pre-stimulus features in PC1 mean activity - PE and PC2 mean activity - PE spaces for each of six rats. For visualization, the gray shaded areas represent the 80% confidence regions of the Gaussian mixture model (GMM) fitted from the spontaneous population states. Note that state 4 was absent in rat 3 and rat 4, and state 5 was absent in rat 2 and rat 6. B. For each rat, the cityblock distance between the center of each spontaneous state and each pre-stimulus state in 4-D feature space (PC1 mean activity, PC1 PE, PC2 mean activity, PC2 PE). Lower values indicate shorter distance, and the states are closer to each other. C. Occurrence rate of each population state in each concentration of desflurane from pooled data of all 6 rats. Besides the five states, the trials where all the neurons were silent during pre-stimulus −500 to 0 ms were further separated and defined as suppression state. D. State-dependent changes of population features across all the rats. *: p<0.01 relative to state 1 (linear mixed models).
Figure 7.
Figure 7.
Stimulus-related responses of individual neurons across the six pre-stimulus states. A. Mean and 95% CI of average stimulus-related response across all narrow- or wide-spiking neurons from all rats. For each neuron in each state, the response was obtained by averaging individual responses across all trials. Light flash is delivered at 0 ms. Plotted values represent the changes in mean spike rate relative to pre-stimulus −1000 to 0 ms. B. local peaks detected for all active neurons from all rats. The gray shaded areas indicate neurons from the rats without state 4 or state 5. C. Among all active neurons, the percentage of neurons which exhibited a peak in post-stimulus response within each time bin during 0 to 250 ms. D. Length of post-stimulus periods during which the average neuronal response was significant. E. Mean probability of neurons responding to flash stimulation in individual trials during periods where the average neuronal response was significant. F. Trial-to-trial variability in response probabilities in individual trials. G, H. Magnitude of stimulus-related response during post-stimulus 0 to 250 ms (G) and 250 to 1000 ms (H). I. Peak latency of stimulus-evoked response of all active neurons. J, K. Percentage of neurons that showed significant response during 0 to 250 ms (J) and 250 to 1000 ms (K) across all rats (left) and the same for the narrow- and wide-spiking neurons (right). L. Among all active neurons, the percentage of neurons that showed more than one peak in post-stimulus response during 0 to 250 ms, across all rats (left) and for the narrow- and wide-spiking neurons (right). In D-L, *: p<0.01 relative to state 1, #: p<0.0083 narrow vs wide. All tests are linear mixed models except Fisher’s exact test in panel J-L, right. In B, C, I, and L, units with mean spike rate<1 Hz during post-stimulus 0 to 1000 ms were excluded, with n=37, 36, 34, 23, 25, and 37 narrow-spiking neurons, n=118, 110, 98, 59, 73 and 149 wide-spiking neurons remained for states 1–5 and suppression state.
Figure 8.
Figure 8.
Stimulus-related neuronal coactivation across the six pre-stimulus states. A. Percentage of neurons that preserved versus switched their spontaneous spiking mode (inactive, independent spiking, or coactive) during pre-stimulus periods across the rats. #: p<0.01 persistence vs. switch. B. Comparison of neuronal spiking during spontaneous and pre-stimulus periods. Each element in the matrix represents the mean percentage of neurons that were in a certain mode during spontaneous spiking and in another mode during pre-stimulus period across the rats. The elements on the diagonal line corresponded to the neurons that preserved their spontaneous spiking mode, while the other elements corresponded to the neurons that switched their spontaneous spiking mode. *: relative to 1/9 (FDR-adjusted p < 0.05, paired sample t-test) C. Percentage of neurons that preserved versus switched their pre-stimulus spiking mode during post-stimulus periods across the rats. #: p<0.0083 persistence vs. switch. D. Comparison of neuronal spiking during pre- and post-stimulus periods. *: same as in panel B. E. Percentage of neurons that were active across the rats for the pre- and post-stimulus data. F. Among the active neurons, percentage of coactive neurons across the rats. G. State-dependent changes in coactivation rate across neurons. In E-G, *: p<0.01 relative to state 1, # p<0.0083 pre- vs. post-stimulus. All tests are linear mixed models except in panel B and D.
Figure 9.
Figure 9.
Neuronal complexity of stimulus-related spike patterns across the six pre-stimulus population states. A. For an example neuron in each state, the post-stimulus changes in mean spike rate (averaged over all trials, time plot in blue) were compared with the mean spike rate during pre-stimulus baseline in −1000 to 0 ms (red dashed line), resulting in a binary sequence, with ‘1’ indicating increased spike rate (time points in black) and 0 otherwise. An inactive unit with mean spike rate<1 Hz during post-stimulus 0 to 1000 ms corresponds to a sequence of all ‘0’s. B. The binarized post-stimulus spike patterns of all neurons from an example rat. The neurons were sorted based on their mean firing rate in each state, where the neuron shown in panel A was indicated by a red arrow. C. State-dependent changes in LZC, the percentage of time with increased spike rate and its associated entropy, and the PCI assessed during post-stimulus 0 to 1000 ms. D, E. State-dependent changes in LZC and PCI assessed during post-stimulus 0 to 250 ms (C) and 250 to 1000 ms (D). In B-D, *: p<0.01 relative to state 1 (linear mixed models).

Similar articles

References

    1. Aasebo IEJ, Lepperod ME, Stavrinou M, Nokkevangen S, Einevoll G, Hafting T, Fyhn M (2017), Temporal Processing in the Visual Cortex of the Awake and Anesthetized Rat. eNeuro 4. - PMC - PubMed
    1. Abasolo D, Simons S, Morgado da Silva R, Tononi G, Vyazovskiy VV (2015), Lempel-Ziv complexity of cortical activity during sleep and waking in rats. J Neurophysiol 113:2742–2752. - PMC - PubMed
    1. Alkire MT, Hudetz AG, Tononi G (2008), Consciousness and anesthesia. Science 322:876–880. - PMC - PubMed
    1. Altwegg-Boussac T, Schramm AE, Ballestero J, Grosselin F, Chavez M, Lecas S, Baulac M, Naccache L, et al. (2017), Cortical neurons and networks are dormant but fully responsive during isoelectric brain state. Brain 140:2381–2398. - PubMed
    1. Arena A, Comolatti R, Thon S, Casali AG, Storm JF (2021), General Anesthesia Disrupts Complex Cortical Dynamics in Response to Intracranial Electrical Stimulation in Rats. eNeuro 8. - PMC - PubMed

LinkOut - more resources