. 2024 Dec 4;12(12):e009768.
doi: 10.1136/jitc-2024-009768.

Mitochondrial metabolic reprogramming of macrophages and T cells enhances CD47 antibody-engineered oncolytic virus antitumor immunity

Affiliations

Mitochondrial metabolic reprogramming of macrophages and T cells enhances CD47 antibody-engineered oncolytic virus antitumor immunity

Jing Zhao et al. J Immunother Cancer. .

Abstract

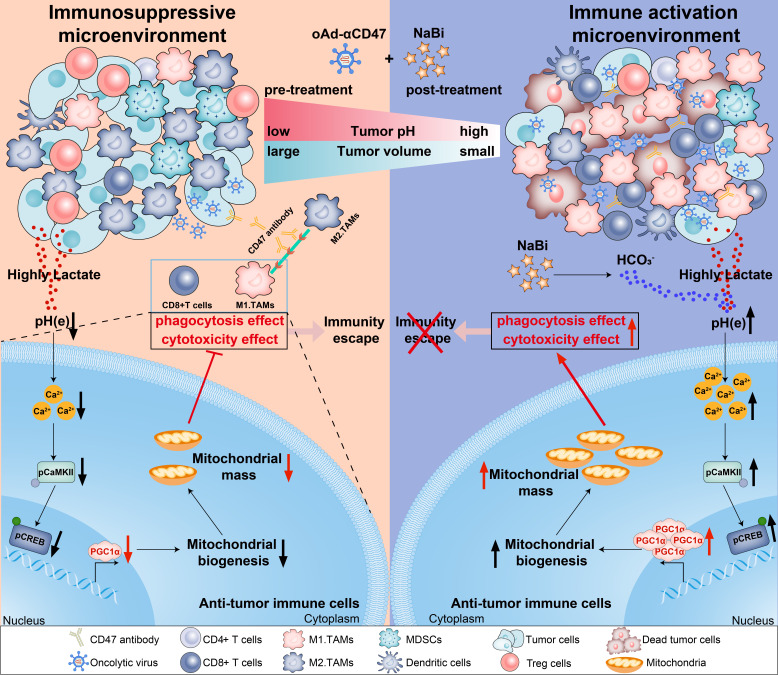
Background: Although immunotherapy can reinvigorate immune cells to clear tumors, the response rates are poor in some patients. Here, CD47 antibody-engineered oncolytic viruses (oAd-αCD47) were employed to lyse tumors and activate immunity. The oAd-αCD47 induced comprehensive remodeling of the tumor microenvironment (TME). However, whether the acidic TME affects the antitumor immunotherapeutic effects of oncolytic viruses-αCD47 has not been clarified.

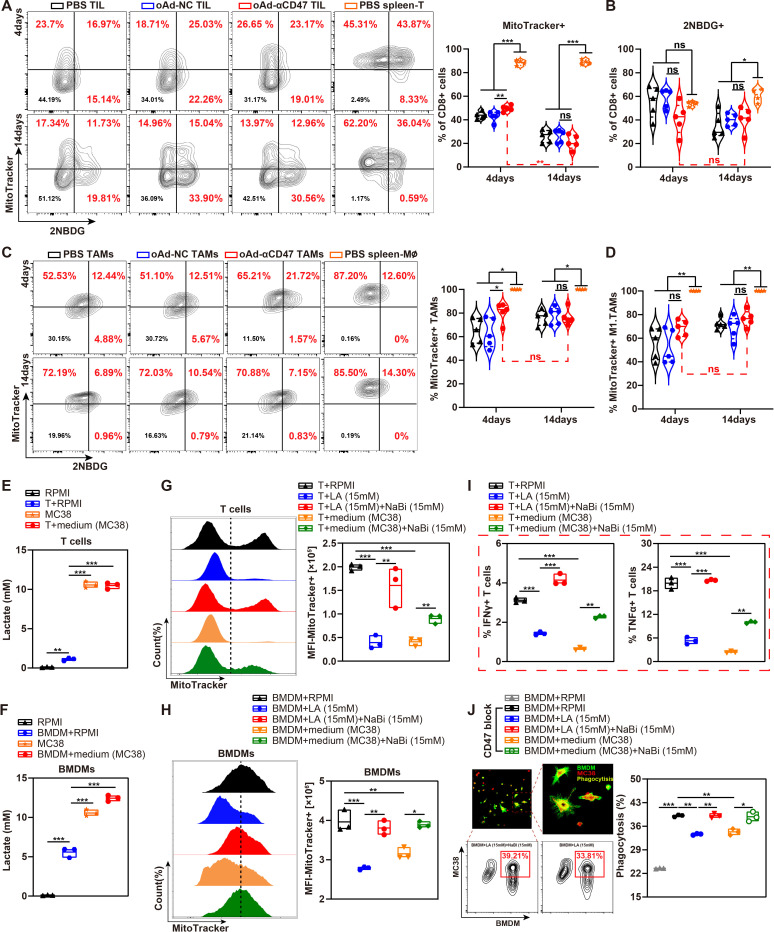
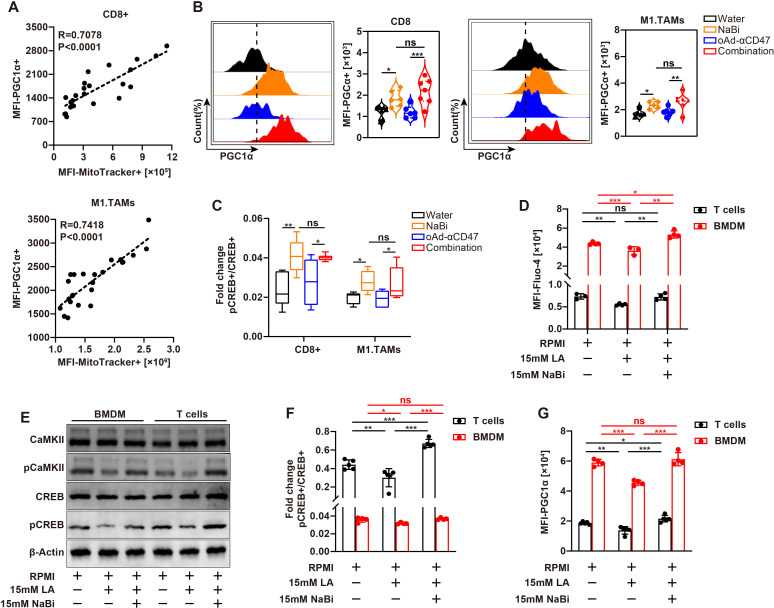
Methods: To assess the impact of oAd-αCD47 treatment on the TME, we employed multicolor flow cytometry. Glucose uptake was quantified using 2NBDG, while mitochondrial content was evaluated with MitoTracker FM dye. pH imaging of tumors was performed using the pH-sensitive fluorophore SNARF-4F. Moreover, changes in the calmodulin-dependent protein kinase II (CaMKII)/cyclic AMP activates-responsive element-binding proteins (CREB) and peroxisome proliferator-activated receptor gamma coactivator-1α (PGC1α) signaling pathway were confirmed through western blotting and flow cytometry.

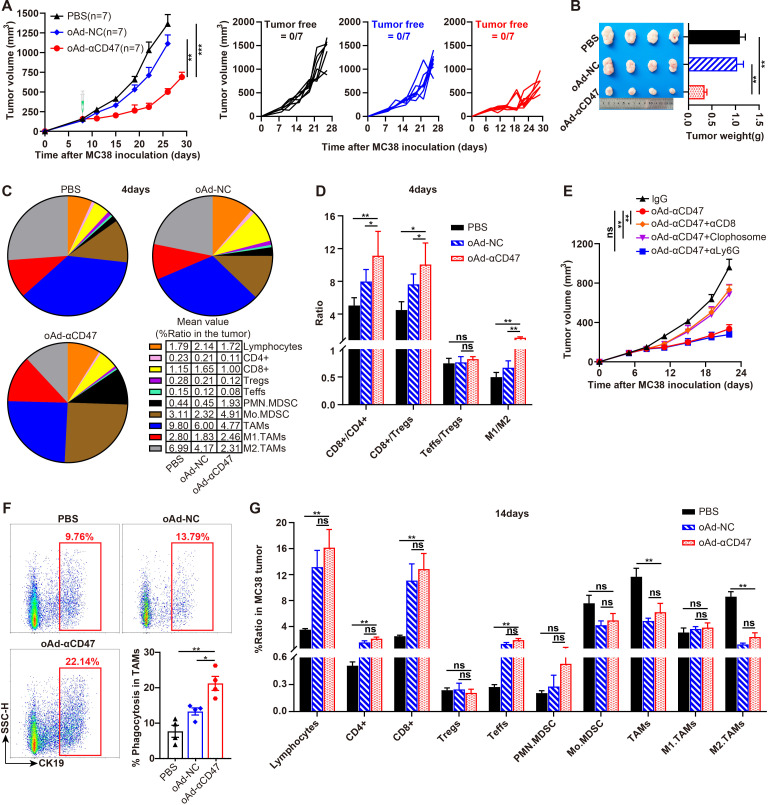
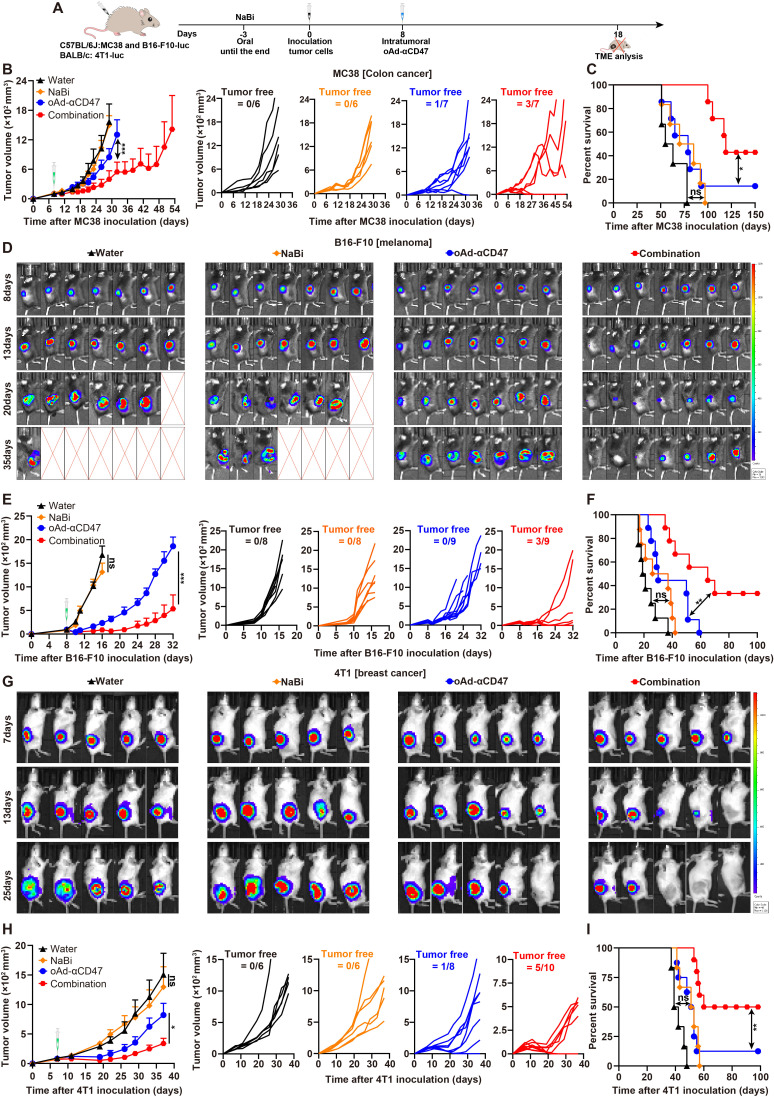
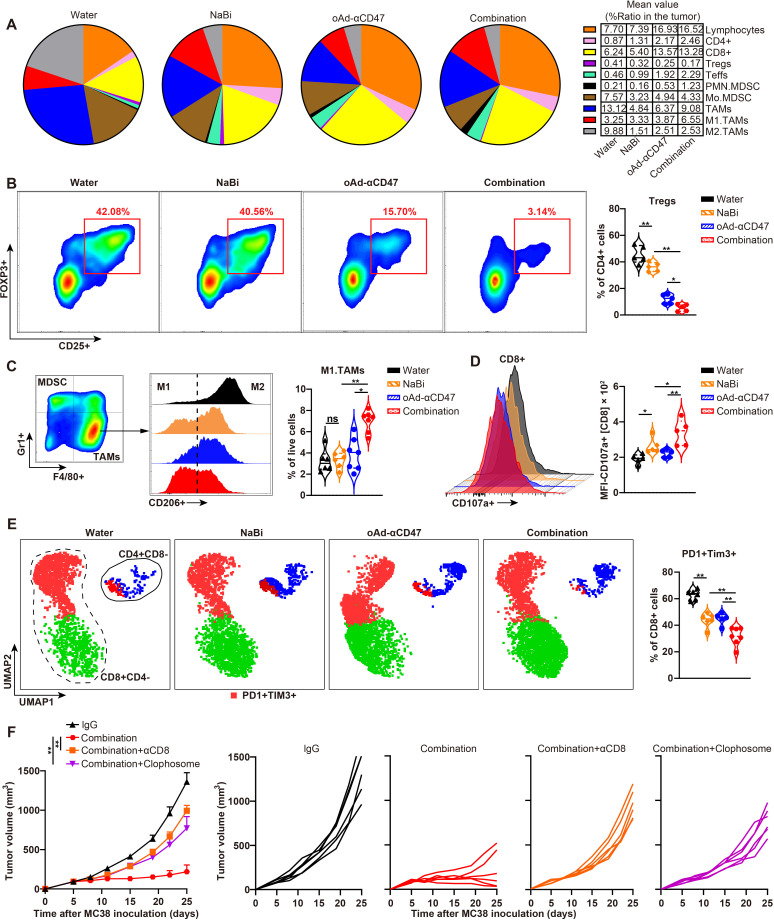
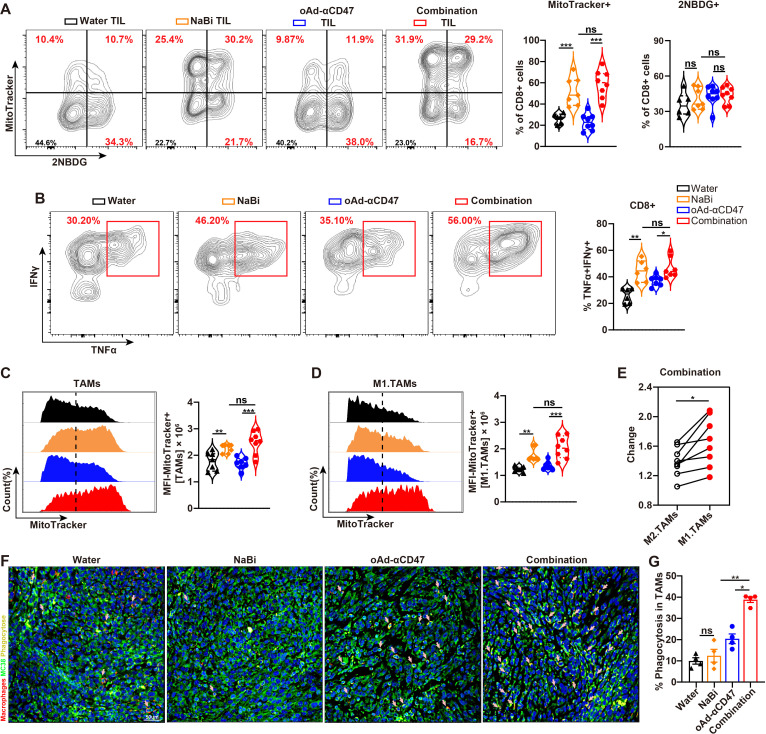
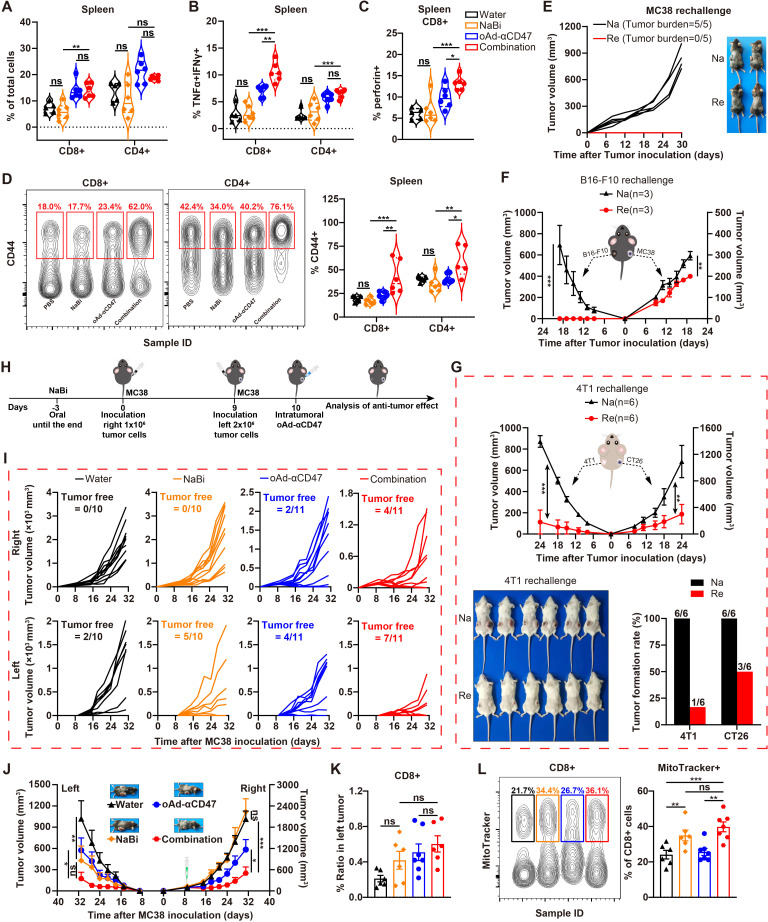
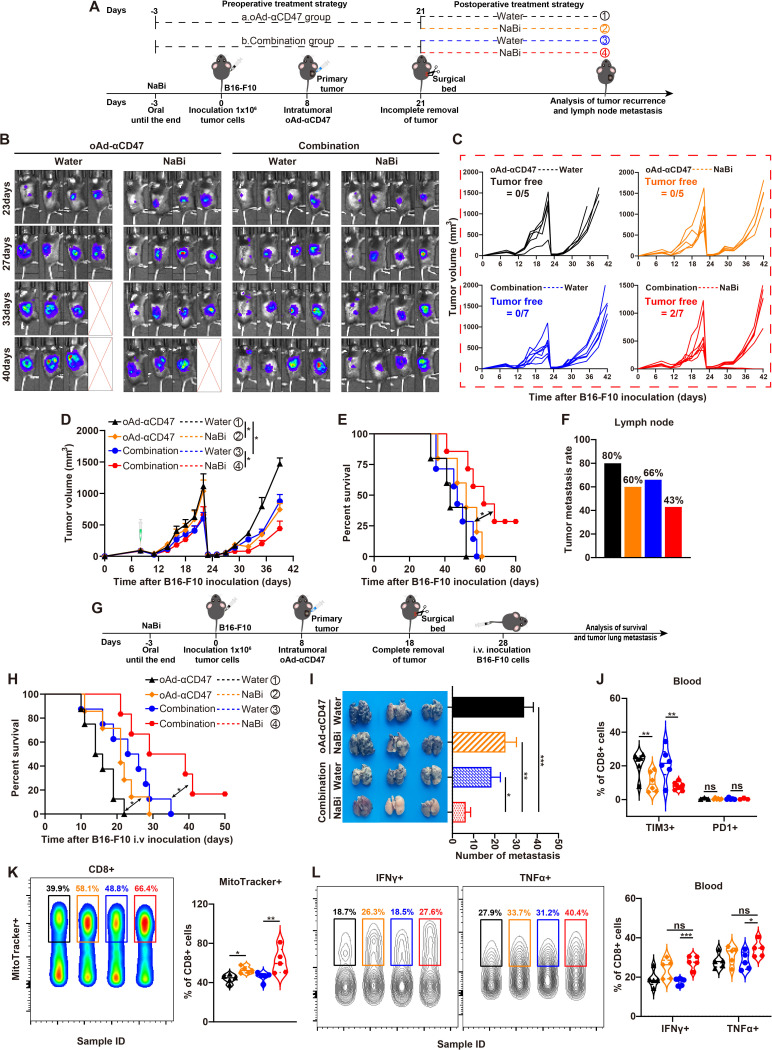
Results: Here, we identified sodium bicarbonate (NaBi) as the potent metabolic reprogramming agent that enhanced antitumor responses in the acidic TME. The combination of NaBi and oAd-αCD47 therapy significantly inhibited tumor growth and produced complete immune control in various tumor-bearing mouse models. Mechanistically, combination therapy mainly reduced the number of regulatory T cells and enriched the ratio of M1-type macrophages TAMs (M1.TAMs) to M2-type macrophages TAMs (M2.TAMs), while decreasing the abundance of PD-1+TIM3+ expression and increasing the expression of CD107a in the CD8+ T cells. Furthermore, the combination therapy enhanced the metabolic function of T cells and macrophages by upregulating PGC1α, a key regulator of mitochondrial biogenesis. This metabolic improvement contributed to a robust antitumor response. Notably, the combination therapy also promoted the generation of memory T cells, suggesting its potential as an effective neoadjuvant treatment for preventing postoperative tumor recurrence and metastasis.

Conclusions: Tumor acidic microenvironment impairs mitochondrial energy metabolism in macrophages and T cells inducing oAd-αCD47 immunotherapeutic resistance. NaBi improves the acidity of the TME and activates the CaMKII/CREB/PGC1α mitochondrial biosynthesis signaling pathway, which reprograms the energy metabolism of macrophages and T cells in the TME, and oral NaBi enhances the antitumor effect of oAd-αCD47.

Keywords: Combination therapy; Immunosuppression; Immunotherapy; Oncolytic virus.


Figures

Figure 1
Figure 1. CD47 antibody-engineered oncolytic virus controls tumor progression but cannot produce sustained antitumor effects. (A) Mean tumor growth curves and individual tumor growth volumes were calculated after virus treatment in the MC38 tumor model (n=7). (B) Representative tumor size and weight in each experimental group. (C) The percentage of tumor-infiltrating immune cell subsets in tumor tissues was analyzed by FACS on day 4 after virus treatment (n=5). (D) Bar graphs of ratios of CD8+ T cells to CD4+ T cells, CD8+ T cells, or Teffs to Tregs, M1.TAMs to M2.TAMs in MC38 tumors on day 4 post-treatment (n=5). (E) Mean tumor growth curves were calculated after treatment with different depleting antibodies in the MC38 tumor model (n=6). (F) Phagocytic efficiency of macrophages was assayed by flow cytometry. (G) The percentage of the immune cell population in MC38 tumor tissues was analyzed by FACS on day 14 after virus treatment (n=5). Data are presented as the mean±SEM. P values were determined using one-way analysis of variance. FACS, fluorescence-activated cell sorting; MDSC, myeloid-derived immunosuppressive cell; Mo.MDSC, monocyte-derived MDSC; M1.TAM, M1-type macrophages TAM; M2.TAM, M2-type macrophageso TAM; oAd, oncolytic adenovirus; PBS, phosphate-buffered saline; PMN.MDSC, pathological activated neutrophil-myeloid-derived suppressor cells MDSC; TAM, tumor-associated macrophage; Teff, effector T cell; Treg, regulatory T cell.
Figure 2
Figure 2. NaBi reprograms the metabolism of T cells and macrophages in an LA environment. Analysis of mitochondrial content (A) and glucose uptake (B) in CD8+ T cells on days 4 and 14 after treatment in tumor-bearing mice. Representative flow cytogram of MitoTracker for 2NBDG staining in CD8+ T cells and spleen-T cells and tabulated flow cytometric data are shown (n=5). (C) Representative cytometry and statistical plots of mitochondrial content in TAMs and spleen-MФ at indicated time points (n=5). (D) Statistics of mitochondrial content in M1.TAMs at indicated time points (n=5). (E and F) The concentration of LA in the supernatant of T cells (E) and BMDMs (F) cultured in fresh RPMI 1640 medium or MC38 cell culture supernatant for 48 hours (n=3). (G and H) Representative flow histograms and statistics of changes in mitochondrial content of T cells (G) and BMDM (H) cultured in RPMI 1640 medium containing different compositions for 48 hours in vitro (n=3). (I) The release of IFN-γ and TNF-α of T cells cultured in RPMI 1640 medium with different compositions for 48 hours in vitro (n=3). (J) BMDM were cultured in RPMI 1640 with different components for 48 hours, then mixed with oncolytic adenovirus-αCD47-infected tumor cell culture supernatant with or without CD47 antibody for 1 hour. This was followed by incubation with MC38 cells stained with the cell membrane red dye-DiD for 4 hours. Fluorescence and flow images of MC38 cells phagocytosed by BMDM were measured by confocal microscopy and fluorescence-activated cell sorting (MC38: BMDM=1:5; n=3). Data represent the mean±SEM. P values were measured using one-way analysis of variance. BMDM, bone marrow-derived macrophage; IFNγ, γ-interferon; LA, lactate; M1.TAM, M1-type macrophages TAM; MFI, mean fluorescence intensity; NaBi, sodium bicarbonate; PBS, phosphate-buffered saline; RPMI, Roswell Park Memorial Institute; TAM, tumor-associated macrophage; TIL, tumor-infiltrating T cells; TNF, tumor necrosis factor.
Figure 3
Figure 3. NaBi promotes oAd-αCD47 to exert a superior antitumor effect. (A) NaBi combined with oAd-αCD47 antitumor immunization schedule. (B) The mean volume of tumor growth and individual tumor growth in each group of tumor-bearing mice after treatment in the MC38 model; (one-way ANOVA). (C) Survival times of MC38 tumor-bearing mice; (log-rank test). (D–F) Representative images showing changes in tumor bioluminescence (D), tumor volume (E), and survival times (F) of B16-F10 tumor model mice; (one-way ANOVA for tumor volume and log-rank test for survival times). (G–I) Tumor bioluminescence images (G), tumor volume (H), and survival times (I) of the 4T1 breast cancer model; (one-way ANOVA for tumor volume and log-rank test for survival curves). Data are presented as the mean±SEM. ANOVA, analysis of variance; NaBi, sodium bicarbonate; oAd, oncolytic adenovirus; TME, tumor microenvironment.
Figure 4
Figure 4. Combination therapy reshapes the tumor microenvironment by reducing Tregs, increasing M1.TAMs, and promoting T-cell activation. MC38 tumor tissues were collected and used for the analysis of immune microenvironment composition by fluorescence-activated cell sorting staining after virus administration. (A) The percentage of tumor-infiltrating immune cell subsets in tumor tissues was examined. (B) The percentage of Tregs gated on CD4+ T cells. (C) Flow histograms and statistics of M1.TAMs were shown under the F4/80+Gr1 (TAMs) gate. (D) Representative flow histogram and abundance of CD107a expression on CD8+ T cells. (E) Uniform Manifold Approximation and Projection (UMAP) clustering diagrams and statistical plots after treatment tumor-bearing mice. The percentage of PD-1 and Tim3 were determined in CD8+ T cells. (F) Mean tumor growth curves and individual tumor growth volumes were calculated following treatment with different depleting antibodies in the MC38 tumor model (n=6). Data are presented as the mean±SEM. P values were calculated using one-way analysis of variance. Samples from five to seven mice per group were used for analysis. MDSC, myeloid-derived immunosuppressive cell; Mo.MDSC, monocyte-derived MDSC; M1.TAM, M1-type macrophages TAM; M2.TAM, M2-type macrophageso TAM; NaBi, sodium bicarbonate; oAd, oncolytic adenovirus; PD-1, programmed cell death protein 1; PMN.MDSC, pathological activated neutrophil-myeloid-derived suppressor cells MDSC; TAM, tumor-associated macrophage; Teff, effector T cell; TIM3, T-cell immunoglobulin domain and mucin domain 3; Treg, regulatory T cell.
Figure 5
Figure 5. Combination therapy increases the mitochondrial content of TILs and TAMs to fight tumors in vivo. (A) Flow analysis diagram and statistical diagram for the mitochondrial content and glucose uptake in CD8+ T cells after treatment in tumor-bearing mice. (B) After tumor-infiltrating T cells were stimulated by phorbol 12-myristate 13-acetic acid and ionomycin for 2 hours, the expressions of TNF-α and IFN-γ in CD8+ T cells were detected. Typical flow analysis plots are shown. (C) Flow histograms and statistical plots of mitochondrial abundance in TAMs are shown. (D) Statistical plot of mitochondrial content in M1.TAMs. (E) The ratio of mitochondrial content of M2.TAMs or M1.TAMs in the combined treatment group to those in the untreated group. (F) Typical fluorescent microscopic images of TAMs phagocytosis of MC38 tumors cells. CK19 (green), F4/80 (red), and nucleus (blue). Scale bars: 50 µm. (G) Phagocytic efficiency of macrophages was assayed by flow cytometry. Data are presented as the mean±SEM (six to eight mice per group). P values were calculated using one-way analysis of variance. IFNγ, γ-interferon; M1.TAM, M1-type macrophages TAM; M2.TAM, M2-type macrophageso TAM; MFI, mean fluorescence intensity; NaBi, sodium bicarbonate; oAd, oncolytic adenovirus; TAM, tumor-associated macrophage; TIL, tumor-infiltrating T cell; TNF, tumor necrosis factor.
Figure 6
Figure 6. NaBi induces an increase in mitochondrial content by enhancing the expression of PGC1α. (A) Correlation analysis of mitochondrial content with PGC1α expression in CD8+ T cells or M1.TAMs in all tumor samples (n=23); (two-tailed t-test). (B) Expression analysis of PGC1α in CD8+ T cells or M1.TAMs (n=5~7); (one-way ANOVA). (C) The ratio of pCREB to CREB in CD8+ T cells or M1.TAMs (n=5~7); (one-way ANOVA). T cells and BMDMs were cultured for 48 hours in RPMI 1640 containing 15 mM LA or 15 mM LA and 15 mM NaBi. (D) The changes in intracellular Ca2+ were detected by a Ca2+ fluorescent probe (Fura-4, AM). (E) Western blot analysis of CaMKII and pCaMKII, CREB and pCREB in T cells and BMDMs; (20 µg total protein, n=3~4, one-way ANOVA). (F) The ratio of pCREB to CREB in T cells and BMDMs; (G) the expression of PGC1αin T cells and BMDM; (n=3~4, one-way ANOVA). Data presented as the mean±SEM. ANOVA, analysis of variance; BMDM, bone marrow-derived macrophage; CaMKII, calmodulin-dependent protein kinase II; CREB, cyclic AMP-responsive element-binding proteins; LA, lactate; M1.TAM, M1-type macrophages TAM; MFI, mean fluorescence intensity; NaBi, sodium bicarbonate; oAd, oncolytic adenovirus; pCaMKII, phosphorylated form of CaMKII; pCREB, phosphorylated form of CREB; PGC1α, peroxisome proliferator-activated receptor gamma coactivator-1α; RPMI, Roswell Park Memorial Institute.
Figure 7
Figure 7. NaBi promotes the memory immune responses induced by oAd-αCD47. (A) Percentage of CD3+ T cells expressing CD4 or CD8 in the spleen (n=6~7, one-way ANOVA). (B) TNF-α and IFN-γ released from CD8+ T cells or CD4+ T cells in the spleen (n=6~7, one-way ANOVA). (C) Expression of perforin in CD8+ T cells in the spleen (n=6~7, one-way ANOVA). (D) Percentage of CD44+ T cells in CD8+ T cells or CD4+ T cells in the spleen (n=6~7, one-way ANOVA). (E) Tumor growth curves and tumor size plots of individual mice in the MC38 rechallenge model; (one-way ANOVA). (F and G) After the B16-F10 (F) or 4T1 (G) tumor regressed, the mice in the naive group or the rechallenge group were inoculated with B16-F10 or 4T1 and MC38 or CT26 tumors on the left and right sides, respectively, and the effect of memory response was explored based on the tumor volume and tumor formation rate; (one-way ANOVA). (H) Schedule of inoculation and treatment for bilateral MC38 tumor models. (I and J) Left and right individual tumor growth curves (I) and average tumor growth curves (J); (one-way ANOVA). (K) The proportion of CD8+ T cells in the left tumor (n=6~7, one-way ANOVA). (L) Representative flow analysis diagram and statistical plots of mitotracker staining of CD8+ T cells in the left tumor (n=6~7, one-way ANOVA). Data are presented as the mean±SEM. ANOVA, analysis of variance; IFN, interferon; Na, naive group; NaBi, sodium bicarbonate; oAd, oncolytic adenovirus; Re, rechallenge group; TNF, tumor necrosis factor.
Figure 8
Figure 8. NaBi combined with oAd-αCD47 neoadjuvant therapy inhibits tumor recurrence and metastasis after surgical resection. (A) Schedule of inoculation and treatment for B16-F10 recurrence models. (B–F) Changes in tumor bioluminescence images over time (B), individual tumor growth curves (C), average tumor growth curves (D), survival times (E), and tumor lymph node metastasis rate (F) of B16-F10 tumor recurrence models; (one-way ANOVA for tumor volume and log-rank test for survival curves). (G) Schedule of inoculation and treatment for B16-F10 metastasis models. (H and I) Changes of mice survival curves (H) and tumor lung metastases (I) in B16-F10 tumor metastasis models; (log-rank test for survival curves and one-way ANOVA for lung metastases). (J) The percentage of Tim3 and PD-1 were determined in CD8+ T cells in peripheral blood (n=6); (one-way ANOVA). (K) The percentage of mitotracker was determined in CD8+ T cells in peripheral blood (n=5~6); (one-way ANOVA). (L) Representative flow cytometry contour plot and statistical plots of CD8+ T cells expressing IFN-γ and TNF-α in peripheral blood (n=5~6); (one-way ANOVA). Data are presented as the mean±SEM. ANOVA, analysis of variance; IFN, interferon; i.v., intravenous; NaBi, sodium bicarbonate; oAd, oncolytic adenovirus; PD-1, programmed cell death protein 1; TIM3, T-cell immunoglobulin domain and mucin domain 3; TNF, tumor necrosis factor.
Figure 9
Figure 9. Schematic diagram of combination therapy to remodel the acidic microenvironment of tumors to promote antitumor effect. Tumor acidic microenvironment impairs mitochondrial energy metabolism in macrophages and T cells and induces oAd-αCD47 immunotherapeutic resistance; NaBi improves the acidity of the TME and activates the calmodulin-dependent protein kinase II/cyclic AMP-responsive element-binding proteins/PGC1α mitochondrial biosynthesis signaling pathway, thereby reprogramming the energy metabolism of macrophages and T cells in the TME, and oral NaBi enhances the antitumor effect of oAd-αCD47. MDSC, myeloid-derived immunosuppressive cell; M1.TAM, M1-type macrophages tumor-associated macrophage; M2.TAM, M2-type macrophages tumor-associated macrophage; NaBi, sodium bicarbonate; oAd, oncolytic adenovirus; pCaMKII, phosphorylated form of CaMKII; pCREB, phosphorylated form of CREB; PGC1α, peroxisome proliferator-activated receptor gamma coactivator-1α; TME, tumor microenvironment.

Similar articles

Cited by

References

    1. Ma R, Li Z, Chiocca EA, et al. The emerging field of oncolytic virus-based cancer immunotherapy. Trends Cancer. 2023;9:122–39. doi: 10.1016/j.trecan.2022.10.003. - DOI - PMC - PubMed
    1. Kaufman HL, Maciorowski D. Advancing oncolytic virus therapy by understanding the biology. Nat Rev Clin Oncol. 2021;18:197–8. doi: 10.1038/s41571-021-00490-4. - DOI - PubMed
    1. Andtbacka RHI, Kaufman HL, Collichio F, et al. Talimogene Laherparepvec Improves Durable Response Rate in Patients With Advanced Melanoma. J Clin Oncol. 2015;33:2780–8. doi: 10.1200/JCO.2014.58.3377. - DOI - PubMed
    1. Lin D, Shen Y, Liang T. Oncolytic virotherapy: basic principles, recent advances and future directions. Signal Transduct Target Ther. 2023;8:156. doi: 10.1038/s41392-023-01407-6. - DOI - PMC - PubMed
    1. Rui R, Zhou L, He S. Cancer immunotherapies: advances and bottlenecks. Front Immunol. 2023;14:1212476. doi: 10.3389/fimmu.2023.1212476. - DOI - PMC - PubMed

MeSH terms

Substances

LinkOut - more resources