. 2024 Dec 3;12(12):e009440.
doi: 10.1136/jitc-2024-009440.

Differential predictive value of resident memory CD8+T cell subpopulations in patients with non-small-cell lung cancer treated by immunotherapy

Affiliations

Differential predictive value of resident memory CD8+T cell subpopulations in patients with non-small-cell lung cancer treated by immunotherapy

Léa Paolini et al. J Immunother Cancer. .

Abstract

Background: A high density of resident memory T cells (TRM) in tumors correlates with improved clinical outcomes in immunotherapy-treated patients. In most clinical studies, TRM are defined by the CD103 marker. However, it is clearly established that not all TRM express CD103, but can be defined by other markers (CD49a, CD69, etc). The frequency of these subpopulations of TRM expressing or not CD103 varies according to the location of the cancer. Little is known about their functionality and their predictive impact on response to immunotherapy. In preclinical models, only some subpopulations of TRM are associated with cancer vaccine efficacy.

Methods: Multiparametric cytometry analyses were used to demonstrate the presence of TRM subpopulations in the lung in mice after vaccination and in fresh ex vivo human non-small cell lung cancer (NSCLC). An analysis of the T-cell repertoire of these TRM was conducted to search for their relationships. Multiplex immunofluorescence techniques were used to quantify intratumor infiltration of TRM subpopulations in two cohorts of patients with NSCLC. The impact on the clinical outcome of the TRM tumor infiltration was also investigated.

Results: We identified two main TRM subpopulations in tumor-infiltrating lymphocytes derived from patients with NSCLC: one co-expressing CD103 and CD49a (double positive (DP)), and the other expressing only CD49a (simple positive (SP)); both exhibiting additional TRM surface markers like CD69. Despite higher expression of inhibitory receptors, DP TRM exhibited greater functionality compared with SP TRM. Analysis of T-cell receptor (TCR) repertoire and expression of the stemness marker TCF1 revealed shared TCRs between populations, with the SP subset appearing more progenitor-like phenotype. In the training cohort, PD-L1 (Programmed Death-Ligand 1) and TCF1+CD8+T cells predict response to anti-PD-1. In patient with NSCLC validation cohorts, only DP TRM predicted PD-1 blockade response. Multivariate analysis, including various biomarkers associated with responses to anti-PD-(L)1, such as total CD8, TCF1+CD8+T cells, and PD-L1, showed that only intratumoral infiltration by DP TRM remained significant.

Conclusions: This study highlights the non-equivalence of TRM subpopulations. The population of TRM co-expressing CD103 and CD49a appears to be the most functional and has the most significant capacity for predicting response to immunotherapy in multivariate analysis in patients with NSCLC.

Keywords: Lung Cancer; T cell; Tumor microenvironment - TME.


Conflict of interest statement

Competing interests: None declared.

Figures
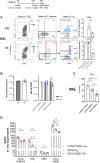
Figure 1
Figure 1. Various subpopulation of specific TRM with different phenotypes and functionality are induced depending on the route of immunization. C57BL/6J mice were immunized with STxB-E7 and alpha-galactosylceramide by intranasal (i.n) or intramuscular (i.m.) route at day 0 and 14, then sacrificed at day 21, CD8a APCeFluo 780 (5 μg) were injected intravenous 5 min before sacrifice to discriminate circulating CD8+T cells and resident CD8+T cells. (A) Representative flow cytometry plots in BAL (broncho-alveolar lavage) of specific E7-tetramer, CD103+CD49a+TRM, CD103CD49a+ TRM and CD103CD49a Teff, and CD69 frequency among these populations. (B) Absolute number of (left) E7-tetramer CD8+ and (right) CD103+CD49a+TRM, CD103CD49a+ TRM and Teff CD103CD49a in BAL. Datas are expressed as mean±SEM. One representative experiment with three to five mice from two independent experiments is shown. Analysis of difference within groups were performed with two-side Mann-Whitney t-test. (C) Percentage of PD-1 among E7-specific CD103+CD49a+ TRM, CD103CD49a+ TRM and CD103CD49a Teff in the BAL. (D) E7-specific CD103+CD49a+ TRM, CD103CD49a+ and CD103CD49a Teff were sorted from BAL at D21, and stimulated (10,000 cells/well) with E749–57 peptide (10 μg/mL) for 18 hours. Then supernatant were harvested and cytokines multiplex assay was performed. Datas are expressed as mean±SEM. One representative experiment with three to five mice from two independent experiments is shown. Analysis of difference within groups were performed with one-way analysis of variance paired-test with Tukey multiple comparison. *p<0,05 **p<0,01 ***p<0001 ****p<0,0001. IFN, interferon; PD-1: programmed cell death 1; TNF: tumor necrosis factor; TRM, resident memory T cells.
Figure 2
Figure 2. Phenotypic analyses of subpopulations of TRM and effector T cells among TILs derived from patients with lung cancer. Fresh biopsies from patients with lung cancer (n=20) were dissociated and digested, and flow cytometry was used to analyze TILs. The number of TILs tested per marker is shown below each figure. (A) The percentages of TRM subpopulations (CD103+CD49a+ and CD49a+CD103+) among CD8+T cells, as well as non-effectors TRM (CD49a CD103) among CD8+T cells are shown. (B) The percentages of different markers defining TRM (CD69, CXCR6), exhausted T cells (PD-1, Tim-3, CD39), cytotoxicity (GZMB), and proliferation (Ki67) are shown among the two populations of TRM and non-TRM effectors (CD103CD49a). Significance was determined using paired t-tests. p<0.05 was regarded as statistically significant. *p<0.05, **p<0.01, ***p<0.001; n=4–20. TIL, tumor-infiltrating lymphocyte; TIM-3: T-cell immunoglobulin mucin 3; GZMB: granzyme B; PD-1: programmed cell death 1; TRM, resident memory T cells.
Figure 3
Figure 3. T-cell receptor sharing among the subpopulations of resident memory CD8+T cells. (A) Tracking of the most predominant clonotypes within the ITGA1+(CD49a)/ITGAE+ (CD103) population. Alluvial plots represent the relationships between the frequencies of the five most predominant T-cell clonotypes detected within the ITGA1+/ITGAE+ population (right barplot), in the ITGA1neg/ITGAEneg (left barplot) and ITGA1+/ITGAEneg (middle barplot) populations for each patient. Each square represents the frequency of a clonotype in the corresponding population. (B) Fold change of the most predominant clonotypes within the ITGA1+/ITGAE+ population. Dots represent the five most predominant T-cell clonotypes detected in the ITGA1+/ITGAE+ population observed using the log2 fold change in ITGA1+/ITGAE+ (right) and ITGA1+/ITGAEneg (middle) compared with the ITGA1neg/ITGAEneg (left) cell populations by patient. Each dot is linked across cell populations by a line colored by patient. Statistical analysis was performed using paired Student’s t-tests (****p<0.0001, **p<0.01). (C) Jaccard overlap among repertoires was analyzed by generating a heatmap of the Jaccard dissimilarity index calculated across the three cell populations: ITGA1neg/ITGAEneg (white), ITGA1+/ITGAEneg (gray), and ITGA1+/ITGAE+ (black). The Euclidean distance was used for hierarchical clustering as a color-coded matrix ranging from 0 (minimum dissimilarity) to 1 (maximum dissimilarity). (D) Morisita horn overlap among repertoires was analyzed by generating a heatmap of the Morisita horn dissimilarity index calculated across the three cell populations: ITGA1neg/ITGAEneg(white), ITGA1+/ITGAEneg (gray), and ITGA1+/ITGAE+ (black). The Euclidean distance was used for hierarchical clustering as a color-coded matrix ranging from 0 (minimum dissimilarity) to 1 (maximum dissimilarity). Patients included in this figure are color-coded as patient 1 (orange), patient 2 (green), patient 3 (blue), and patient 4 (red).
Figure 4
Figure 4. Infiltration of non-small cell lung cancers by subpopulations of resident memory CD8+ T lymphocytes. (A) Representative image of the infiltration of non-small cell lung cancer. Multiplexed immunostaining was performed on paraffin-embedded tissues with antibodies to detect CD8, CD103, TCF1, CD49a and E-cadherin. inForm software enabled cell phenotyping and tissue segmentation that was performed with E-cadherin staining to discriminate tumor and stromal areas. Automated counting and mapping enabled the phenotyping of T cells: subpopulations of non-TRM tumor-infiltrating lymphocyte (defined as CD8+CD49aCD103TCF1±) and of CD8+ TRM lymphocytes defined as CD8+CD49a+CD103+TCF1 (white arrow), CD8+CD49a+CD103TCF1+, CD8+CD49a+ CD103 TCF1. Original magnification ×200. Cell number (B) and percentage (C) of non-TRM and CD8+ TRM lymphocytes tumor-infiltrating lymphocytes were determined by in situ immunofluorescence. Each dot represents one patient. The average number of fields counted per patient is 16. Isotype control antibodies were done for each experiment. Significance was determined by a Wilcoxon test. Values of p<0.05 were considered statistically significant. **p<0. 01; ****p<0. 0001. TRM, resident memory T cells.
Figure 5
Figure 5. Correlation between the infiltration of various subpopulations of CD8+T cells in the NSCLC tumor microenvironment on second line therapeutic and clinical outcomes. (A) Forest plot showing the HRs and 95% CIs computed using a univariate Cox model. The infiltration of several subsets of CD8+T cells and PD-L1 expression were quantified, using the median as a cut-off for dichotomization. Variables are ordered according to decreasing Wald statistic values. The sublocalization of these subpopulations in the stroma or the tumor or not (total) was taken into account. P value<0.05 was considered significant (in red). The HRs are calculated using the high group as a reference. A positive HR means that a high level of a measure is protective. (B) Kaplan-Meier curves corresponding to the overall survival of patients with NSCLC grouped according to tumorous or stromal infiltration by subpopulations of resident memory CD8+T cells or total TCF1+CD8+T cells and the expression of PD-L1 on tumor cells. Each variable was dichotomized separately based on the median value in order to define low and high groups. Log-rank test values are first displayed together with HRs, 95% CIs, and p values from the Wald test computed using a univariate Cox model. (C) Time-dependent receiver operating characteristic curves were used to analyze the true positive (TP) rate (sensitivity) and false positive (FP) rate (1-specificity) of the two subpopulations of resident memory CD8+ T cells, total CD8+T cells, TCF1+CD8+T cells, and PD-L1 when predicting 2-year overall survival. For each variable, only patients whose variable values were located in the extreme tertiles of the corresponding distribution were included. The resulting area under the curve values are shown. NSCLC, non-small cell lung cancer.
Figure 6
Figure 6. The clinical impact of the infiltration of various subpopulations of CD8+ T cells in the NSCLC tumor microenvironment in a validation cohort. (A) Forest plot representing Cox overall survival regression in patients with NSCLC (n=36). The infiltration of several subsets of CD8+T cells was quantified using the median as a cut-off. The sublocalization of these subpopulations in the stroma or the tumor or not (total) was taken into account. P value<0.05 was considered significant. (B) Kaplan-Meier analyses of the overall survival of patients with NSCLC depending on their level of intratumoral CD49a+CD103+CD8+ T cells dichotomized with the median. Statistical analyses were performed with the log-rank test. (C) Forest plot representing Cox progression-free survival regression in patients with NSCLC (n=36). The infiltration of several subsets of CD8+T cells was quantified using the median as a cut-off. The sublocalization of these subpopulations in the stroma or the tumor or not (total) was taken into account. P value<0.05 was considered significant. The HRs are calculated using the high group as a reference. A positive HR means that a high level of a measure is protective. P value is indicated in red. NSCLC, non-small cell lung cancer.

References

    1. Masopust D, Vezys V, Marzo AL, et al. Preferential Localization of Effector Memory Cells in Nonlymphoid Tissue. Science. 2001;291:2413–7. doi: 10.1126/science.1058867. - DOI - PubMed
    1. Hombrink P, Helbig C, Backer RA, et al. Programs for the persistence, vigilance and control of human CD8+ lung-resident memory T cells. Nat Immunol. 2016;17:1467–78. doi: 10.1038/ni.3589. - DOI - PubMed
    1. Kumar BV, Ma W, Miron M, et al. Human Tissue-Resident Memory T Cells Are Defined by Core Transcriptional and Functional Signatures in Lymphoid and Mucosal Sites. Cell Rep. 2017;20:2921–34. doi: 10.1016/j.celrep.2017.08.078. - DOI - PMC - PubMed
    1. Mami-Chouaib F, Blanc C, Corgnac S, et al. Resident memory T cells, critical components in tumor immunology. J Immunother Cancer. 2018;6:87. doi: 10.1186/s40425-018-0399-6. - DOI - PMC - PubMed
    1. Schenkel JM, Masopust D. Tissue-Resident Memory T Cells. Immunity. 2014;41:886–97. doi: 10.1016/j.immuni.2014.12.007. - DOI - PMC - PubMed