

Interactive effects of temperature, cadmium, and hypoxia on rainbow trout (Oncorhynchus mykiss) liver mitochondrial bioenergetics
- PMID: 39632330
- PMCID: PMC11783143
- DOI: 10.1016/j.ecoenv.2024.117450
Interactive effects of temperature, cadmium, and hypoxia on rainbow trout (Oncorhynchus mykiss) liver mitochondrial bioenergetics
Abstract
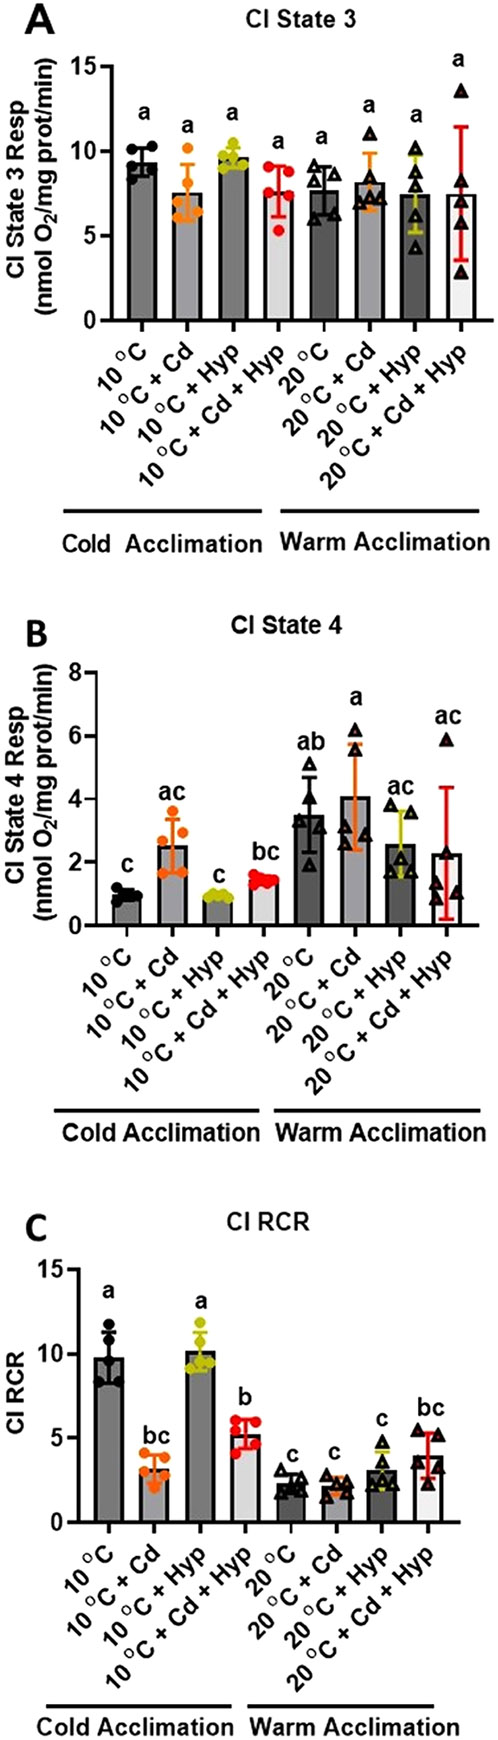
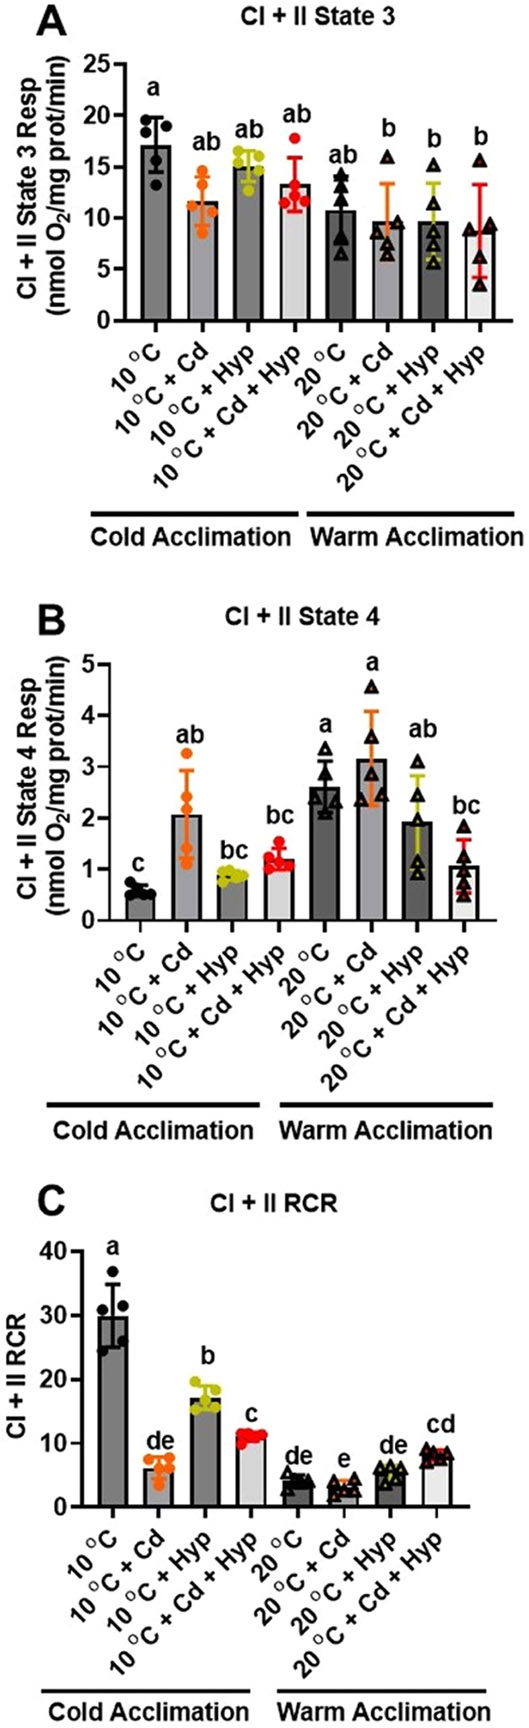
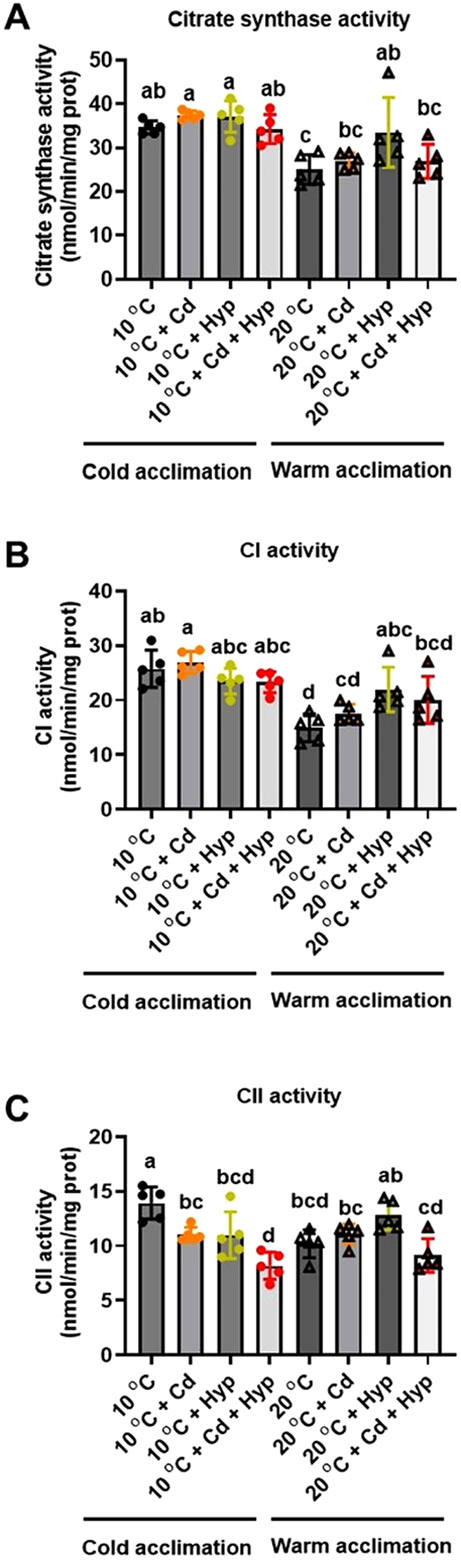
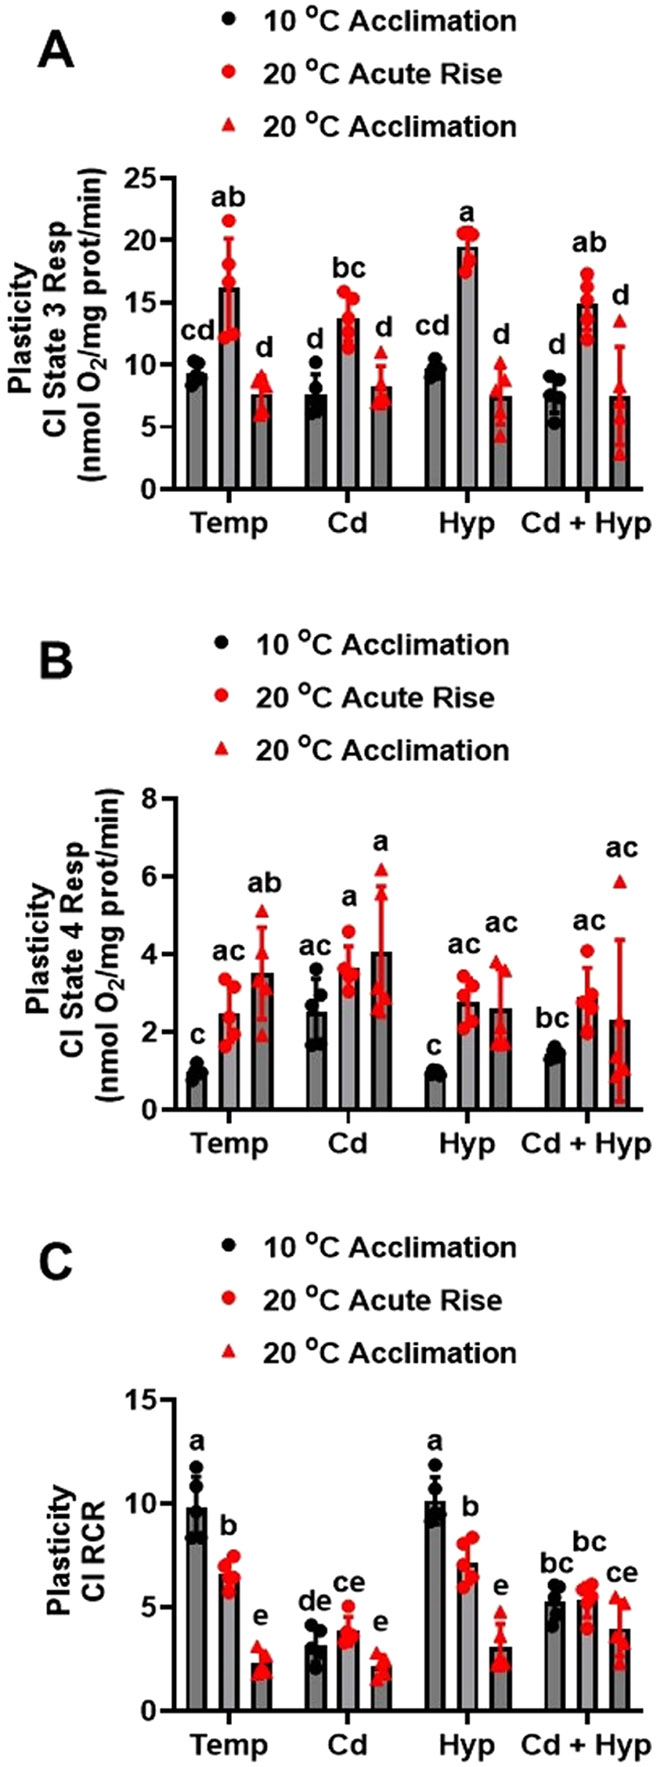
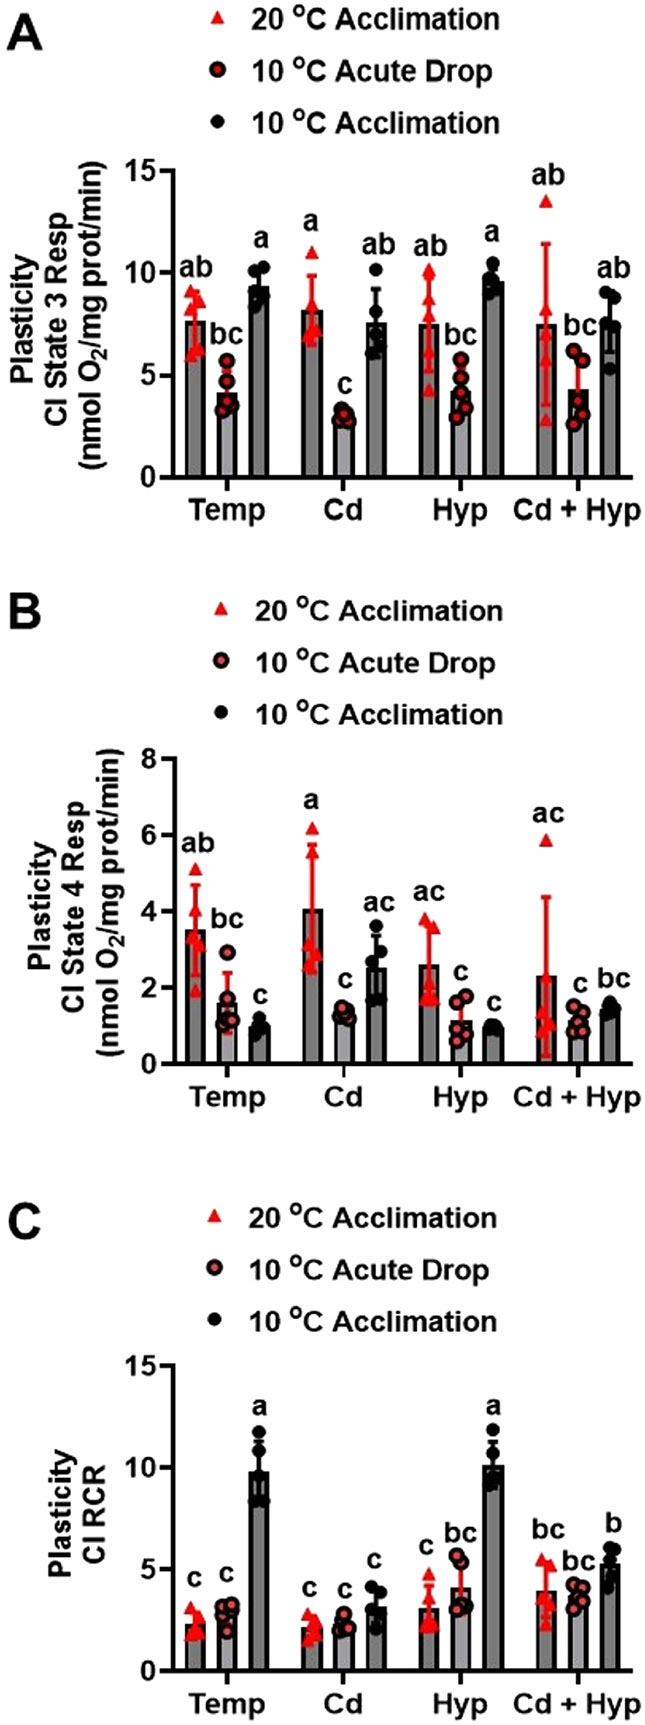
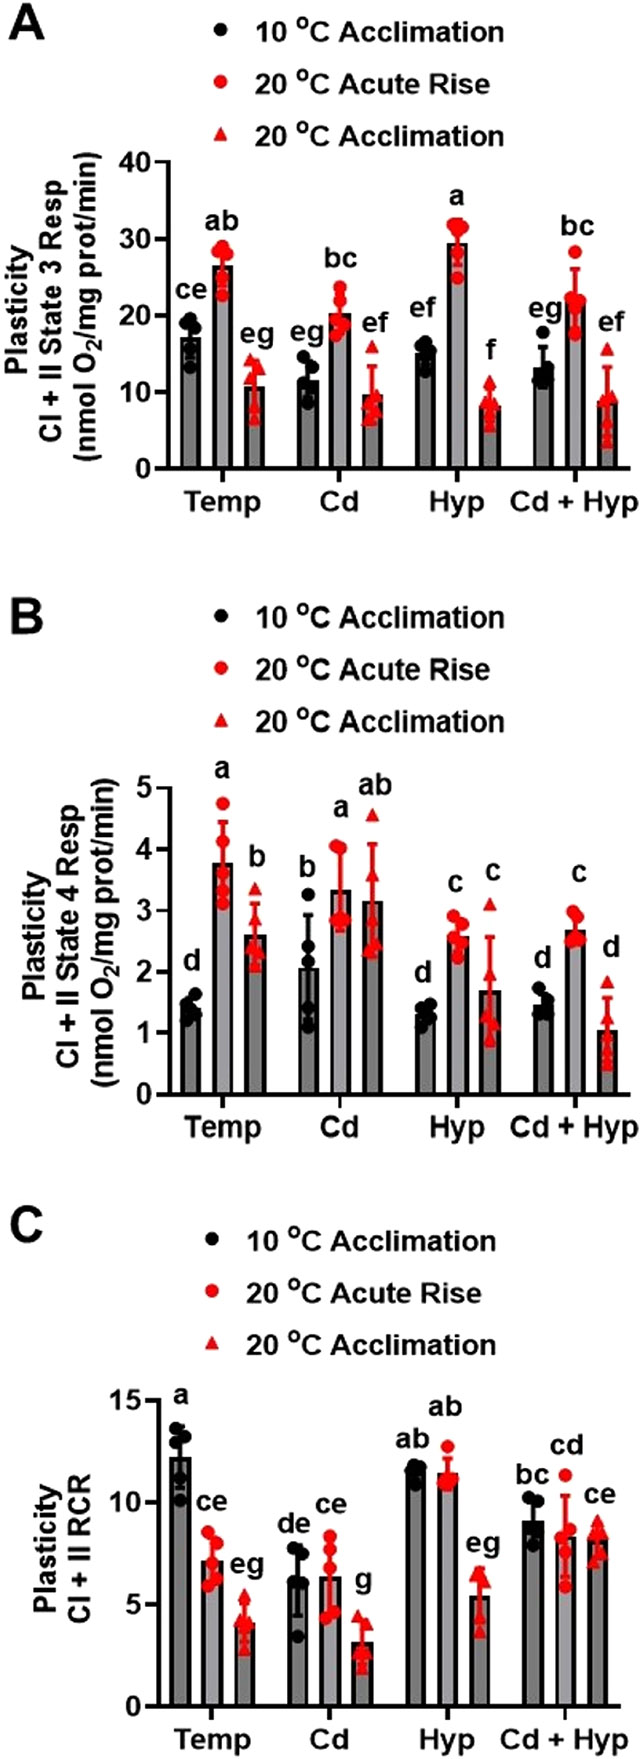
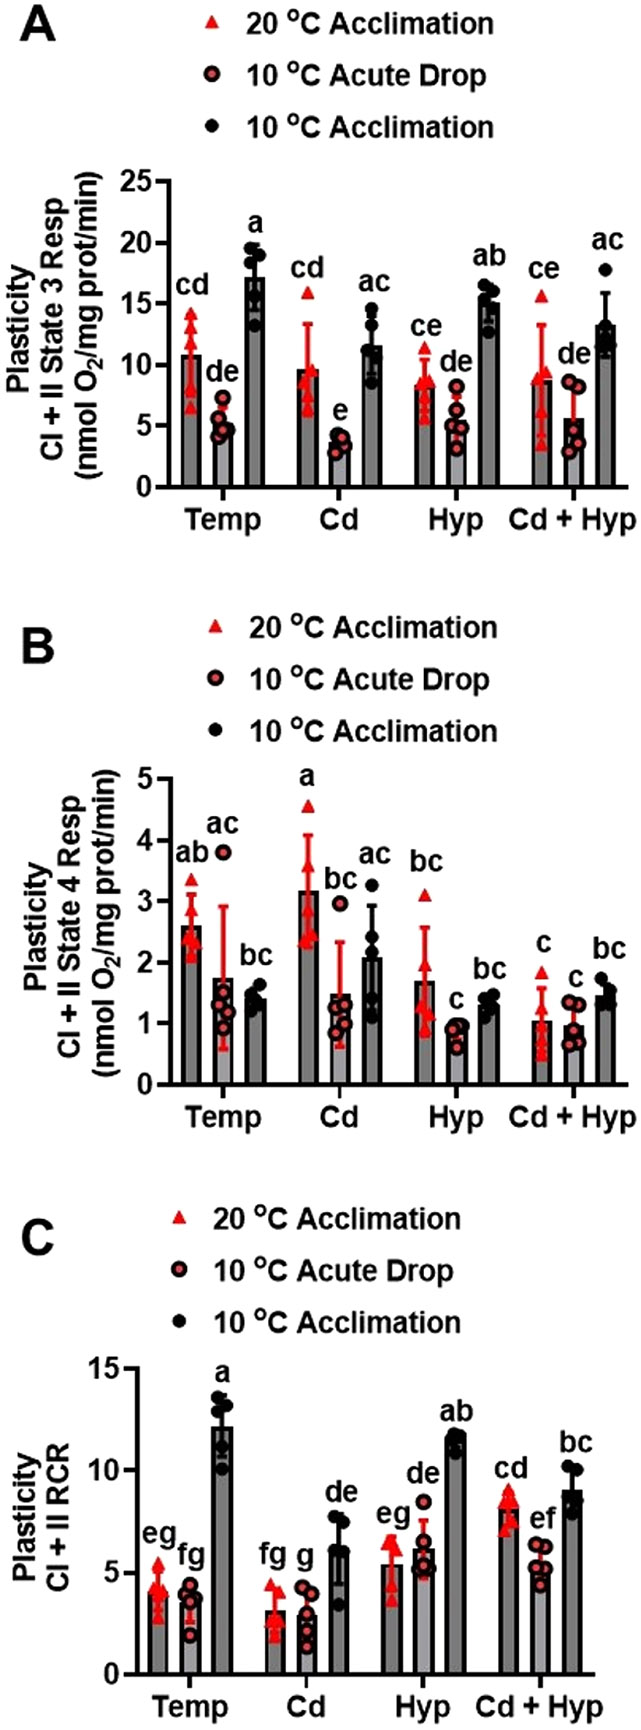
Fish in their natural environments possess elaborate mechanisms that regulate physiological function to mitigate the adverse effects of multiple environmental stressors such as temperature, metals, and hypoxia. We investigated how warm acclimation affects mitochondrial responses to Cd, hypoxia, and acute temperature shifts (heat shock and cold snap) in rainbow trout. We observed that state 3 respiration driven by complex I (CI) was resistant to the stressors while warm acclimation and Cd reduced complex I +II (CI + II) driven state 3 respiration. In contrast, state 4 (leak) respirations for both CI and CI + II were consistently stimulated by warm acclimation resulting in reduced mitochondrial coupling efficiency (respiratory control ratio [RCR]). Warm acclimation and Cd exacerbated their individual effect on leak respiration to further reduce the RCR. Moreover, the effect of warm acclimation on mitochondrial bioenergetics aligned with its inhibitory effect on activities of citrate synthase and both CI and CII. Unlike the Cd and warm acclimation combined exposure, hypoxia alone and in combination with warm acclimation and/or Cd abolished the stimulation of CI and CI + II powered leak respirations resulting in partial recovery of RCR. The response to acute temperature shifts indicated that while state 3 respiration returned to pre-acclimation level, the leak respiration did not. Overall, our findings suggest a complex in vivo interaction of multiple stressors on mitochondrial function that are not adequately predicted by their individual effects.
Keywords: Acclimation; Cd; Hypoxia; Mitochondrial bioenergetics; Plasticity; Rainbow trout.
Copyright © 2024 The Authors. Published by Elsevier Inc. All rights reserved.
Conflict of interest statement
Declaration of Competing Interest The authors declare that they have no known competing financial interests or personal relationships that could have appeared to influence the work reported in this paper
Figures
Update of
-
Interactive effects of temperature, cadmium, and hypoxia on rainbow trout (Oncorhynchus mykiss) liver mitochondrial bioenergetics.bioRxiv [Preprint]. 2024 Jul 16:2024.07.15.603625. doi: 10.1101/2024.07.15.603625. bioRxiv. 2024. Update in: Ecotoxicol Environ Saf. 2025 Jan 01;289:117450. doi: 10.1016/j.ecoenv.2024.117450. PMID: 39071258 Free PMC article. Updated. Preprint.
Similar articles
-
Interactive effects of temperature, cadmium, and hypoxia on rainbow trout (Oncorhynchus mykiss) liver mitochondrial bioenergetics.bioRxiv [Preprint]. 2024 Jul 16:2024.07.15.603625. doi: 10.1101/2024.07.15.603625. bioRxiv. 2024. Update in: Ecotoxicol Environ Saf. 2025 Jan 01;289:117450. doi: 10.1016/j.ecoenv.2024.117450. PMID: 39071258 Free PMC article. Updated. Preprint.
-
Alterations in mitochondrial electron transport system activity in response to warm acclimation, hypoxia-reoxygenation and copper in rainbow trout, Oncorhynchus mykiss.Aquat Toxicol. 2015 Aug;165:51-63. doi: 10.1016/j.aquatox.2015.05.014. Epub 2015 May 19. Aquat Toxicol. 2015. PMID: 26022556
-
Effects of hypoxia-cadmium interactions on rainbow trout (Oncorhynchus mykiss) mitochondrial bioenergetics: attenuation of hypoxia-induced proton leak by low doses of cadmium.J Exp Biol. 2014 Mar 15;217(Pt 6):831-40. doi: 10.1242/jeb.093344. Epub 2013 Nov 21. J Exp Biol. 2014. PMID: 24265424
-
Effects of copper, hypoxia and acute temperature shifts on mitochondrial oxidation in rainbow trout (Oncorhynchus mykiss) acclimated to warm temperature.Aquat Toxicol. 2015 Dec;169:46-57. doi: 10.1016/j.aquatox.2015.10.006. Epub 2015 Oct 23. Aquat Toxicol. 2015. PMID: 26513222
-
Copper and hypoxia modulate transcriptional and mitochondrial functional-biochemical responses in warm acclimated rainbow trout (Oncorhynchus mykiss).Environ Pollut. 2016 Apr;211:291-306. doi: 10.1016/j.envpol.2015.11.050. Epub 2016 Jan 14. Environ Pollut. 2016. PMID: 26774776
References
-
- Adiele RC, Stevens D, Kamunde C, 2010. Reciprocal enhancement of uptake and toxicity of cadmium and calcium in rainbow trout (Oncorhynchus mykiss) liver mitochondria. Aquat. Toxicol 96, 319–327. - PubMed
-
- Adiele RC, Stevens D, Kamunde C, 2012. Differential inhibition of electron transport chain enzyme complexes by cadmium and calcium in isolated rainbow trout (Oncorhynchus mykiss) hepatic mitochondria. Toxicol. Sci 127, 110–119. - PubMed
-
- Belyaeva EA, Korotkov SM, 2003. Mechanism of primary Cd2+-induced rat liver mitochondria dysfunction: discrete mode of Cd2+ action on calcium and thiol-dependent domains. Toxicol. Appl. Pharmacol 192, 56–68. - PubMed
MeSH terms
Substances
Grants and funding
LinkOut - more resources
Full Text Sources
