. 2025 Jan;12(4):e2411378.
doi: 10.1002/advs.202411378. Epub 2024 Dec 4.

A Smart Nanomedicine Unleashes a Dual Assault of Glucose Starvation and Cuproptosis to Supercharge αPD-L1 Therapy

Affiliations

A Smart Nanomedicine Unleashes a Dual Assault of Glucose Starvation and Cuproptosis to Supercharge αPD-L1 Therapy

Yiming Xu et al. Adv Sci (Weinh). 2025 Jan.

Abstract

Combination therapy has become a promising strategy for promoting the outcomes of anti-programmed death ligand-1 (αPD-L1) therapy in lung cancer. Among all, emerging strategies targeting cancer metabolism have shown great potency in treating cancers with immunotherapy. Here, alteration in glucose and copper metabolisms is found to synergistically regulate PD-L1 expression in lung cancer cells. Thus, an intelligent biomimetic nano-delivery system is synthesized by camouflaging lung cancer cell membranes onto glucose oxidase-loaded Cu-LDHs (CMGCL) for cancer metabolism targeted interference. Such novel nanomedicine is able to induce lung cancer cell cuproptosis and PD-L1 upregulation significantly via self-amplified cascade reactions. Meanwhile, with a decent cancer cell membrane coating, CMGCL exhibited great biosafety, tumor-targeted efficiency and anti-tumor effects in LLC lung tumor-bearing mice models. Additionally, a combination of CMGCL can sensitize the therapeutic effects of αPD-L1, substantially promoting tumor inhibition in both subcutaneous and lung metastasis LLC-bearing mice models. Overall, these findings highlight the potential connections between glucose metabolism and cell cuproptosis, offering a promising approach for treating lung cancer by integrating starvation, cuproptosis, and immunotherapy.

Keywords: PD‐L1; biomimetic nanomedicine; cuproptosis; glucose metabolisms; lung cancer.


Conflict of interest statement

The author declare no conflict of interest.

Figures

Scheme 1
Scheme 1
Scheme illustration depicting the sensitization of lung cancer αPD‐L1 therapy by CMGCL‐induced glucose starvation and cuproptosis synergistically.
Figure 1
Figure 1
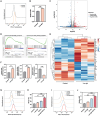
PD‐L1 upregulation induced by glucose starvation and cuproptosis synergistically. A,B) Representative flow cytometry histograms and quantitative analysis of PD‐L1 expression on LLC cells after low‐glc treatment for 24 h. MFI: mean fluorescence intensity. C) Volcano plots displayed differentially expressed genes from RNA‐seq comparing low‐glc with control groups. D) GSEA analysis of glycolysis and copper ion binding pathways in control and low‐glc groups. NES: normalized enrichment score. E) Heatmap analysis of gene expressions between control and low‐glc groups in LLC cells. F) The relative mRNA levels of Hk2, Slc25a3 and Sod3 in different groups were measured by RT‐qPCR and were normalized by the mRNA expression levels of β‐actin. G,H) Flow cytometry histograms and quantitative analysis of DCFH‐DA fluorescence of LLC cells after different treatments. I,J) Representative flow cytometry histograms and quantitative analysis of PD‐L1 expression on LLC cells after different treatments. Data are depicted as mean ± SEM; n = 3. ** p < 0.01, *** p < 0.001.
Figure 2
Figure 2
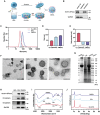
Preparation and characterization of CMGCL. A) Scheme illustration of GOx loading into Cu‐LDHs with CM camouflaging. B) Expression analysis of membrane‐specific protein Na+/K+‐ATPase and cytoplasm‐specific protein GAPDH in LLC whole cell, cytoplasm, and membrane by WB. C) Representative particle size distributions of Cu‐LDHs, GCL, and CMGCL measured by dynamic lighting scattering (DLS). D) Average size of Cu‐LDHs, GCL, and CMGCL measured by DLS. E) Average zeta potential of Cu‐LDHs, GCL and CMGCL. F) Representative TEM images of Cu‐LDHs, GCL, and CMGCL. Scale bar: 100 nm. Internal scale bar: 50 nm. G) Coomassie blue staining of SDS‐PAGE for GCL, CM, and CMGCL. H) WB analysis for membrane‐specific protein Na+/K+‐ATPase, N‐Cadherin, E‐Cadherin, and EpCAM in GCL, CM, and CMGCL. I) FT‐IR spectra of Cu‐LDHs, GCL, and CMGCL. J) XRD patterns of Cu‐LDHs, GCL, and CMGCL. Data are shown as mean ± SEM; n = 3.
Figure 3
Figure 3
Effective catalytic properties of CMGCL. A) Particle size distributions of CMGCL kept in deionized water, PBS or DMEM + 10% FBS for 24 h, measured by DLS. B) Average size and zeta potential of CMGCL in PBS for 7 days. C) Schematic illustration of cascade catalytic reactions induced by CMGCL. D) GSH content after incubation with CMGCL at different concentrations. E) Residual glucose content after reaction with CMGCL at different time points. F) H2O2 generation from the reaction between CMGCL (GOx: 50 µg mL−1) and glucose (10 mm) at different time points. G) H2O2 generation from reactions between CMGCL (GOx: 50 µg mL−1) and different glucose concentrations for 1 h. H) UV−vis absorption spectra of TMB after co‐incubated with or without H2O2 or CMGCL. I) Oxidation of colorless TMB by •OH generated from reaction between H2O2 and different concentrations of CMGCL. The blue‐colored oxTMB had representative absorbance peaks peaked at 370 and 652 nm. Data are depicted as mean ± SEM; n = 3.
Figure 4
Figure 4
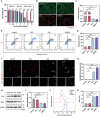
In‐vitro cytotoxicity of CMGCL for lung cancer cells. A) Cell survival rate of LLC cells after treated with BCL, GCL, and CMGCL at different concentrations for 12 h. B) Representative fluorescence images of LLC cells co‐stained with Calcein AM (green, live cells) and Propidium Iodide (PI) (red, dead cells) after treatments with BCL, GCL, and CMGCL for 12 h. Scale bar: 100 µm. C) The ratio of live cells to dead cells in each group was quantitatively analyzed. D,E) The population of apoptosis cells (Q2+Q3) via Annexin V‐FITC/PI double‐staining assay using flow cytometry analysis. F,G) Representative fluorescence images and quantitative analysis of JC‐1 aggregates (red) and JC‐1 monomers (green) in LLC cells after different treatments for 4 h. Scale bar: 50 µm. H) WB analysis for Bcl‐2 and Bax protein expressions in LLC cells after different treatments. I) Relative Bcl‐2/Bax protein expression ratio of each group. The expression levels of the proteins were normalized to that of β‐actin. J,K) Representative flow cytometry histograms and quantitative analysis of intracellular ROS levels of LLC cells after different treatments. All data are depicted as mean ± SEM; n = 3. ns, not significant, * p < 0.05,** p < 0.01, *** p < 0.001.
Figure 5
Figure 5
Cuproptosis activation and PD‐L1 upregulation mediated by CMGCL. A) Relative GSH level in LLC cells after treated with BCL, GCL, and CMGCL. B) WB analysis of FDX1 and LIAS protein expression after different treatments in LLC cells. C) Quantitative analysis of protein expressions after normalized by the levels of β‐actin. D) WB for DLAT and its oligomers of LLC cells with indicated treatments. E) Quantitative analysis of DLAT oligomers in different groups after normalized by the levels of β‐actin. F) Representative CLSM images of DLAT (green) expression in LLC cells with various treatments. Cell mitochondria were co‐stained with MitoTraker (red) and nuclei were co‐stained with DAPI (blue). Scale bar: 50 µm; Enlarged scale bar: 10 µm. G,H) Representative flow cytometry histograms and quantitative analysis of PD‐L1 expression on LLC cells after different treatments. I) PD‐L1 expression level changes in LLC cells by WB analysis. J) Quantitative analysis of PD‐L1 in different groups after normalized by the levels of β‐actin. Data are presented in mean ± SEM; n = 3. ns, not significant, * p < 0.05, ** p < 0.01, *** p < 0.001.
Figure 6
Figure 6
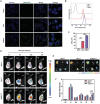
Precise tumor‐targeted efficacy of CMBCL via CM camouflage. A) Representative CLSM photographs of LLC cells after incubated with FITC‐labeled BCL or CMBCL (green) for 4 h at 37 °C. Cell nuclei were co‐stained with Hoechst 33342 (blue). Scale bar: 50 µm. Enlarged scale bar: 10 µm. B,C) Representative flow cytometry histograms and semi‐quantitative analysis of intracellular uptake of FITC‐labeled BCL or CMBCL by LLC cells after 4 h incubation at 37 °C. D) In vivo fluorescence images of LLC tumor‐bearing mice after intravenously injected with BSACy7, BCLCy7, and CMBCLCy7 at different time intervals. E,F) Ex vivo fluorescence pictures and relative quantitative analysis of dissected major organs and tumors post 24 h administration. He: Heart. Li: Liver. Sp: Spleen. Lu: Lung. Ki: Kidney. ROI: region of interest. Data are presented in mean ± SEM; n = 3. * p < 0.05, *** p < 0.001.
Figure 7
Figure 7
Effective anti‐tumor effects against LLC tumors of CMGCL. A) Schematic diagram of the experimental schedule for treatment of the subcutaneous LLC tumor model. FCM, flow cytometry. B) Photographs of dissected tumors on day 14 following different treatment. C) Tumor volume curves of subcutaneous LLC tumors during the experiments (n = 5). D) Individual tumor volume curves of different groups during the treatments. E) Average tumor weight in different groups on day 14 (n = 5). F) Representative fluorescence images DLAT (green) expression in different tumor sections. Cell nuclei were co‐stained with DAPI (blue). Scale bar: 50 µm. G) Relative fluorescence intensity of DLAT (green) expression in different groups (n = 3). H) Representative flow cytometry histograms of PD‐L1 expression levels in CD45 cells of LLC tumor lysates. I) Quantitative analysis of mean PD‐L1 fluorescence intensities in CD45 cells for different groups (n = 3). J) Representative flow cytometry profiles for the population of CD8+CD45+ cells in LLC tumors with different treatments. K) Quantitation for the percentages of CD8+CD45+ cells in each group (n = 3). L) Representative flow cytometry profiles for the population of NK1.1+CD3CD45+ cells in LLC tumors with different treatments. M) Quantitation for the populations of NK1.1+CD3CD45+ cells in tumors of each group (n = 3). G1, Control. G2, BCL. G3, GCL. G4, CMGCL. Data are depicted as mean ± SEM. ns, not significant, * p < 0.05, ** p < 0.01, *** p < 0.001.
Figure 8
Figure 8
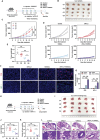
Sensitization of αPD‐L1 immunotherapy via CMGCL combined treatment. A) Schematic illustration of the experimental schedule for treatment of the subcutaneous LLC tumor model. B) Visualization of tumor specimens on day 14 following different treatments. C) Tumor volume curves of LLC tumor‐bearing mice in each group (n = 5). D) Individual tumor volume curves. E) Average tumor weight in different groups on day 14 (n = 5). F,G) Representative fluorescence images and relative fluorescence intensity of CD8 (red) and NK1.1 (green) in tumor sections of different groups (n = 3). Cell nuclei were co‐stained with DAPI (blue). Scale bar: 50 µm. H) Schematic illustration of the experimental schedule for LLC tumor lung metastatic model treatment. I) Digital photos of lungs in each group after 14 days of treatments. J) Lung weight of each group at day 14 (n = 5). K) Numbers of lung metastatic tumor nodules (n = 5). L) Representative H&E staining images of lungs in different groups. Scale bar: 1000 µm. Enlarged scale bar: 100 µm. G1, Control. G2, αPD‐L1. G3, CMGCL. G4, αPD‐L1 + CMGCL. Data are depicted as mean ± SEM. ns, not significant, * p < 0.05, ** p < 0.01, *** p < 0.001.

Similar articles

Cited by

References

    1. a) Leiter A., Veluswamy R. R., Wisnivesky J. P., Nat. Rev. Clin. Oncol. 2023, 20, 624; - PubMed
    2. b) Siegel R. L., Miller K. D., Wagle N. S., Jemal A., CA Cancer J. Clin. 2023, 73, 17. - PubMed
    1. a) Pirker R., Pulmonology 2020, 26, 283; - PubMed
    2. b) Thai A. A., Solomon B. J., Sequist L. V., Gainor J. F., Heist R. S., Lancet 2021, 398, 535. - PubMed
    1. Vesely M. D., Zhang T., Chen L., Annu. Rev. Immunol. 2022, 40, 45. - PubMed
    1. a) Yap T. A., Parkes E. E., Peng W., Moyers J. T., Curran M. A., Tawbi H. A., Cancer Discovery 2021, 11, 1368; - PMC - PubMed
    2. b) Lahiri A., Maji A., Potdar P. D., Singh N., Parikh P., Bisht B., Mukherjee A., Paul M. K., Mol. Cancer 2023, 22, 40. - PMC - PubMed
    1. a) DePeaux K., Delgoffe G. M., Nat. Rev. Immunol. 2021, 21, 785; - PMC - PubMed
    2. b) De Martino M., Rathmell J. C., Galluzzi L., Vanpouille‐Box C., Nat. Rev. Immunol. 2024, 24, 654. - PMC - PubMed

LinkOut - more resources