. 2025 Feb 7;15(2):346-362.
doi: 10.1158/2159-8290.CD-23-1480.

Tumor-Intrinsic Kinome Landscape of Pancreatic Cancer Reveals New Therapeutic Approaches

Affiliations

Tumor-Intrinsic Kinome Landscape of Pancreatic Cancer Reveals New Therapeutic Approaches

Yi Xu et al. Cancer Discov. .

Abstract

We provide a comprehensive tumor-intrinsic kinome landscape that provides a roadmap for the use of kinase inhibitors in PDAC treatment approaches.


Conflict of interest statement

Disclosures: Stefan Boeck COI (not related to project)

Consulting or advisory role: Celgene, Servier, Incyte, Fresenius, Janssen-Cilag, AstraZeneca, MSD, BMS; Honoraria for scientific presentations: Celgene, Servier, MSD

Patents A patent application is filed for this work: Authors/inventors: Jen Jen Yeh, Yi Xu, and Xianlu Peng by the University of North Carolina Chapel Hill, for the use of molecular subtyping to select specific kinase inhibitor treatments for patients with pancreatic cancer.

Patent holders of PurIST (WO2020205993A1), which is used in this study, who are authors: Naim Rashid, Jen Jen Yeh. GeneCentric Therapeutics, Inc. had no involvement in the current study but acquired an exclusive license from the University of North Carolina at Chapel Hill to PurIST for subtyping pancreatic ductal adenocarcinoma.

Figures

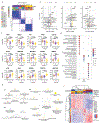
Figure 1.
Figure 1.. Characterization of the PDAC kinome in PDX tumors using MIB-MS.
(a) Schematic showing kinome profiling pipeline utilizing Multiplexed Inhibitor Beads (MIB) to enrich for kinases basal-like and classical subtype PDX tumors prior to label free quantitation by mass spectrometry. (b) Bar plot of the average number of total kinases captured across each PDX mouse line (n ≥ 3) with proportions indicating human, mouse, or species ambiguous peptide matches. (c) Bar plot showing kinases found in all, greater than 50%, and greater than 75% of all samples across species. (d) Kinome tree displaying human kinases identified across all samples with class of kinases indicated by node color and the percentage of sample the kinase was found in indicated by node size. (e) Principal component analysis (PCA) on kinase expression with sample grouping by PDX tumor line and MIB run.
Figure 2.
Figure 2.. The PDX kinome is defined by three subgroups with distinct kinase expression and function.
(a) Unsupervised consensus clustering on normalized LFQ intensities from MIB-profiled PDX samples. (b) Volcano plots comparing differential kinase expression across k1, k2 and k3 sample subgroups. Cut offs for significant kinases were set at p-value < 0.05 and log2 fold change > 0.5. (c) KEGG gene set enrichment analysis on differentially expressed k1, k2 and k3 kinases based on the parameters previously mentioned using an adjusted p-value cutoff of 0.05. (d) Boxplots showing log transformed LFQ intensities of the top representative kinases for k1, k2, and k3 subgroups with significance determined by unpaired t-tests comparing each subgroup to each other. (e) Protein network analysis with representative pathway enrichment for the top kinases in each subgroup and their predicted binding substrates. (f) Unsupervised consensus clustered heatmap on RNAseq for representative kinases of each subgroup with trackbars indicating kinome cluster and molecular subtypes as previously defined by Chan-Seng-Yue.
Figure 3.
Figure 3.. Subtype specific kinase expression defines distinct pathways in basal-like and classical tumors
(a) Unsupervised consensus clustered heatmap with k=2 on LFQ protein intensities for all non-missing kinases and all PDX with track bars indicating kinase cluster, single sample classifier (SSC) PurIST subtype, PDX tumor line, and MIB run. (b) PCA on normalized LFQ intensities of all PDX with colors indicating SSC subtype. (c) Kinome tree on all kinases that showed a log2 fold change in LFQ intensity greater than zero when comparing basal-like to classical subtype samples or log2 fold change in LFQ intensity greater than zero when comparing classical to basal-like subtype samples with the size of circles representing the value of log2 fold change. (d) Differential expression using the limma program comparing kinase expression between classical and basal-like subtype tumors. Cut-offs for significant kinases were set at p-value < 0.05 and log2 fold change > 0.5. (e) KEGG gene set enrichment analysis on differentially expressed basal-like and classical subtype kinases based on the parameters previously mentioned using an adjusted p-value cutoff of 0.05.
Figure 4.
Figure 4.. Kinases that define tumor subtypes correspond to RNA and protein expression
Boxplots comparing log2 transformed LFQ intensities of the top 20 most differentially expressed classical (a) and basal-like (b) kinases as previously defined by limma differential expression analysis with significance determined by t-test. (c) Immunofluorescence (IF) staining of representative sections from two basal-like (orange) and two classical (blue) PDX using antibodies against a top classical (TNIK) and basal-like (EPHA2) kinase defined by their protein expression shown in magenta. DAPI nuclei staining is in blue and CK-18 staining is in green. (d) Immunoblot validation of top differentially expressed classical and basal-like kinases across all PDX tumor lysates with β-actin as a protein loading control. (e) Immunoblot for EGFR and MEK1/2 on classical and basal-like tumor lysates with β-actin and vinculin as protein loading controls. (f) IF on representative sections from PancT6 (basal-like) and P616T1 (classical) PDX tumors. Left panels are overlays of DAPI, CK-18, and α-SMA and the right panels are of EGFR (purple) and DAPI.
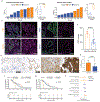
Figure 5.
Figure 5.. Subtype specific kinases display selective response to inhibition
(a) Dose-dependent growth inhibition for the TNIK inhibitor NCB-0846 comparing basal-like (P015T1) to classical (P616T1) subtype PDX-derived organoid with IC50s calculated from a 4PL curve fit. (b) Western blot for EPHA2 with EPHA2 or non-targeting (NT) control siRNA transfected in basal-like (PancT6) and classical (P713T1) subtype PDX-derived cell lines. (c) Barplots of nuclei counts for transwell invasion assays comparing NT control to EPHA2 knockdown in basal-like and classical subtype PDX cell lines with p-values determined by t-test. (d) Line plot of percent change in tumor volume across 28 days with measurements occurring twice a week for an EGFR low classical PDX (P411T1) and an EGFR high basal-like PDX (P225T1) treated with corn oil vehicle or 15 mg/kg afatinib daily by oral gavage. Boxplots comparing the BestAvgResponse of P411T1 to P225T1 for vehicle and afatinib treated PDX with p-value determined by t-test.
Figure 6.
Figure 6.. Basal-like patient response to EGFR inhibitor treatment.
(a) Barplots showing expression of two EGFR peptides in basal-like (orange) and classical (blue) patient tumors and respective boxplots comparing mean expression of EGFR peptides with significance determined by t-test. (b) IF staining of representative sections from a basal-like (orange) and classical (blue) PDAC tumor using antibodies against EGFR (purple), epithelial marker CK18 (green), and fibroblast marker α-SMA (red) with nuclear DAPI staining (blue). (c) Boxplot comparing quantitation of relative EGFR IF intensity from 4 basal-like and 10 classical tumors with significance determined by t-test. (d) Representative IHC of EGFR staining in patient tumors and corresponding scores for EGFR expression. (e) Barplot comparing EGFR scores from IHC of 17 basal-like and 19 classical patient tumors with significance determined by t-test. (f)&(g) Kaplan-Meier (KM) plots for OS in the RASH and ACCEPT trials, stratified by the tumor subtypes (basal-like vs classical) and the treatment regimen (RASH: gemcitabine plus erlotinib [G/E] vs G/E switched to FOLFIRINOX [G/E_to_FFX]; ACCEPT: gemcitabine plus afatinib [G/A] vs gemcitabine alone [G]). (h) Forest plot for hazard ratio (HR) analysis comparing regimens by subtype for each trial. Log2 transformed HR, with 95% confidence interval shown.

References

    1. SEER 5-year Relative Survival Rates, 2014-2020. [cited 2024 Nov 11]. Available from: https://seer.cancer.gov/statistics-network/explorer/application.html
    1. He J, Ahuja N, Makary MA, Cameron JL, Eckhauser FE, Choti MA, et al. 2564 resected periampullary adenocarcinomas at a single institution: trends over three decades. HPB. 2014. Jan;16(1):83–90. - PMC - PubMed
    1. Von Hoff DD, Ervin T, Arena FP, Chiorean EG, Infante J, Moore M, et al. Increased Survival in Pancreatic Cancer with nab-Paclitaxel plus Gemcitabine. N Engl J Med. 2013. Oct 31;369(18):1691–703. - PMC - PubMed
    1. Conroy T, Desseigne F, Ychou M, Bouché O, Guimbaud R, Bécouarn Y, et al. FOLFIRINOX versus gemcitabine for metastatic pancreatic cancer. N Engl J Med. 2011. May 12;364(19):1817–25. - PubMed
    1. Golan T, Hammel P, Reni M, Van Cutsem E, Macarulla T, Hall MJ, et al. Maintenance Olaparib for Germline BRCA-Mutated Metastatic Pancreatic Cancer. N Engl J Med. 2019. Jul 25;381(4):317–27. - PMC - PubMed

MeSH terms

Substances