. 2025 Mar 4;24(3):354-369.
doi: 10.1158/1535-7163.MCT-24-0501.

Denfivontinib Activates Effector T Cells Through the NLRP3 Inflammasome, Yielding Potent Anticancer Effects by Combination with Pembrolizumab

Affiliations

Denfivontinib Activates Effector T Cells Through the NLRP3 Inflammasome, Yielding Potent Anticancer Effects by Combination with Pembrolizumab

Dong Kwon Kim et al. Mol Cancer Ther. .

Abstract

Various combination therapies have been investigated to overcome the limitations of using immune checkpoint inhibitors. However, determining the optimal combination therapy remains challenging. To overcome the therapeutic limitation, we conducted a translational research to elucidate the mechanisms by which AXL inhibition enhances antitumor effects when combined with anti-PD-1 antibody therapy. Herein, we demonstrated improved antitumor effects through combination treatment with denfivontinib and pembrolizumab which resulted in enhanced differentiation into effector CD4+ and CD8+ memory T cells, accompanied by an increase in IFN-γ expression in the YHIM-2004 xenograft model derived from patients with non-small cell lung cancer. Concurrently, a reduction in the number of immunosuppressive M2 macrophages and myeloid-derived suppressor cells was observed. Mechanistically, denfivontinib potentiated the NOD-like receptor pathway, thereby facilitating NLRP3 inflammasome formation. This leads to macrophage activation via NF-κB signaling pathway activation. We have confirmed that the positive interaction between macrophages and T cells arises from the enhanced antigen-presenting machinery of activated macrophages. Furthermore, the observed tumor effects in AXL knockout mice confirmed that AXL inhibition by denfivontinib enhances the antitumor effects, thus opening new avenues for therapeutic interventions aimed at overcoming limitations in immunotherapy. To demonstrate the extent to which our findings reflect clinical results, we analyzed bulk RNA sequencing data from 21 patients with non-small cell lung cancer undergoing anti-PD-1 immunotherapy. The NLRP3 inflammasome score influenced enhanced immune responses in patient data undergoing anti-PD-1 immunotherapy, suggesting a role for the NLRP3 inflammasome in activating immune responses during treatment.


Conflict of interest statement

B.C. Cho reports personal fees from Abion, BeiGene, Novartis, AstraZeneca, Boehringer Ingelheim, Roche, Bristol Myers Squib, CJ, CureLogen, Cyrus Therapeutics, Ono, Onegene Biotechnology, Yuhan, Pfizer, Eli Lilly, GI-Cell, Guardant, HK Inno-N, Imnewrun Biosciences Inc., Janssen, Takeda, MSD, Medpacto, Blueprint Medicines, RandBio, Hanmi, Yonsei University Health System, personal fees from Kanaph Therapeutics, BridgeBio Therapeutics, Cyrus Therapeutics, Guardant Health, Oscotec Inc, J INTS Bio, Therapex Co., Ltd, Gliead, Amgen, TheraCanVac Inc, Gencurix Inc, Interpark Bio Convergence Corp., Champions Oncology, Crown Bioscience, Imagen, and PearlRiver Bio GmbH, grants from MOGAM Institute, LG Chem, Oscotec, Interpark Bio Convergence Corp, GI Innovation, GI-Cell, Abion, Abbvie, AstraZeneca, Bayer, Blueprint Medicines, Boehringer Ingelheim, Champions Onoclogy, CJ Bioscience, CJ Blossom Park, Cyrus, Dizal Pharma, Genexine, Janssen, Lilly, MSD, Novartis, Nuvalent, Oncternal, Ono, Regeneron, Dong-A ST, BridgeBio Therapeutics, Yuhan, ImmuneOncia, Illumina, Kanaph Therapeutics, Therapex, J INTS Bio, Hanmi, CHA Bundang Medical Center, and Vertical Bio AG, and other support from DAAN Biotherapeutics outside the submitted work. No disclosures were reported by the other authors.

Figures

Figure 1.
Figure 1.
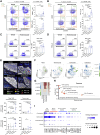
From the five PDX models, we selected the YHIM-2004 model (LUSC), which exhibited high expression of AXL, PD-L1, and genes associated with tumor growth in bulk RNA-seq data. A, The RNA expression of AXL, PD-L1, vimentin, fibronectin-1, and E-cadherin. B, AXL and PD-L1 protein expression in PDX tumor tissues (left) and quantification bar graph (right). C, YHIM-2004 and -1062 tumor model were tested with treatment of the anti–PD-L1 inhibitor, durvalumab. YHIM-2004 is a model that exhibited resistance to immunotherapy despite having a high PD-L1 expression pattern. To investigate the anticancer effects of denfivontinib on the YHIM-2004 model, we obtained immune cells from humanized mouse. D, Schematic design of an in vivo study. E, Tumor volume graph. It is noteworthy that the combination group exhibited a significant anti-tumor effect on the 11th day, whereas the denfivontinib group demonstrated this effect on the 16th day. This signifies a faster antitumor response in the combination group, attributed to the synergistic effects of the combination therapy (P < 0.05). F, For each treatment group, the mice were independently ranked by TGI. The combination group had the higher TGI rate among all the groups in the waterfall plot. These findings verify the anticancer effects of denfivontinib and the potential of combination therapy with pembrolizumab. Next, we conducted another in vivo test using NOG mice. G, There was no tumor regression when denfivontinib treatment was administered. Statistical significance between the groups was calculated using the Student t test and two-way ANOVA followed by Tukey multiple comparisons test (*, P < 0.05; **, P ≤ 0.01; ***, P ≤ 0.001; ****, P ≤ 0.0001). LUSC, lung squamous cell carcinoma; TGI, tumor growth inhibition. * Significant (vehicle vs. treatment), Φ significant (pembrolizumab vs. treatment), and ψ significant (denfivontinib vs. combination).
Figure 2.
Figure 2.
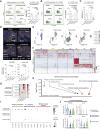
To demonstrate the T-cell activation, we analyzed the tumor-infiltrated T cells. A, The results of flow cytometry showed significant increase in CD8+ TCM and TEM cells in the combination group (P < 0.05). B, CD4+ T cells also showed similar results with CD8+ T cells. C and D, The IFN-γ expression was significantly elevated after treatment of CD4+ and CD8+ T cells (left, percent; right, MFI). Next, we analyzed the tumor tissues to evaluate the infiltrated T cells in the tissues. E, The CD8+ and CD4+ T-cell counts within the tissue exhibited a statistically significant increase. The CD8 T cell was stained with anti-CD8 antibody (indicated with the red arrow). In addition, the CD4 T cell was stained with anti-CD4 antibody (indicated with the green arrow). The cancer cell (indicated with white color) was stained with PanCK antibody. F, scRNA-seq clusters of the T cells were divided into four subclusters. G, The heatmap and cluster shape showed that denfivontinib treatment induced expansion of the C0 and C1 T cell clusters. H Gene set enrichment score analysis was conducted to find the statistically activated pathway in the C0- and C1-cluster groups. Among them, the T-cell activation–related pathways such as TCR and IL-2 family signaling were included. All the pathways were statistically significant (P < 0.05). I, T-cell activation- and differentiation-related representative genes were displayed using a dot plot. The ZAP70 and DAP12 signaling pathways imply T-cell activation signaling transduction. The IL-2 and NF-κB signaling pathways displayed effector cytokine release. The TCR signaling and effector/memory subset marker demonstrated that denfivontinib treatment has potential effects in inducing T-cell activation on the genomic levels. All statistical values of scRNA-seq were calculated between the group vs. rest. Statistical significance between the groups was calculated using the Student t test (P < 0.05). Blue color, DAPI; yellow color, GZMB. GZMB, granzyme B; TCR, T-cell receptor.
Figure 3.
Figure 3.
To evaluate the macrophage function in the TME, we analyzed the tumor-infiltrated macrophages. A, The results of flow cytometry showed significant increase in the CD80+ expressing total and M1 macrophages (P < 0.05; left, percent; right, MFI). B, The levels of HLA-DR+ total and M1 macrophages were increased after the combination treatment. C, M-MDSCs were significantly reduced due to the combination treatment (P < 0.01; left, percent; right, MFI). D, The macrophages were stained with anti-CD68 antibody (indicated with the orange arrow). The cancer cell was stained using PanCK antibody (indicated with white color). The significant increment of macrophages was evaluated in the denfivontinib group. The combination group showed similar growth patterns despite not being statistically significant. Next, we analyzed the scRNA-seq data. E, scRNA-seq clusters of macrophages were divided into nine subclusters. E and F, The heatmap and cluster shape showed that denfivontinib treatment induced the expansion of C0 and C4 macrophage clusters. H, The KEGG pathway analysis was conducted to unravel the statistically increased pathway in the C0- and C4-cluster groups. Among them, the macrophage inflammatory response–related pathway such as the NOD-like receptor signaling and TLR and NF-κB signaling pathways were included. All the pathways were statistically significant (P < 0.05). I, Representative gene set of antigen presentation and inflammatory response–associated genes. The denfivontinib cluster showed the best expression score compared with the other clusters. All genes satisfied statistical significance except NLRP3 and CASP1. Specifically, the NLRP3 inflammasome which was included in the NOD-like signaling was related to many pathways such as the TLR and NF-κB signaling pathways (P < 0.01). J, The top genes of TLR and NF-κB signaling pathways showed significant increase in the denfivontinib cluster. All statistical values of scRNA-seq were calculated between the group vs. rest. Statistical significance between the groups was calculated using the Student t test (P < 0.05). Blue color, DAPI. FSC-A, forward scatter area; KEGG, Kyoto Encyclopedia of Genes and Genomes; UMAP, Uniform Manifold Approximation and Projection for Dimension.
Figure 4.
Figure 4.
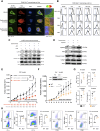
The NLRP3 inflammasome exerted an impact on tumor suppression. A, Through immune fluorescence staining, NLRP3 (in green) and ASC (in red) were measured and merged to quantify the overlapped yellow signals. When treated with denfivontinib (300 nmol/L) at 6 and 24 hours, the NLRP3–ASC complex was detected from 6 hours onward. B, Denfivontinib more robustly activated the macrophages compared with LPS (1 μg/mL) and ATP (1.5 mmol/L). C, Additionally, this effect was consistently confirmed through immunoblot assay, with an observed increase in cleaved caspase-1. D, Treatment with the NLRP3 inhibitor MCC950 suppressed denfivontinib-induced NLRP3, validating the increase in NLRP3 due to denfivontinib. E, Moreover, the anticancer effects of denfivontinib in mice inoculated with the TC1 mouse lung cancer cell line was reduced by MCC950, indicating that the expression of NLRP3 positively influenced the anticancer effects. F, A significant tumor-suppressive effect was observed in the TC1 tumors in the AXL+/− mice compared with those in the WT mice. Hence, AXL inhibition by denfivontinib induced the formation of the NLRP3 complex, enhancing immune activation. G, In the AXL+/− mice, an increase in CD8 T cells and a decrease in M2 macrophages were observed. H, Macrophages isolated from the spleens of AXL+/− mice exhibited significantly increased function compared with those of the WT macrophages, as assessed by flow cytometry after 1 week of maintenance. Statistical significance between the groups was calculated using the Student t test and two-way ANOVA followed by Tukey multiple comparisons test (*, P < 0.05; **, P ≤ 0.01; ***, P ≤ 0.001; ****, P ≤ 0.0001). Quantification of Western blot was normalized divided with actin. Casp1, caspase 1.
Figure 5.
Figure 5.
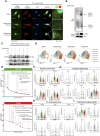
Denfivontinib induced the NLRP3 inflammasome in cancer. A, Through immune fluorescence staining, NLRP3 (in green) and ASC (in red) were measured and merged to quantify the overlapped yellow signals. When treated with denfivontinib at 6 and 24 hours, the NLRP3–ASC complex was detected from 6 hours onward. We measured the formation of the complex between NLRP3 and ASC using BN-PAGE. B, Denfivontinib induced an increase in the NLRP3 protein and enhanced oligomer formation. C, Compared with LPS and ATP, denfivontinib increased the levels of NLRP3 and ASC. D, In the scRNA-seq data of YHIM-2004, we identified seven cancer clusters, among which the C3 and C5 clusters showed increased expression. E, In the pathway analysis results of the upregulated clusters, the apoptosis and NF-κB signaling pathways were increased. F, Apoptosis pathway representative genes. G, Pyroptosis pathway representative genes. H, NF-κB pathway representative genes. I, NLRP3 inflammasome-associated genes. All statistical values of scRNA-seq were calculated between the group vs. rest. Statistical significance between the groups was calculated using the Student t test (P < 0.05). Quantification of Western blot was normalized divided with actin. GO, gene ontology; iNLRP3, NLRP3 inhibitor; UMAP, Uniform Manifold Approximation and Projection for Dimension.
Figure 6.
Figure 6.
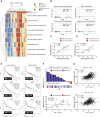
A public patient dataset was used to assess the effects of the NLRP3 inflammation score. A, GSE207422 bulk RNA-seq data was used to evaluate eight immune activation pathways compared with the inflammasome score (high and low). B, Each pathway was significantly enriched in the inflammasome-high group. C and D, The inflammasome score was positively correlated with the cell-killing and TNF-signaling scores. E, The survival of patients with pan-cancer, LUSC, and BLCA was analyzed based on AXL level using the GEPIA2 database. F, GSE126044 bulk RNA-seq data were used to predict response of immunotherapy. A lower AXL level is associated with a higher probability of being a responder. Specifically, the predicted responders exhibited a lower dysfunction score of immune cells compared with that of the nonresponders. G, In the TCGA database, a significant positive correlation was observed in the AXL dysfunction scores of the patients with LUSC and LUAD. This indicates that the immune cell function is activated due to AXL inhibition. All statistical values of bulk RNA-seq were calculated between the group vs. group. Statistical significance between the groups was calculated using the Student t test (P < 0.05). GEO, Gene Expression Omnibus, GEPIA2, Gene Expression Profiling Interactive Analysis 2; LUAD, lung adenocarcinoma; LUSC, lung squamous cell carcinoma; TCGA, The Cancer Genome Atlas.

References

    1. Bray F, Ferlay J, Soerjomataram I, Siegel RL, Torre LA, Jemal A. Global cancer statistics 2018: GLOBOCAN estimates of incidence and mortality worldwide for 36 cancers in 185 countries. CA Cancer J Clin 2018;68:394–424. - PubMed
    1. Lahiri A, Maji A, Potdar PD, Singh N, Parikh P, Bisht B, et al. . Lung cancer immunotherapy: progress, pitfalls, and promises. Mol Cancer 2023;22:40. - PMC - PubMed
    1. Lee W, Kim DK, Synn CB, Lee HK, Park S, Jung DS, et al. . Incorporation of SKI-G-801, a novel AXL inhibitor, with anti-PD-1 plus chemotherapy improves anti-tumor activity and survival by enhancing T cell immunity. Front Oncol 2022;12:821391. - PMC - PubMed
    1. Synn CB, Kim SE, Lee HK, Kim MH, Kim JH, Lee JM, et al. . SKI-G-801, an AXL kinase inhibitor, blocks metastasis through inducing anti-tumor immune responses and potentiates anti-PD-1 therapy in mouse cancer models. Clin Transl Immunology 2022;11:e1364. - PMC - PubMed
    1. Villalobos P, Wistuba II. Lung cancer biomarkers. Hematol Oncol Clin North Am 2017;31:13–29. - PMC - PubMed

MeSH terms

Substances