. 2024 Dec 4;15(12):878.
doi: 10.1038/s41419-024-07266-5.

Colorectal cancer patients-derived immunity-organoid platform unveils cancer-specific tissue markers associated with immunotherapy resistance

Affiliations

Colorectal cancer patients-derived immunity-organoid platform unveils cancer-specific tissue markers associated with immunotherapy resistance

A Esposito et al. Cell Death Dis. .

Abstract

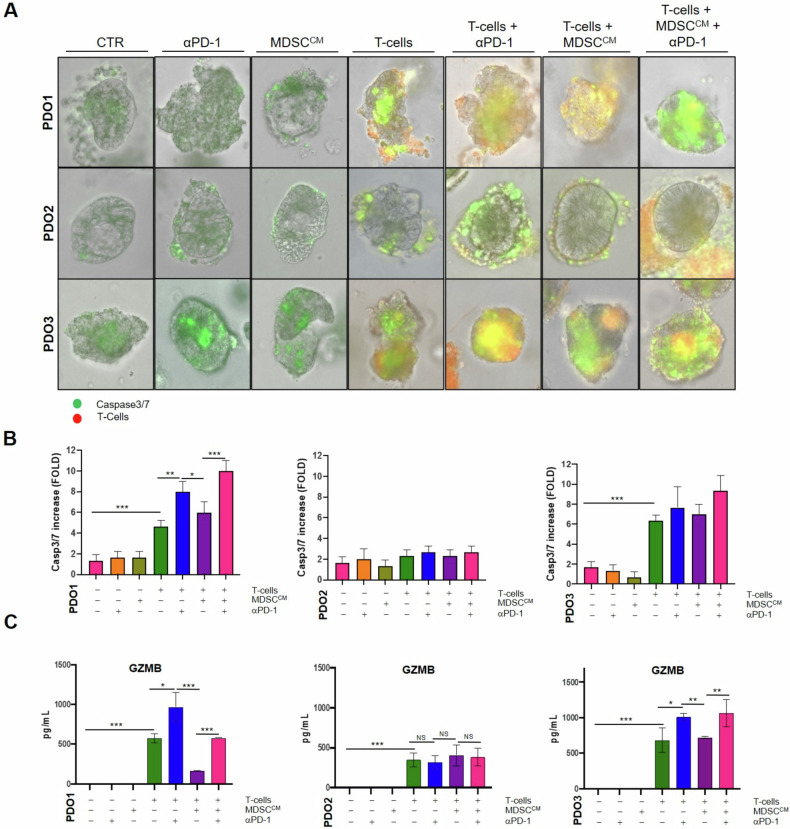
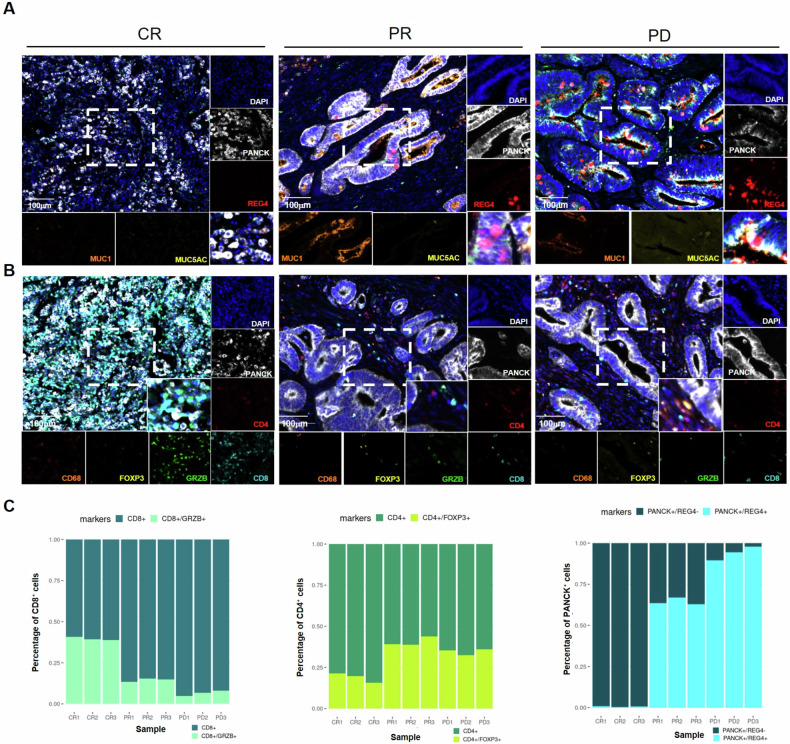
Colorectal cancer (CRC) is a devastating disease, ranking as the second leading cause of cancer-related deaths worldwide. Immune checkpoint inhibitors (ICIs) have emerged as promising treatments; however, their efficacy is largely restricted to a subgroup of microsatellite instable (MSI) CRCs. In contrast, microsatellite stable (MSS) CRCs, which account for the majority of cases, exhibit variable and generally weaker response to ICIs, with only a subset demonstrating exceptional responsiveness. Identifying novel cancer-specific tissue (CST) markers predictive of immunotherapy response is crucial for refining patient selection and overcoming treatment resistance. In this study, we developed clinically relevant CRC organoids and autologous immune system interaction platforms to model ICI response. We conducted a comprehensive molecular characterization of both responder and non-responder models, identifying CST markers that predict ICI response. Validation of these findings was performed using an independent cohort of patient specimens through multiplex immunofluorescence. Furthermore, we demonstrated that knocking out a key gene from the identified predictive signature in resistant organoids restored immune sensitivity and induced T-cell-mediated apoptosis. Overall, our results provide novel insights into the mechanisms underlying immunotherapy resistance and suggest new markers for enhancing patient selection. These findings may pave the way for new therapeutic options in MSS patients, potentially broadening the cohort of individuals eligible for immunotherapy.


Conflict of interest statement

Competing interests: The authors declare no competing interests. Ethics approval and consent to participate: Informed consent was obtained from all subjects. The experimental protocol was approved by the local ethics committee (Fondazione Policlinico Gemelli IRCCs, Ethical Committee approval Prot. 8711/20) and followed EU regulations.

Figures

Fig. 1
Fig. 1. Assessment of immune infiltration in tissue samples from MSI and MSS CRC patients.
A Immunohistochemical staining of CD3, CD4, CD8, CD68 and Ki-67 in CRC tissues showed the presence of T-cells populations (CD4+, CD8+) and macrophages (CD68+) in MSI and MSS patients. Ki-67 was used as a control proliferation marker of tumor cells; (B) Quantification of positive cells/area was performed with QuPath Software. Significance shown refers to Wilcoxon test p-values *< 0.05, **< 0.01, ***< 0.001.
Fig. 2
Fig. 2. PDOs recapitulate the histopathological and genomics characteristics of their primary tumors.
A Immunohistochemical staining of CRC specific markers (CDX2, CK20, Ki-67, LGR5) confirmed matching between organoids (PDO) and tissue samples (CRC). B Lower panel, Oncoplot showing the top 25 mutated genes in PDOs and matched samples identified by WES. Upper panel, bar plot shows the tumor mutational burden (TMB). C The Bar plot displays the ratios of immune cell populations, determined using the immunedeconv package with the quantiseq algorithm. D Dotplots showing the immunodeconvolution scores for CD8+ T-cells and Cytotoxicity estimated with the Microenvironment Cell Populations (MCP) counter algorithm.
Fig. 3
Fig. 3. PDOs showed different sensitivity to T-cells in ex vivo interaction platform according to cytotoxicity score.
A Immunity-organoid interaction platforms with patient-matched T-cells, MDSCs and PDOs in absence or in presence of pembrolizumab (anti-PD-1). Caspase 3/7 activation was measured by Cell Event Caspase 3/7 Green ReadyProbes Reagent (Invitrogen) fluorescence to evaluate apoptosis induction with Evos FL Auto 2 (Thermo Fisher Scientific) and (B) measured with ImageJ-Fiji Software. C T-cells’ GZMB release was evaluated by Luminex XMAP technology and correlates with the measured apoptosis induction. Significance shown refers to Kruskal-Wallis test p-values *< 0.05, **< 0.01, ***< 0.001.
Fig. 4
Fig. 4. Transcriptomics analysis.
Volcano plot showing differentially expressed genes between (A) PDO1 and PDO2 and (B) PDO3 and PDO2. C Venn Diagram showing common differentially expressed genes in PDO1 (MSI) and PDO3 (MSS Responder) compared to PDO2 (MSS Non-Responder). D Network Plot showing the role of REG4 as hub gene in the common downregulated genes. E Heatmap showing expression of REG4 oncogenic signature in PDOs and parental tissues. F Plot showing the correlation between REG4 signature genes and T- and NK- cells infiltration and cytotoxicity score estimated by immunodeconvolution in a TCGA CRC patient cohort.
Fig. 5
Fig. 5. Multiplex immunofluorescence analysis validated REG4 as immunotherapy resistance marker in MSI CRC patient cohort.
Adenocarcinoma (NOS) tissues from MSI CRC patients who achieved a complete response (CR), a partial response (PR) or experienced disease progression (PD) after immunotherapy were analyzed by multiplex immunofluorescence to investigate (A) PANCK (white), REG4 (red), MUC1 (orange) and MUC5AC (yellow) expression or (B) PANCK (white), CD4 (red), CD8 (cyan), GZMB (green), FOXP3 (yellow), CD68 (orange). C Graphs showed the percentage of CD8+ GZMB+/CD8+ T-cells (dark turquoise), CD4+ FOXP3+/CD4+ T-cells (green) and PANCK+ REG4+ /PANCK+ cells (blue) in both Mucinous and NOS adenocarcinomas.
Fig. 6
Fig. 6. REG4 knock-out restored immune sensitivity.
A REG4KO in PDO31 was assessed through both RT-PCR and IHC analysis. Significance shown refers to One-way ANOVA test p-values ***< 0.001. B PD-IOs interaction platforms with patient-matched T-cells and wild-type (WT) or REG4KO PDOs in absence or in presence of pembrolizumab (antiPD-1). Caspase 3/7 activation was measured by Cell Event Caspase 3/7 Green ReadyProbes Reagent fluorescence to evaluate apoptosis induction with Evos FL Auto 2 and (C) measured with ImageJ-Fiji Software. Significance shown refers to One-way ANOVA test p-values ****< 0.0001.

References

    1. Siegel RL, Wagle NS, Cercek A, Smith RA, Jemal A. Colorectal cancer statistics, 2023. CA Cancer J Clin. 2023;73:233–54. - PubMed
    1. Siegel RL, Giaquinto AN, Jemal A. Cancer statistics, 2024. CA Cancer J Clin. 2024;74:12–49. - PubMed
    1. Vilar E, Gruber SB. Microsatellite instability in colorectal cancer—the stable evidence. Nat Rev Clin Oncol. 2010;7:153–62. - PMC - PubMed
    1. Müller MF, Ibrahim AEK, Arends MJ. Molecular pathological classification of colorectal cancer. Virchows Arch. 2016;469:125–34. - PMC - PubMed
    1. Mei W-J, Mi M, Qian J, Xiao N, Yuan Y & Ding P-R. Clinicopathological characteristics of high microsatellite instability/mismatch repair-deficient colorectal cancer: A narrative review. Front Immunol. 2022;13. 10.3389/fimmu.2022.1019582. - PMC - PubMed

MeSH terms

Substances

LinkOut - more resources