. 2024 Dec 5;15(1):10593.
doi: 10.1038/s41467-024-54848-0.

Dynamics of the blood plasma proteome during hyperacute HIV-1 infection

Affiliations

Dynamics of the blood plasma proteome during hyperacute HIV-1 infection

Jamirah Nazziwa et al. Nat Commun. .

Abstract

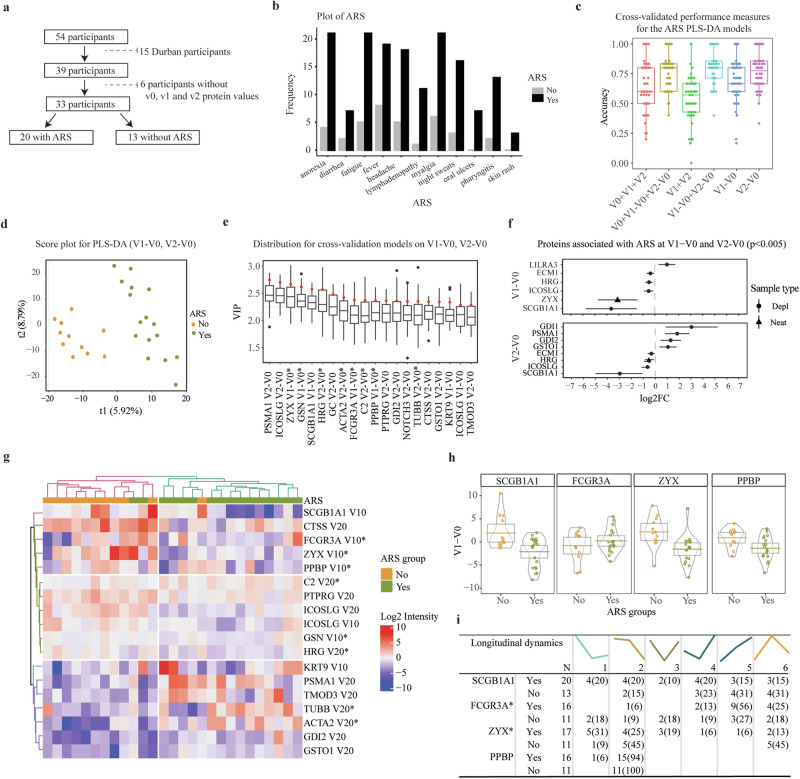
The complex dynamics of protein expression in plasma during hyperacute HIV-1 infection and its relation to acute retroviral syndrome, viral control, and disease progression are largely unknown. Here, we quantify 1293 blood plasma proteins from 157 longitudinally linked plasma samples collected before, during, and after hyperacute HIV-1 infection of 54 participants from four sub-Saharan African countries. Six distinct longitudinal expression profiles are identified, of which four demonstrate a consistent decrease in protein levels following HIV-1 infection. Proteins involved in inflammatory responses, immune regulation, and cell motility are significantly altered during the transition from pre-infection to one month post-infection. Specifically, decreased ZYX and SCGB1A1 levels, and increased LILRA3 levels are associated with increased risk of acute retroviral syndrome; increased NAPA and RAN levels, and decreased ITIH4 levels with viral control; and increased HPN, PRKCB, and ITGB3 levels with increased risk of disease progression. Overall, this study provides insight into early host responses in hyperacute HIV-1 infection, and present potential biomarkers and mechanisms linked to HIV-1 disease progression and viral load.


Conflict of interest statement

Competing interests: The authors declare no competing interests.

Figures

Fig. 1
Fig. 1. Characteristics of the study participants.
The flowchart outlines the longitudinal sampling and proteomic workflow employed in the study. Fifty-four individuals from two distinct geographical regions provided three matched samples each. Plasma samples were prepared both with and without depletion of the top 14 most abundant proteins. These samples were then analyzed using Data-Independent Acquisition (DIA)/SWATH LC-MS/MS. Arrows indicate the flow of samples through each stage of processing, including plasma preparation, mass spectrometry analysis, and subsequent computational analyses, which were used to explore protein dynamics over time. Abbreviations: V0 visit 0 (collected before estimated date of infection), V1 visit 1 (collected 10–14 days post estimated date of infection), V2 visit 2 (collected 15–42 days before estimated date of infection), IAVI International AIDS Vaccine Initiative, SA South Africa, KE Kenya, DIA data-independent acquisition, SWATH sequential window acquisition of all theoretical mass spectra, MS mass spectrometry.
Fig. 2
Fig. 2. Acute HIV-1 infection alters the human plasma proteome.
Longitudinal protein expression profiles were investigated during hAHI. A comprehensive analysis of 83,643 protein combination values from all three-time points was conducted across 54 study participants, resulting in a total of 1336 profiles. a To identify the optimal clusters representing the longitudinal expression profiles for different groups, the elbow method was employed, leading to identification of six distinct clusters. These clusters were color-coded and plotted, with the x-axis denoting the visit number and the y-axis representing the scaled log-intensity per patient. b Bar plot illustrating the comparison in the number of differentially expressed proteins across visit differences. The height of each bar corresponds to the number of proteins while the bar color varies depending on the visit difference. c Forest plots indicating effect sizes (log2 fold change) and 95% confidence intervals for proteins significantly differentially expressed at 2 weeks and 1 month post estimated date of infection (EDI), relative to pre-infection levels (V1-V0 and V2-V0, respectively), as well as the difference between 2 weeks and 1 month post EDI (V2-V1). Effect sizes are shown in red for the Durban cohort, and blue for the IAVI cohort. Circles and triangles indicate depleted (depl) and neat plasma, respectively. The statistical analysis was conducted using linear mixed-effects models with a random intercept for each patient, treating visit number as a categorical variable. The differential protein expression was assessed using a global ANOVA, with post hoc tests identifying specific visit comparisons (e.g., V0 vs. V1, V0 vs. V2, and V1 vs V2). The Benjamini-Hochberg’s FDR method with a 5% FDR threshold was used to correct for multiple testing, with a fixed p-value cut-off of 0.005. d, e Circos plots visualizing the differentially expressed proteins from different visit differences in a circular layout. The lower ring represents the GO-biological processes associated with the proteins belong to, with each process color-coded for easy identification. The upper rings depict specific classification of these proteins, with proteins secreted in blood shown in orange and the tissue leakage proteins shown in gray. Abbreviations: V0 visit 0 (collected before estimated date of infection); V1 visit 1 (collected 10–14 days post estimated date of infection); V2 visit 2 (collected 15–42 days before estimated date of infection); V1–V0 difference between visit V1 and V0; V2–V0 difference between visit V2 and V0; V2–V1 difference between visit V2 and V1; Log2FC log 2-fold change. Source data are provided as a Source Data file.
Fig. 3
Fig. 3. Zyxin, Secretoglobin family 1A member 1, and Leukocyte immunoglobulin-like receptor subfamily A member 3 are associated with ARS.
a Flow chart representing the total number of samples used in ARS classification and the exclusion criteria. b Bar graph comparing the distribution of AHI symptoms between participants that were defined to be with and without ARS (N = 33). ARS was defined based on 11 AHI symptoms, and unobserved linkages between symptoms using Latent Class Analysis. Incremental latent group models were assessed to predict the goodness of fit. The model with two latent groups was the best fit, with the lowest BIC value (660.5) compared to three (678.6), four (699.2), or five (714.7) groups. Study participants were grouped based on their predicted posterior probabilities into those with ARS (N = 20/33 (60%)) and those without ARS (13/33 (40%)). c Box plots displaying the results of the cross-validated performance measure (accuracy) for the ARS PLS-DA models based on the following datasets: V0 + V1 + V2; V0 + V1-V0 + V2-V0; V1 + V2; V1-V0 + V2-V0; V1-V0; and V2-V0. The models were trained to predict ARS “Yes” or “No” and evaluated in 10 5-fold cross-validations, resulting in 50 individual accuracy values from 50 test sets. Each boxplot shows the distribution of accuracy values across 50 cross-validation models. The center line within the box represents the median, the box bounds the interquartile range, and the whiskers the minimum and maximum values of 1.5 × IQR beyond the box. Any data points beyond these are considered outliers, and shown as individual points. d Score plot based on the V1-V0 + V2-V0 dataset (with the highest accuracy value) from (c), indicating the group membership of each sample. There was clear discrimination between the ARS-No (orange) and the ARS-Yes (green) samples on the first (x-axis) and second components (y-axis). Axis labels indicate the percentage of variation explained per component. e Boxplot showing the variable importance in projection (VIP) scores in the PLS-DA model based on V1-V0 or V2-V0 for each protein. The VIP score summarizes the contribution a variable (protein) makes to the model. This plot identifies the most important proteins for the classification of ARS “Yes” or “No”. Proteins with high VIPs are more important in providing class separation. Black points represent the full model, and the boxplots indicate the distributions of 10 cross-validation models. The sample size corresponds to the 50 VIP scores computed for each protein across the 50 cross-validation models. The center line within the box represents the median, the box bounds the interquartile range, and the whiskers the minimum and maximum values of 1.5 × IQR beyond the box. Any data points beyond these are considered outliers, and shown as individual points. Red dots represent the VIP scores for the full PLS-DA model, capturing the importance of each protein feature in the model’s ability to discriminate between groups. These points reflect the average or specific metric of the VIP values used to build the full model. f Forest plots indicating effect sizes (log2 fold change) and 95% confidence intervals for proteins significantly differentially expressed at 2 weeks and 1 month post estimated date of infection (EDI), relative to pre-infection levels (V1-V0 and V2-V0, respectively). Only individuals from the IAVI cohort were included since ARS data are only available for this cohort. Circles and triangles indicate depleted (depl) and neat plasma, respectively. The statistical analysis was conducted using linear mixed-effects models with a random intercept for each patient, treating visit number as a categorical variable. The differential protein expression was assessed using a global ANOVA, with post hoc tests identifying specific visit comparisons (e.g., V0 vs. V1, V0 vs. V2, and V1 vs V2). The Benjamini-Hochberg’s FDR method with a 5% FDR threshold was used to correct for multiple testing, with a fixed p-value cut-off of 0.005. g Heatmap of proteins associated with ARS based on hierarchical clustering of the V1-V0 and V2-V0 expression of the selected proteins. The heatmap provides a visual representation of coordinated changes of the proteins identified through PLS-DA and linear regression in relation to ARS status. h Pirate plots showing the V1–V0 protein expression for the top proteins between those with and without ARS. i Table representing the longitudinal protein expression profiles for the top proteins associated with ARS. For each profile and protein, the number (%) of patients with or without ARS were recorded. Abbreviations: ARS acute retroviral syndrome, PLS-DA Partial Least Squares Discriminant Analysis, V0 visit 0 (collected before estimated date of infection), V1 visit 1 (collected 10–14 days post estimated date of infection), V2 visit 2 (collected 15–42 days before estimated date of infection), V1-V0 difference between visit V1 and V0, V2–V0 difference between visit V2 and V0, V2–V1 difference between visit V2 and V1, VIP variable importance in projection, Log2FC log 2-fold change. The asterisk (*) appended to the end of certain protein names indicates proteins detected in neat plasma, while proteins without an asterisk were identified in depleted plasma samples. Source data are provided as a Source Data file.
Fig. 4
Fig. 4. Alpha-soluble NSF attachment protein, GTP-binding nuclear protein Ran, and Inter-alpha-trypsin inhibitor heavy chain are associated with HIV-1 control.
a Flow chart illustrating the total number of samples used in viral control classification, along with the exclusion criteria. b Longitudinal viral load measures against the number of days post the estimated date of infection (EDI) for all 54 participants. The color-coded boxplots represent the distribution of peak viral load, nadir viral load, days to peak viral load, and days to nadir viral load across the 54 individuals. The center line within the box represents the median, the box bounds the interquartile range, and the whiskers the minimum and maximum values of 1.5× IQR beyond the box. c Dendrogram showcasing complete linkage hierarchical clustering of viral load profiles. Euclidean distances computed from the cubic spline predicted viral load at evenly spread (on transformed scale) time points were used for clustering. The optimal number of clusters was determined using the Silhouette value, and the clustering significance was calculated using multiscale bootstrap resampling. Viral load clusters were based on time 1–12 months (30–364 days). Two distinct groups were classified: No viral control (in green) and sustained viral control (in brown). d Plot representing the cubic spline predicted viral load at evenly spread time points. The differentiation between the two viral control groups occurred at a viral load threshold of 10,000 copies/ml. e Heatmap illustrating associations between viral control and various demographic parameters and ARS symptoms. f Forest plots indicating effect sizes (log2 fold change) and 95% confidence intervals for proteins significantly differentially expressed at 2 weeks and 1 month post estimated date of infection (EDI), relative to pre-infection levels (V1-V0 and V2-V0, respectively), as well as the difference between 2 weeks and 1 month post EDI (V2-V1). Circles and triangles indicate depleted (depl) and neat plasma, respectively. The statistical analysis was conducted using linear mixed-effects models with a random intercept for each patient, treating visit number as a categorical variable. The differential protein expression was assessed using a global ANOVA, with post hoc tests identifying specific visit comparisons (e.g., V0 vs. V1, V0 vs. V2, and V1 vs V2). The Benjamini-Hochberg’s FDR method with a 5% FDR threshold was used to correct for multiple testing, with a fixed p-value cut-off of 0.005. Abbreviations: ART antiretroviral treatment, EDI estimated date of infection, ARS acute retroviral syndrome, DC discordant couple, HET heterosexual, MSM men who have sex with men, V0 visit 0 (collected before estimated date of infection), V1 visit 1 (collected 10–14 days post estimated date of infection), V2 visit 2 (collected 15–42 days before estimated date of infection), V1–V0 difference between visit V1 and V0, V2–V0 difference between visit V2 and V0, V2–V1 difference between visit V2 and V1, Log2FC log 2-fold change. The asterisk (*) appended to the end of certain protein names indicates proteins detected in neat plasma, while proteins without an asterisk were identified in depleted plasma samples. Source data are provided as a Source Data file.
Fig. 5
Fig. 5. Hepsin, Protein kinase C beta, and Integrin subunit beta 3 are associated with an increased risk of disease progression.
Forest plots indicating hazard ratios (HR) and 95% confidence intervals for proteins differentially expressed at 2 weeks and 1 month post estimated date of infection (EDI), relative to pre-infection levels (V1-V0 and V2-V0, respectively), as well as the difference between 2 weeks and 1 month post EDI (V2-V1). The Cox proportional hazards model was used to determine the association between plasma protein expression (independent variable) and the risk of disease progression. The event outcome was defined as CD4 + T-cell counts of 500 cells/µl from 6 weeks post the estimated date of infection. Covariates included age, sex, and cohort. Circles and triangles indicate depleted (depl) and neat plasma, respectively. Abbreviations: V0 visit 0 (collected before estimated date of infection), V1 visit 1 (collected 10–14 days post estimated date of infection), V2 visit 2 (collected 15–42 days before estimated date of infection), V1–V0 difference between visit V1 and V0, V2–V0 difference between visit V2 and V0, V2–V1 difference between visit V2 and V1. Source data are provided as a Source Data file.
Fig. 6
Fig. 6. Longitudinal dynamics during hyperacute HIV-1 infection of key differentially expressed proteins associated with ARS, viral load, and disease progression.
This schematic illustrates the temporal changes in expression for proteins associated with ARS, viral load, and disease progression during acute phase of HIV-1 infection. Protein expression levels were assessed both before infection, and within the two to 6 weeks following infection in the 54 study participants. Participants were categorized into subgroups based on various outcomes, including ARS (presence or absence), viral control status (controllers or non-controllers), and the rate of disease progression (fast or slow). The x-axis of the graph represents the time in days following infection when plasma samples were collected, while the y-axis represents the mean protein expression levels relative to the pre-infection baseline. Key proteins associated with ARS, viral control and disease progression are depicted using smoothed lines generated through local regression plotting with a span of 1.5. The selected proteins represented the top proteins associated with ARS, viral load, and disease progression. To enhance clarity and highlight distinctive patterns, proteins with similar dynamics in the group comparisons were excluded. Abbreviations: ARS acute retroviral syndrome.

References

    1. Zhong, W. et al. Whole-genome sequence association analysis of blood proteins in a longitudinal wellness cohort. Genome Med.12, 53 (2020). - PMC - PubMed
    1. Captur, G. et al. Plasma proteomic signature predicts who will get persistent symptoms following SARS-CoV-2 infection. eBioMedicine85, 10.1016/j.ebiom.2022.104293 (2022). - PMC - PubMed
    1. Palma Medina, L. M. et al. Targeted plasma proteomics reveals signatures discriminating COVID-19 from sepsis with pneumonia. Respir. Res.24, 62 (2023). - PMC - PubMed
    1. Al-Nesf, M. A. Y. et al. Prognostic tools and candidate drugs based on plasma proteomics of patients with severe COVID-19 complications. Nat. Commun.13, 946 (2022). - PMC - PubMed
    1. Cohen, M. S., Shaw, G. M., McMichael, A. J. & Haynes, B. F. Acute HIV-1 infection. N. Engl. J. Med.364, 1943–1954 (2011). - PMC - PubMed

Publication types