. 2024 Dec 4;15(1):10579.
doi: 10.1038/s41467-024-54803-z.

The capicua-ataxin-1-like complex regulates Notch-driven marginal zone B cell development and sepsis progression

Affiliations

The capicua-ataxin-1-like complex regulates Notch-driven marginal zone B cell development and sepsis progression

Jong Seok Park et al. Nat Commun. .

Abstract

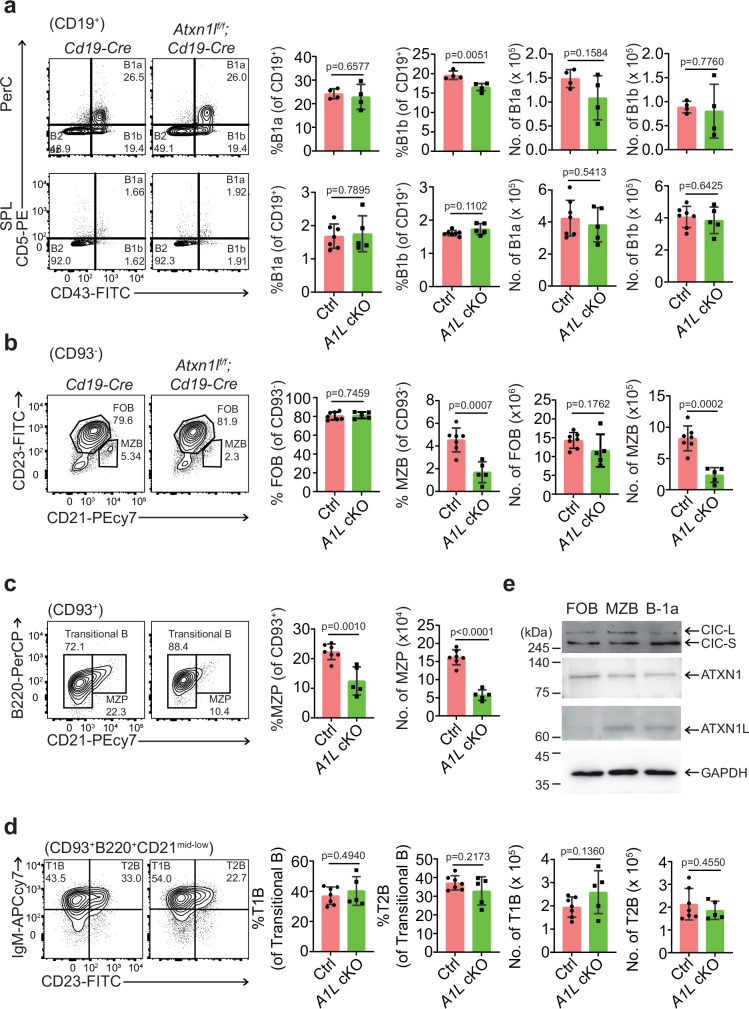
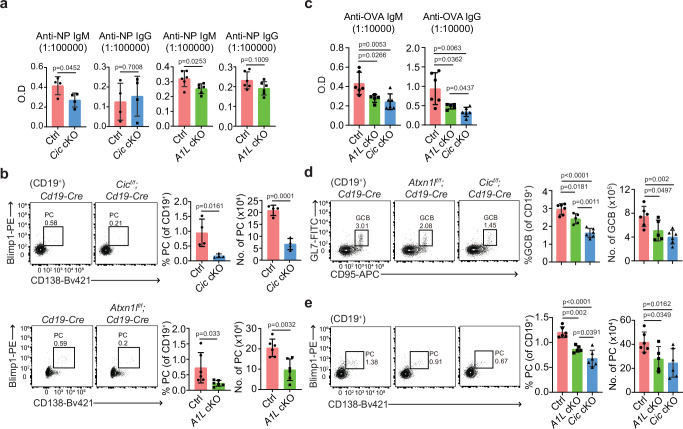
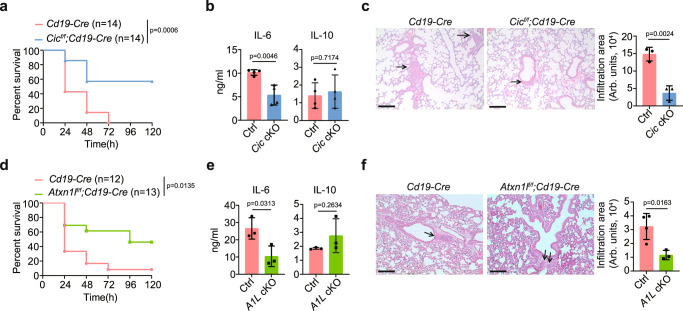
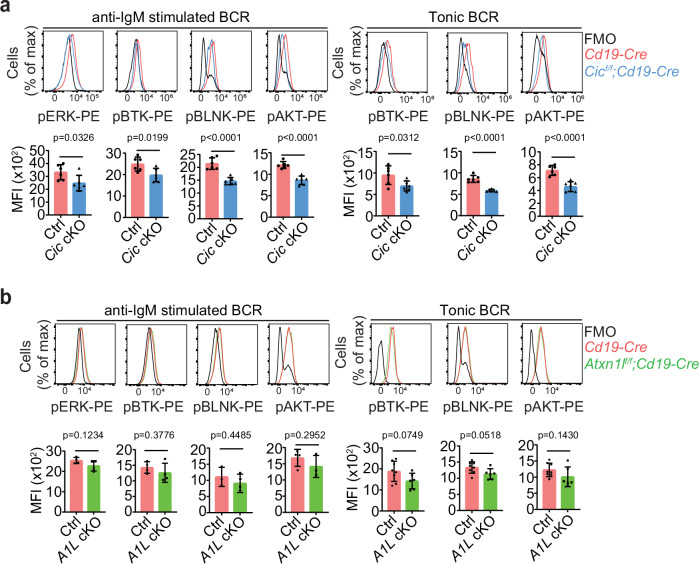
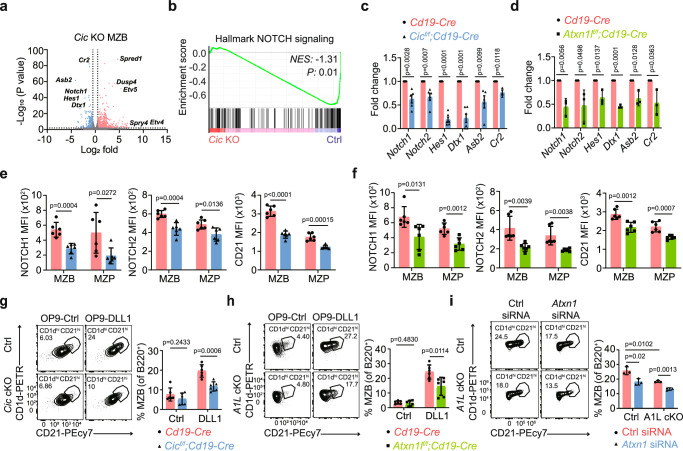
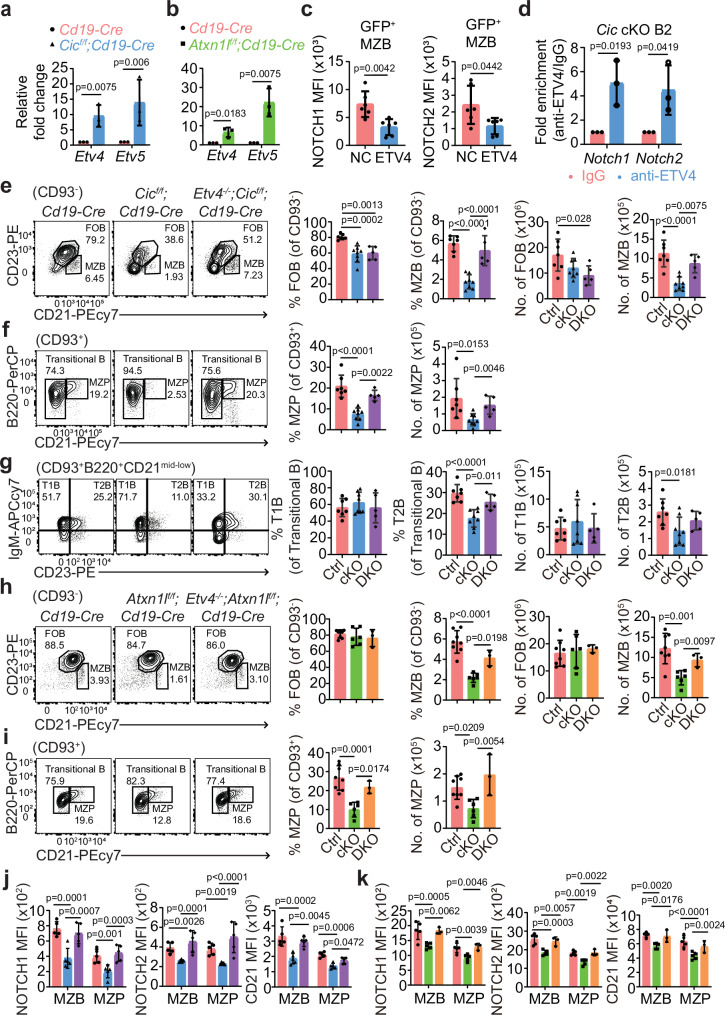
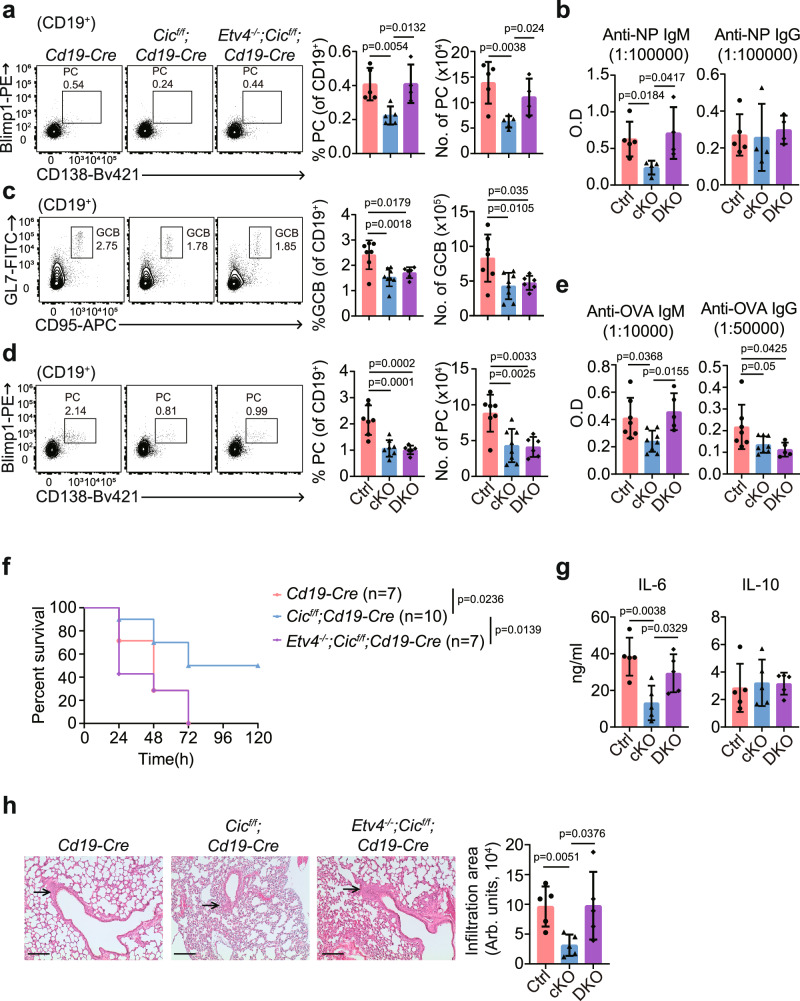
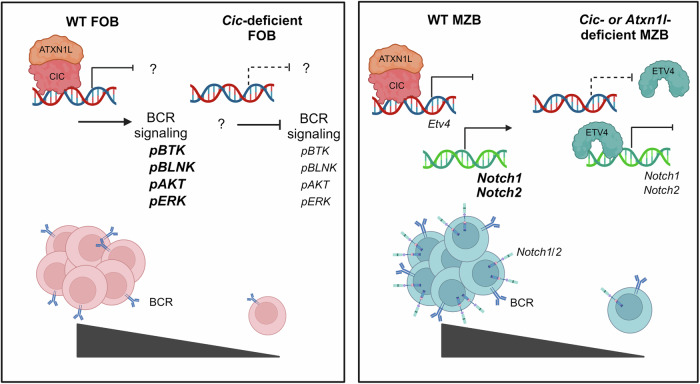
Follicular B (FOB) and marginal zone B (MZB) cells are pivotal in humoral immune responses against pathogenic infections. MZB cells can exacerbate endotoxic shock via interleukin-6 secretion. Here we show that the transcriptional repressor capicua (CIC) and its binding partner, ataxin-1-like (ATXN1L), play important roles in FOB and MZB cell development. CIC deficiency reduces the size of both FOB and MZB cell populations, whereas ATXN1L deficiency specifically affects MZB cells. B cell receptor signaling is impaired only in Cic-deficient FOB cells, whereas Notch signaling is disrupted in both Cic-deficient and Atxn1l-deficient MZB cells. Mechanistically, ETV4 de-repression leads to inhibition of Notch1 and Notch2 transcription, thereby inhibiting MZB cell development in B cell-specific Cic-deficient (Cicf/f;Cd19-Cre) and Atxn1l-deficient (Atxn1lf/f;Cd19-Cre) mice. In Cicf/f;Cd19-Cre and Atxn1lf/f; Cd19-Cre mice, humoral immune responses and lipopolysaccharide-induced sepsis progression are attenuated but are restored upon Etv4-deletion. These findings highlight the importance of the CIC-ATXN1L complex in MZB cell development and may provide proof of principle for therapeutic targeting in sepsis.


Conflict of interest statement

Competing interests: The authors declare no competing interests.

Figures

Fig. 1
Fig. 1. ATXN1L deficiency specifically reduces MZP and MZB cell populations.
a Flow cytometry of B-1a (CD19+CD5+CD43+) and B-1b (CD19+CD5-CD43+) cells in the peritoneal cavities and spleens of Cd19-Cre and Atxn1lf/f;Cd19-Cre mice. For peritoneal cavity analysis, N = 5 per both mice. For spleen analysis, N = 7 for Cd19-Cre and N = 5 for Atxn1lf/f;Cd19-Cre mice. Flow cytometry of FOB and MZB cells (b), MZP cells (c), and T1B and T2B cells (d) in the spleens of Cd19-Cre and Atxn1lf/f;Cd19-Cre mice. FOB (CD19+CD93-CD21intCD23+) and MZB (CD19+CD93-CD21highCD23lo) cells were initially gated as CD93- (AA4.1). T1B (CD19+CD93+B220+CD21loCD23-IgM+), T2B (CD19+CD93+B220+CD21midCD23+IgM+), and MZP (CD19+CD93+CD21high) cells were gated as CD93+ (AA4.1). N = 7 for Cd19-Cre and N = 5 for Atxn1lf/f;Cd19-Cre. e Western blotting to detect the levels of CIC, ATXN1, and ATXN1L in FOB, MZB, and B-1a cells. FOB and MZB cells were prepared from the spleens of C57BL/6 mice, whereas B-1a cells were isolated from the peritoneal cavities of the same mice. Data represent 2–3 independent experiments. Statistics: two-tailed Student’s t-test (ad). Bar graphs present the data as mean ± S.D. Ctrl: Cd19-Cre and A1L cKO: Atxn1lf/f;Cd19-Cre. MZP marginal zone progenitor cells, MZB marginal zone B cells, and FOB follicular B cells. Source data are provided as a Source Data file.
Fig. 2
Fig. 2. Humoral immune responses are attenuated in Cicf/f;Cd19-Cre and Atxn1lf/f;Cd19-Cre mice.
a, b Cd19-Cre, Cicf/f;Cd19-Cre, and Atxn1lf/f;Cd19-Cre mice were immunized with NP-Ficoll for 7 days. a Serum NP-specific IgM and IgG levels determined using ELISA. b Flow cytometry of splenic plasma cells. N = 4 for Cd19-Cre and Cicf/f;Cd19-Cre groups, and N = 6 for Cd19-Cre and Atxn1lf/f;Cd19-Cre groups. ce Cd19-Cre, Cicf/f;Cd19-Cre, and Atxn1lf/f;Cd19-Cre mice were immunized with OVA in alum for 7 days. c Serum OVA-specific IgM and IgG levels determined using ELISA. d, e Flow cytometry of splenic GCB cells (CD19+GL-7+CD95+) (d) and plasma cells (CD19+CD138+Blimp1+) (e). N = 6 for Cd19-Cre and Cicf/f;Cd19-Cre, and N = 5 for Atxn1lf/f;Cd19-Cre. Data represent two independent experiments. Statistics: two-tailed Student’s t-test (a, b) and one-way ANOVA with Tukey’s multiple comparisons test (ce). Bar graphs present data as mean ± S.D. Ctrl: Cd19-Cre, Cic cKO: Cicf/f;Cd19-Cre, and A1L cKO: Atxn1lf/f;Cd19-Cre. ELISA enzyme-linked immunosorbent assay, OVA ovalbumin, and GCB germinal center B cells. Source data are provided as a Source Data file.
Fig. 3
Fig. 3. LPS-induced sepsis progression is attenuated in Cicf/f;Cd19-Cre and Atxn1lf/f;Cd19-Cre mice.
ac Female Cd19-Cre and Cicf/f;Cd19-Cre mice were injected intravenously with LPS. Serum samples and lung tissues were collected from Cd19-Cre and Cicf/f;Cd19-Cre mice 12 h after LPS injection. a Survival rate of LPS-treated mice. Mortality was monitored every 24 h. N = 14 per group. b Serum IL-6 and IL-10 levels determined using ELISA. N = 4 per group. c Histology of immune cell infiltration into lung tissue. Arrows indicate immune cell-infiltrated regions. N = 3 per group. Scale bar: 100 µm. df Female Cd19-Cre and Atxn1lf/f;Cd19-Cre mice were injected intravenously with LPS. Serum samples and lung tissues were collected from Cd19-Cre and Atxn1lf/f;Cd19-Cre mice 12 h after LPS injection. d Survival rate of LPS-treated mice. Mortality was monitored every 24 h. N = 12 for Cd19-Cre and N = 13 for Atxn1lf/f;Cd19-Cre. e Serum IL-6 and IL-10 levels determined using ELISA. N = 3 per group. f Histology of immune cell infiltration into lung tissue. Arrows indicate immune cell-infiltrated regions. N = 4 for Cd19-Cre and N = 3 for Atxn1lf/f;Cd19-Cre. Scale bar: 100 µm. Data represent 2–3 independent experiments. Statistics: Log-rank (Mantel-Cox) test (a, d) and two-tailed Student’s t-test (b, c, e, f). Bar graphs present data as mean ± S.D. Ctrl: Cd19-Cre, Cic cKO: Cicf/f;Cd19-Cre, and A1L cKO: Atxn1lf/f;Cd19-Cre. LPS lipopolysaccharide, IL interleukin, and ELISA enzyme-linked immunosorbent assay. Source data are provided as a Source Data file.
Fig. 4
Fig. 4. BCR signaling is attenuated in Cic-null FOB cells.
Analysis of anti-IgM-stimulated and tonic BCR signaling in Cic-null (a) and Atxn1l-null (b) FOB cells. Phosphorylated-ERK (pERK), phosphorylated-BTK (pBTK), phosphorylated-BLNK (pBLNK), and phosphorylated-AKT (pAKT) levels were determined using flow cytometry and presented as MFI. For the BCR signaling analysis in control and Cic-null FOB cells, N = 6 per group (a). For the analysis of pERK and pBTK levels in control and Atxn1l-null FOB cells stimulated with anti-IgM, N = 4 per group (b). For the analysis of pBLNK levels in control and Atxn1l-null FOB cells stimulated with anti-IgM, N = 3 per group (b). For the analysis of pAKT levels in control and Atxn1l-null FOB cells stimulated with anti-IgM, N = 4 for Cd19-Cre and N = 3 for Atxn1lf/f;Cd19-Cre (b). For the tonic BCR signaling analysis in control and Atxn1l-null FOB cells, N = 8 for Cd19-Cre and N = 6 for Atxn1lf/f;Cd19-Cre (b). Data represent 2–3 independent experiments. Statistics: two-tailed Student’s t-test (a, b). Bar graphs present data as mean ± S.D. Ctrl: Cd19-Cre, Cic cKO: Cicf/f;Cd19-Cre, and A1L cKO: Atxn1lf/f;Cd19-Cre. BCR B cell receptor, MFI mean fluorescence intensity, and FOB, follicular B cells. Source data are provided as a Source Data file.
Fig. 5
Fig. 5. Notch signaling is downregulated by CIC-ATXN1L complex deficiency.
a Volcano plots showing differentially expressed genes (DEGs, log2 fold-change > 0.5) in Cic-deficient MZB cells. Two samples of each genotype were subjected to RNA sequencing. Downregulated Notch signaling-related genes and upregulated CIC target genes are shown next to each corresponding dot. b Gene set enrichment analysis (GSEA) of DEGs in Cic-deficient MZB cells. The gene set database HALLMARK_NOTCH_SIGNALING (MM3870) was employed for GSEA. RT-qPCR analysis showing the downregulation of Notch signaling-related genes in Cic-null (c) and Atxn1l-null (d) MZB cells. For Notch1 and Asb2 levels, N = 5 per group; for Notch2, Dtx1, and Hes1 levels, N = 6 per group; and for Cr2 levels, N = 3 per group (c). N = 3 per group (d). e Surface expression levels of NOTCH1, NOTCH2, and CD21 in MZB and MZP cells from Cd19-Cre and Cicf/f;Cd19-Cre mice. N = 6 per group. f Surface expression levels of NOTCH1, NOTCH2, and CD21 in MZB and MZP cells from Cd19-Cre and Atxn1lf/f;Cd19-Cre mice. N = 6 per group. The MFIs for NOTCH1, NOTCH2, and CD21 were determined using flow cytometry. In vitro MZB cell differentiation assay to assess the differentiation potential of Cic-null (g) and Atxn1l-null (h) T1B cells into MZB cells. Sorted T1B cells were co-cultured with either control or DLL1-expressing OP9 cells for 72 h and subjected to flow cytometry to determine the frequency of MZB (CD21hiCD1dhi) cells. N = 6 per group. i In vitro MZB cell differentiation assay using control and Atxn1l-null T1B cells transfected with either control or Atxn1 siRNAs. T1B cells were co-cultured with DLL1-expressing OP9 cells for 72 h. N = 3 per group. Data represent 2–3 independent experiments. Statistics: Kolmogorov–Smirnov test (b) and two-tailed Student’s t-test (ci). Bar graphs present the data as mean ± S.D. Ctrl: Cd19-Cre, Cic cKO: Cicf/f;Cd19-Cre, and A1L cKO: Atxn1lf/f;Cd19-Cre. MZB marginal zone B cells, CIC capicua, RT-qPCR quantitative real-time polymerase chain reaction, MZP marginal zone progenitor cells, MFI mean fluorescence intensity, and NES normalized enrichment score. Source data are provided as a Source Data file.
Fig. 6
Fig. 6. Etv4 is a CIC target gene that suppresses Notch signaling and MZB cell development.
RT-qPCR analysis of Etv4 and Etv5 levels in MZB cells from Cicf/f;Cd19-Cre (a) and Atxn1lf/f;Cd19-Cre (b) mice. N = 3 per group. c Flow cytometry of NOTCH1 and NOTCH2 levels in MZB cells infected with either a control (NC) or ETV4-expressing (ETV4) retrovirus. N = 6 per group. d ChIP-qPCR analysis of the Notch1 and Notch2 promoter regions containing ETV4 binding motifs. B-2 cells isolated from the spleens of Cicf/f;Cd19-Cre mice were subjected to ChIP using either IgG or an anti-ETV4 antibody. N = 3 per group. Flow cytometry of splenic FOB and MZB cells (e), MZP cells (f), and T1B and T2B cells (g) in Cd19-Cre, Cicf/f;Cd19-Cre, and Etv4−/−;Cicf/f;Cd19-Cre mice. N = 7 for Cd19-Cre, N = 8 for Cicf/f;Cd19-Cre, and N = 5 for Etv4−/−;Cicf/f;Cd19-Cre. Ctrl: Cd19-Cre, cKO: Cicf/f;Cd19-Cre, and DKO: Etv4−/−;Cicf/f;Cd19-Cre. Flow cytometry of splenic FOB and MZB cells (h) and MZP cells (i) in Cd19-Cre, Atxn1lf/f;Cd19-Cre, and Etv4−/−;Atxn1lf/f;Cd19-Cre mice. N = 8 for Cd19-Cre, N = 6 for Atxn1lf/f;Cd19-Cre, and N = 3 for Etv4−/−;Atxn1lf/f;Cd19-Cre. Ctrl: Cd19-Cre, cKO: Atxn1lf/f;Cd19-Cre, and DKO: Etv4−/−;Atxn1lf/f;Cd19-Cre. j Surface expression levels of NOTCH1, NOTCH2, and CD21 in MZB and MZP cells from Cd19-Cre, Cicf/f;Cd19-Cre, and Etv4−/−;Cicf/f;Cd19-Cre mice. N = 5 per group. k Surface expression levels of NOTCH1, NOTCH2, and CD21 in MZB and MZP cells from Cd19-Cre, Atxn1lf/f;Cd19-Cre, and Etv4−/−;Atxn1lf/f;Cd19-Cre mice. N = 5 for Cd19-Cre and Atxn1lf/f;Cd19-Cre, and N = 3 for Etv4−/−;Atxn1lf/f;Cd19-Cre. The MFIs for NOTCH1, NOTCH2, and CD21 were determined using flow cytometry. Data represent 2–3 independent experiments. Statistics: two-tailed Student’s t-test (ad) and one-way ANOVA with Tukey’s multiple comparisons test (ek). Bar graphs present data as mean ± S.D. RT-qPCR quantitative real-time polymerase chain reaction, FOB follicular B cells, MZB marginal zone B cells, MZP marginal zone progenitor cells, and MFI mean fluorescence intensity. Source data are provided as a Source Data file.
Fig. 7
Fig. 7. Restoration of IgM production and sepsis progression in Etv4−/−;Cicf/f;Cd19-Cre mice.
a, b Cd19-Cre, Cicf/f;Cd19-Cre, and Etv4−/−;Cicf/f;Cd19-Cre mice were immunized with NP-Ficoll for 7 days. a Flow cytometry of splenic plasma cells. N = 5 for Cd19-Cre and Cicf/f;Cd19-Cre, and N = 4 for Etv4−/−;Cicf/f;Cd19-Cre. b Serum NP-specific IgM and IgG levels determined using ELISA. N = 5 for Cd19-Cre and N = 4 for Cicf/f;Cd19-Cre and Etv4−/−;Cicf/f;Cd19-Cre. ce Cd19-Cre, Cicf/f;Cd19-Cre, and Etv4−/−;Cd19-Cre mice were immunized with OVA in alum for 7 days. Flow cytometry of splenic GCB cells (c) and plasma cells (d). N = 7 for Cd19-Cre, N = 8 for Cicf/f;Cd19-Cre, and N = 6 for Etv4−/−;Cicf/f;Cd19-Cre. e Serum OVA-specific IgM and IgG levels determined using ELISA. N = 7 for Cd19-Cre, N = 8 for Cicf/f;Cd19-Cre, and N = 5 for Etv4−/−;Cicf/f;Cd19-Cre. fh Female Cd19-Cre, Cicf/f;Cd19-Cre, and Etv4−/−;Cicf/f;Cd19-Cre mice were injected intravenously with LPS. f Survival rate of LPS-treated mice. Mortality was monitored every 24 h. N = 7 for Cd19-Cre and Etv4−/−;Cicf/f;Cd19-Cre, and N = 10 for Cicf/f;Cd19-Cre. g Serum IL-6 and IL-10 levels determined using ELISA. h Histology of immune cell infiltration into lung tissue. Arrows indicate immune cell-infiltrated regions. Scale bar: 100 µm. Serum samples and lung tissues were collected from the mice 12 h after LPS injection. N = 5 per group. Data represent 2–3 independent experiments. Statistics: one-way ANOVA with Tukey’s multiple comparisons test (ae, gh) and Log-rank (Mantel-Cox) test (f). The bar graph presents data as mean ± S.D. Ctrl: Cd19-Cre, cKO: Cicf/f;Cd19-Cre, and DKO: Etv4−/−;Cicf/f;Cd19-Cre. ELISA enzyme-linked immunosorbent assay, OVA ovalbumin, and GCB germinal center B cell. Source data are provided as a Source Data file.
Fig. 8
Fig. 8. The CIC-ATXN1L complex regulates B-2 cell development.
A schematic diagram illustrates the role of the CIC-ATXN1L complex in B-2 cell development. The left panel shows that CIC deficiency reduces the formation of FOB cells by downregulating BCR signaling. The specific CIC target genes involved in this process have not yet been identified. The right panel indicates that the deficiency of either CIC or ATXN1L downregulates NOTCH1 and NOTCH2 expression by de-repressing ETV4, leading to a decreased MZB cell population. The diagram was created using BioRender.com, which permits the reuse of its content under a CC-BY 4.0 Attribution 4.0 International license.

References

    1. Montecino-Rodriguez, E. & Dorshkind, K. B-1 B cell development in the fetus and adult. Immunity36, 13–21 (2012). - PMC - PubMed
    1. Berland, R. & Wortis, H. H. Origins and functions of B-1 cells with notes on the role of CD5. Annu. Rev. Immunol.20, 253–300 (2002). - PubMed
    1. Nagasawa, T. Microenvironmental niches in the bone marrow required for B-cell development. Nat. Rev. Immunol.6, 107–116 (2006). - PubMed
    1. Pillai, S. & Cariappa, A. The follicular versus marginal zone B lymphocyte cell fate decision. Nat. Rev. Immunol.9, 767–777 (2009). - PubMed
    1. Cariappa, A. et al. The follicular versus marginal zone B lymphocyte cell fate decision is regulated by Aiolos, Btk, and CD21. Immunity14, 603–615 (2001). - PubMed

Publication types

MeSH terms

Associated data