. 2024 Dec 4;15(1):10590.
doi: 10.1038/s41467-024-54700-5.

Models optimized for real-world tasks reveal the task-dependent necessity of precise temporal coding in hearing

Affiliations

Models optimized for real-world tasks reveal the task-dependent necessity of precise temporal coding in hearing

Mark R Saddler et al. Nat Commun. .

Abstract

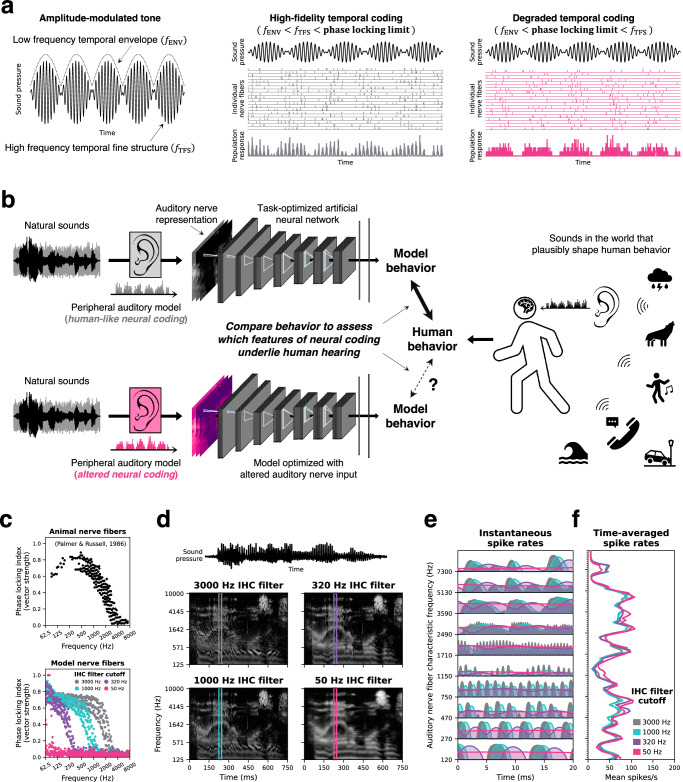
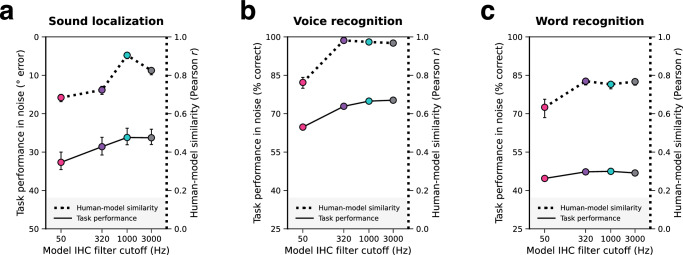
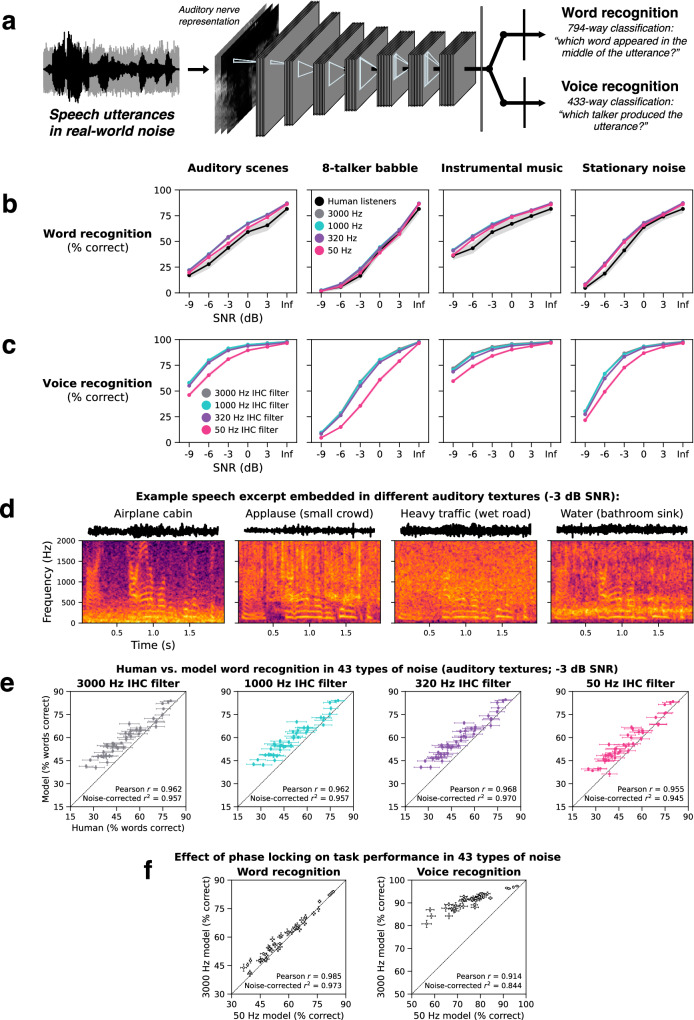
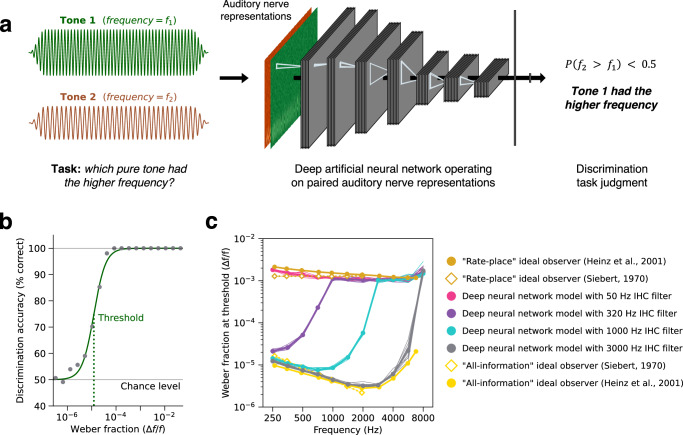
Neurons encode information in the timing of their spikes in addition to their firing rates. Spike timing is particularly precise in the auditory nerve, where action potentials phase lock to sound with sub-millisecond precision, but its behavioral relevance remains uncertain. We optimized machine learning models to perform real-world hearing tasks with simulated cochlear input, assessing the precision of auditory nerve spike timing needed to reproduce human behavior. Models with high-fidelity phase locking exhibited more human-like sound localization and speech perception than models without, consistent with an essential role in human hearing. However, the temporal precision needed to reproduce human-like behavior varied across tasks, as did the precision that benefited real-world task performance. These effects suggest that perceptual domains incorporate phase locking to different extents depending on the demands of real-world hearing. The results illustrate how optimizing models for realistic tasks can clarify the role of candidate neural codes in perception.


Conflict of interest statement

Competing interests: The authors declare no competing interests.

Figures

Fig. 1
Fig. 1. Overview of approach.
a Sound waveforms carry information in their amplitude envelope as well as their individual pressure oscillations (the “temporal fine structure” or “TFS”). The envelope and fine structure are encoded with phase-locked spike timing in the auditory nerve. As temporal coding is degraded, auditory nerve spikes no longer phase lock to the fine structure, encoding only the slower envelope fluctuations. b Schematic of the approach. Human auditory behavior is shaped by the ears and the acoustic environment. Models optimized to perform naturalistic tasks might reproduce human-like behavior if optimized for the auditory nerve information used by the human auditory system. c Top: The strength of phase locking as a function of frequency, measured in the auditory nerve fibers of guinea pigs. Data are re-plotted from Ref. . Bottom: The roll-off in phase locking strength is determined by the low-pass filter characteristics of the inner hair cell. Manipulating the hair cell low-pass filter cutoff in model auditory nerve fibers changes the upper frequency limit of phase locking. The 3000 Hz cutoff best approximates the guinea pig data and is commonly used to model the human auditory nerve. d Simulated auditory nerve representations of the same speech waveform with four different configurations of the auditory nerve model. Configurations differed in the inner hair cell low-pass filter cutoff. e Instantaneous firing rates from example auditory nerve fibers illustrate the degradation of precise spike timing as the phase locking limit is lowered. Note the rapid oscillations in firing that are present for higher phase locking limits, but absent when the limit is lowered. f Time-averaged firing rates across the 25 ms window depicted in (e) illustrate that lowering the phase locking limit does not disrupt “place” cues in the overall pattern of excitation across the cochlear frequency axis.
Fig. 2
Fig. 2. Models with access to phase-locked spike timing have better and more human-like hearing.
Each panel corresponds to a different task and summarizes the effect of auditory nerve phase locking limit on naturalistic model task performance and overall human-model behavioral similarity. Naturalistic task performance is quantified as a single number averaged across noise conditions shown in later figures (left y-axes; solid lines). Overall human-model behavioral similarity is quantified as the Pearson correlation between analogous human and model data points, averaged across all experiments for each model task (right y-axes; dotted lines). Individual experiments are described in subsequent results sections and figures. Error bars indicate 95% confidence intervals of the mean (bootstrapped across 10 network architectures for each model). a Sound localization. The left y-axis plots mean absolute error for the sound localization model and is inverted so that better model performance corresponds to higher positions on the y-axis. b Voice recognition. Here and in (c) the left y-axes plot percent correct for the model when tested on speech in noise. c Word recognition. Source data are provided as a Source Data file.
Fig. 3
Fig. 3. Sound localization is impaired in models with degraded auditory nerve spike timing.
a Localization model schematic. Deep artificial neural networks optimized for sound localization operated on binaural auditory nerve representations of virtually rendered auditory scenes. Nerve representations from the left and right ear were supplied as distinct channels to the first neural network stage. b Sound localization cues available to human listeners. Left: interaural time and level differences (ITDs and ILDs) are shown for pure tones recorded at the left and right ear. Right: spectral differences in the anatomical transfer function provide a monaural cue to elevation. c Schematic of the sound localization in noise experiment. d Mean absolute error for humans (n = 11) and models localizing natural sounds in noise are plotted as a function of SNR. The three axes separately plot spherical, azimuth, and elevation errors. Y-axes are inverted so that better performance is higher. e Schematic of the ITD / ILD cue weighting experiment. The perceptual weights measure the extent to which added ITDs or ILDs shift the perceived azimuth of a virtual sound presented over headphones. f ITD and ILD perceptual weights measured with low-pass and high-pass noise from humans (n = 13) and models. Note that the noise is the signal to be localized, rather than serving as a masker. g Schematic of minimum audible angle experiment. h Minimum audible angles plotted as a function of azimuth for human and model listeners. Model error bars always indicate ±2 standard errors of the mean across 10 network architectures per phase locking condition. In (d, f) human error bars indicate ±2 standard errors of the mean across participants. In (h) human error bars indicate ±2 standard errors from 1 listener averaged across 4 different pure tone frequencies (250, 500, 750, and 1000 Hz). Human data in (f, h) are re-plotted from the original studies,. Listener schematics in (bg) adapted from Francl & McDermott, Nature Human Behaviour, Volume 6, January 2022, reproduced with permission from SNCSC. Source data are provided as a Source Data file.
Fig. 4
Fig. 4. Upper frequency limit of interaural time difference sensitivity.
a Schematic of experiment used to measure ITD sensitivity as a function of frequency. On each trial, listeners heard a pair of pure tones with two different ITDs and judged whether the second tone was located to the right or left of the first. b ITD lateralization thresholds measured as a function of frequency from humans (n = 4) and models. c Schematic of neural network architecture modification to delay binaural integration. Replacing the first two convolutional layers with grouped convolutions (1 group for each ear) forces models to process the ears separately (and to downsample in time due to the inclusion of pooling operations, which reduce the fidelity of temporal coding, analogous to the loss of fidelity that occurs at each synapse in the auditory system) before binaural integration occurs in the first standard convolutional layer. Blue and red represent information from the left and right ears, respectively. d ITD lateralization thresholds measured as a function of frequency from humans and models with and without the modified network architectures (both models had the same 3000 Hz phase locking limit in their auditory nerve representation). Error bars in (bd) indicate ±2 standard errors of the mean across 4 human participants or 10 network architectures. Human data are re-plotted from the original study. e Effect of phase locking limit on sound localization in noise (left y-axis, solid lines) and human-model behavioral similarity (right y-axis, dotted lines). The data is re-plotted from Fig. 2a but now includes the delayed interaural integration model. The statistical significance of differences between models with and without delayed interaural integration was assessed by two-tailed paired comparisons (p-values indicate the probability of obtaining a more extreme score than the delayed model under a null distribution bootstrapped from the non-delayed model). Error bars indicate 95% confidence intervals of the mean bootstrapped across network architectures. Listener schematic in (a) adapted from Francl & McDermott, Nature Human Behaviour, Volume 6, January 2022, reproduced with permission from SNCSC. Source data are provided as a Source Data file.
Fig. 5
Fig. 5. Auditory nerve spike timing improves voice recognition more than word recognition in real-world noise.
a Speech model architecture and task. Deep artificial neural networks were jointly optimized to recognize words and voices from simulated auditory nerve representations of speech in noise. The two tasks shared all model stages up to the final task-specific output layers. b Human (n = 44) and model word recognition as a function of SNR. Each panel plots task performance in a different naturalistic noise condition. c Model voice recognition as a function of SNR. It was not possible to run humans in this experiment as human participants would not be familiar with the specific voices the model was trained to recognize. d Spectrograms of the same speech excerpt embedded in different auditory textures. e Human (n = 47) vs. model word recognition scatter plots for speech embedded in each of 43 distinct auditory textures at −3 dB SNR. Each data point represents the human and model word recognition score for a single auditory texture. f Effect of phase locking on model word and voice recognition in 43 distinct auditory textures. The left scatter plot compares word recognition performance for the 50 and 3000 Hz IHC filter models. The right scatter plot compares voice recognition performance for the 50 and 3000 Hz IHC filter models. All error bars indicate ±2 standard errors of the mean across human participants or 10 network architectures. Source data are provided as a Source Data file.
Fig. 6
Fig. 6. Auditory nerve spike timing is critical for human-like voice recognition.
a Stimuli for F0-altered word and voice recognition experiments. Spectrograms show the same speech excerpt resynthesized in four different pitch conditions: unmodified (natural), F0-shifted down 12 semitones, F0-shifted up 12 semitones, and inharmonic. In the inharmonic condition, harmonic frequency components were randomly frequency-shifted such that they were no longer integer multiples of a common F0 and were no longer linearly spaced in frequency. b Word and voice recognition accuracy for humans and models tested on F0-shifted speech. c Word and voice recognition accuracy for humans and models tested on harmonic and inharmonic speech. All error bars indicate ±2 standard errors of the mean across human participants (n = 22 for word recognition; n = 95 for voice recognition) or 10 network architectures. Source data are provided as a Source Data file.
Fig. 7
Fig. 7. Auditory nerve phase locking is needed to account for phenomena previously linked to temporal fine structure.
a Schematic of tone-vocoding stimulus manipulation with a “cutoff channel” of 10. A speech waveform was separated into 32 frequency bands by a band-pass filter bank that mimics the cochlea’s frequency tuning. Frequency channels up to and including the cutoff channel were left intact. In frequency channels above the cutoff, temporal fine structure (TFS) was disrupted by replacing the band with a pure tone carrier at the channel’s center frequency, amplitude modulated by the envelope of the original band. b The benefit from temporal fine structure was quantified by plotting word recognition accuracy vs. SNR and measuring leftward shifts in these psychometric functions as the cutoff channel (i.e., the number of channels with intact temporal fine structure) was increased. All shifts were computed relative to performance with fully tone-vocoded speech (0 channels intact, orange circles). c Tone vocoding results. The benefit from temporal fine structure—measured from humans and models—is plotted as a function of the number of channels with intact temporal fine structure. Open circles plot the benefit in stationary noise and closed circles plot the benefit in amplitude-modulated noise. Human data in (c) is re-plotted from the original study and errors bars indicate ±1 standard error of the mean across 10 participants. d Schematic of the speech localization experiment in anechoic and reverberant conditions. e Model sound localization accuracy as a function of SNR and reverberation. Panels plot performance in a simulated anechoic (solid symbols) and reverberant (open symbols) room for each phase locking model. Although the qualitative effects shown here have been documented in humans, the experiment we used to measure the effects in our model had not been conducted in human listeners, and so we do not have an explicit comparison to human data. f The effect of phase locking and reverberation condition on speech localization thresholds measured from the psychometric functions in (e). Model error bars in (cf) indicate ±2 standard errors of the mean across 10 network architectures. Listener schematics in (d) adapted from Francl & McDermott, Nature Human Behaviour, Volume 6, January 2022, reproduced with permission from SNCSC. Source data are provided as a Source Data file.
Fig. 8
Fig. 8. Deep neural networks optimized for pure tone frequency discrimination closely approximate previous ideal observer models.
a Schematic of deep neural network frequency discrimination model. The two tones were passed through an auditory nerve model and then provided as input to a convolutional neural network as separate channels (shown in brown and green). The levels of the tones were varied independently. b Model frequency discrimination thresholds were computed from psychometric functions measuring pure tone discrimination accuracy as a function of frequency difference, expressed as the Weber fraction on a log-scale. c Frequency discrimination thresholds measured from previous ideal observer models and deep neural network models with different phase locking limits. Thresholds for the ideal observer models (gold and yellow markers) were re-plotted from Ref. . Siebert (1970) analytically and Heinz et al. (2001) computationally derived the optimal task performance of models with access to either all the available information (“all-information”) or only the “rate-place” (i.e., time-averaged) information in auditory nerve representations. Deep neural network model thresholds are plotted as the mean across 10 network architectures for each phase locking conditions (thick pink, purple, blue, and grey lines; error bars indicate ±2 standard errors of the mean). Thin lines plot thresholds from individual network architectures. Source data are provided as a Source Data file.

Update of

Similar articles

Cited by

References

    1. Green, D. M. & Swets, J. A. Signal Detection Theory and Psychophysics Vol. 455 (John Wiley, Oxford, England, 1966).
    1. Siebert, W. M. Frequency discrimination in the auditory system: place or periodicity mechanisms? Proc. IEEE58, 723–730 (1970).
    1. Barlow, H. B. The efficiency of detecting changes of density in random dot patterns. Vis. Res. 18, 637–650 (1978). - PubMed
    1. Geisler, W. S. Contributions of ideal observer theory to vision research. Vis. Res. 51, 771–781 (2011). - PMC - PubMed
    1. Ernst, M. O. & Banks, M. S. Humans integrate visual and haptic information in a statistically optimal fashion. Nature415, 429–433 (2002). - PubMed

Publication types

LinkOut - more resources