. 2024 Dec 4;15(1):10592.
doi: 10.1038/s41467-024-54958-9.

Yin Yang 1 and guanine quadruplexes protect dopaminergic neurons from cellular stress via transmissive dormancy

Affiliations

Yin Yang 1 and guanine quadruplexes protect dopaminergic neurons from cellular stress via transmissive dormancy

Kielen R Zuurbier et al. Nat Commun. .

Abstract

Neurons deploy diverse adaptive strategies to ensure survival and neurotransmission amid cellular stress. When these adaptive pathways are overwhelmed, functional impairment or neurodegeneration follows. Here we show that stressed neurons actively induce a state of transmissive dormancy as a protective measure. Extending observations of neurotrauma in C. elegans and mice, human dopaminergic neurons capable of surviving severe cellular challenges both decrease spontaneous activity and modulate dopamine homeostasis through the transcriptional regulator Yin Yang 1 (YY1). To bolster stress resilience and mitigate dopamine toxicity, YY1 increases expression of the vesicular monoamine transporter 2, vMAT2, while coordinately inhibiting dopamine synthesis through stabilization of a guanine quadruplex in intron 10 of tyrosine hydroxylase, TH. This dopaminergic stress response has the potential to cause circuit inactivation, yet safeguards neurons by minimizing the toxic accumulation of cytosolic dopamine and inducing a state of neuronal dormancy. In essence, neurons appear to actively prioritize viability over functionality.


Conflict of interest statement

Competing interests: The authors declare no competing interests.

Figures

Fig. 1
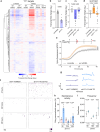
Fig. 1. Stress-resilient neurons actively repress neuronal function and dopamine synthesis.
a SYTOX green fluorescence in LUHMES cells after a 30-minute thapsigargin (TG) pulse, (ΔF/F0). DD = days of differentiation, D post TG = days after TG removal. Brown-Forsythe and Welch one-way ANOVA with Dunnett’s test using AUC. Mean ± SEM. n = 4 replicates. b Binary firing plots of 80 most active LUHMES cells after TG treatment. Total time of acquisition = 5 min (350 frames). n = 5 for control and 5, 8, 11 for cells 4-, 24-, and 48-hours post-TG, respectively. c Representative traces of the most active neurons per individual recording. Fluo-4 AM fluorescence is normalized to the intrinsic minimum fluorescence per neuron (∆F). d Percentage of neurons with spontaneous calcium transients. Ordinary one-way ANOVA with Šidák’s correction. Mean ± SEM. n = 5 for control and 5, 8, 11 for cells 4-, 24-, and 48-hours post-TG, respectively. e Frequency of neurons with spontaneous calcium transients. Recordings were collected at 1.16 Hz. Ordinary one-way ANOVA with Šidák’s correction. Mean ± SEM. From left to right, n = 124, 74, 80, 56, 62, and 13. f TH protein levels in LUHMES cells 24 h after TG or vehicle treatment as determined by western blot. HEK293t cells serve as an anti-TH control in first lane. g, i qPCR quantification of TH and SLC18A2 transcripts in LUHMES cells after TG treatment. Ordinary one-way ANOVA with Šidák’s correction. Mean ± SEM. n = 4 for 3- and 6-hours post-TG and n = 7 for 24-hours post-TG. h Dopamine content in LUHMES cells determined by ELISA after TG treatment. Kruskal-Wallis ANOVA with Dunn’s correction. Mean ± SEM. n = 3 replicates. j, k qPCR quantification of TH and SLC18A2 transcripts in LUHMES cells treated with 100 µM paraquat (PQ) for 3 h. Unpaired two-tailed t-test. Mean ± SEM. n = 3 replicates. l Whole-brain RNA-seq collected 2 h and 7 days post-TBI in mice (GSE173431). Transcripts are normalized to time-matched uninjured controls. Ordinary one-way ANOVA with Šidák’s correction. Mean ± SEM. n = 3 for 2 h control and 7 d injury. n = 4 for 2 h injury and 7 d control.
Fig. 2
Fig. 2. Cytosolic accumulation of dopamine triggers a neuroprotective dopaminergic stress response.
a qPCR quantification of cat-2/TH in C. elegans (PMD216) raised on empty vector (EV) or cat-1/SLC18A2 RNAi. Unpaired two-tailed t-test. Mean ± SEM. n = 8 independent replicates. b qPCR quantification of cat-2/TH in C. elegans (PMD216) raised on EV, dop-2/DRD2, or 50/50 mixed cat-1/dop-2 RNAi. Ordinary one-way ANOVA with Šidák’s correction. Mean ± SEM. n = 5 independent replicates. c Dopaminergic GFP retention in worms (PMD216) 48 h after injury. Positive and negative values show enhanced and reduced GFP retention respectively compared to injured EV control. Unpaired two-tailed t-test. Mean ± 95% CI. From left to right, n = 3696 (EV), 3554 (cat-1) collected over 4 independent experiments. d Dopaminergic GFP retention in worms (PMD216) 48 h after injury, pretreated with 30 µM reserpine (Res) or vehicle (acetic acid). Positive and negative values show enhanced and reduced GFP retention respectively compared to injured vehicle. Unpaired two-tailed t-test. Mean ± 95%CI. From left to right, n = 1828 and 1757 collected over 3 independent experiments. e Cytosolic ROS production in dopaminergic neurons 48 h after injury (PMD185). 405 nm/488 nm oxidation ratio is normalized to uninjured, time-matched, and vehicle control (acetic acid). Reserpine (Res) was supplemented to pre-injury agar plates at a final concentration of 30 μM. Unpaired two-tailed t-test. Blue = injured and vehicle treated, beige = injured and reserpine pretreated. Mean ± 95%CI. From left to right, n = 485 and 552 collected over 3 independent experiments. f, g SYTOX green fluorescence in LUHMES cells after a 10 nM TG pulse, (ΔF/F0). Cells were pretreated with 1 µM reserpine prior to TG addition or treated with 10 µM reserpine after TG removal. AUC was used for statistical analysis with an unpaired two-tailed t-test. DD = days of differentiation, D post TG = days post TG treatment. Mean ± SEM. n = 2 independent replicates for (f) and n = 7-8 independent replicates for (f).
Fig. 3
Fig. 3. Identification of ZTF-17 as a critical regulator of the dopaminergic stress response in C. elegans.
a Whole-brain RNA-seq from WT and Surf1−/− mice 7 days post-TBI (GSE173431). Transcripts are normalized to time-matched uninjured controls. Ordinary one-way ANOVA with Šidák’s correction. Mean ± SEM. n = 4 uninjured, n = 3 injured for WT and surf1−/− mice. b qPCR quantification of cat-1/Slc18a2 transcripts 48 h after injury on the respective RNAi conditions, normalized to uninjured controls. Ordinary one-way ANOVA with Dunnett’s test. Mean ± SEM. n = 8 for EV, 6 for cox-5B positive control, and 3 for experimental RNAi. c Dopaminergic GFP retention in worms (PMD216) 48 h after injury. Positive and negative values show enhanced and reduced GFP retention respectively compared to injured EV control. ordinary one-way ANOVA with Dunnett’s test. Mean ± 95%CI. From left to right, n = 1512, 1097, 1282 collected over 3 independent experiments. d Dopaminergic GFP retention in worms (PMD216) 48 h after injury treated with 30 µM reserpine or vehicle. Positive and negative values show enhanced and reduced GFP retention respectively compared to EV RNAi on vehicle control. Ordinary one-way ANOVA with Dunnett’s test. Mean ± 95%CI. From left to right, n = 572, 885, 607, 874 collected over 3 independent experiments. e Dopaminergic GFP retention in day 3 adult worms (PMD216) raised on 30 µM reserpine or vehicle. Data is normalized to EV RNAi on vehicle control. Ordinary one-way ANOVA with Dunnett’s test. Mean ± 95%CI. From left to right, n = 1082, 1147, 749, 1104 collected over 3 independent experiments. f Cytosolic ROS measurement in dopaminergic neurons using PMD249 raised on EV or ztf-17 RNAi and injured at day 1 of adulthood. Data acquired 48 h post-injury. All samples normalized to the 405 nm/488 nm ratio of uninjured worms on EV. Ordinary one-way ANOVA with Šidák’s correction. Mean ± 95%CI. From left to right, n = 58, 349, 205, 144. g qPCR quantification of cat-2/TH transcripts from day 1 adults (PMD216) raised on EV, mixed EV/cat-1, or cat-1/ztf-17 RNAi. Ordinary one-way ANOVA with Šidák’s correction. Mean ± SEM. n = 5 independent replicates.
Fig. 4
Fig. 4. YY1 is required for stress-induced regulation of dopamine metabolism and repression of neuronal activity in human dopaminergic neurons.
a Relative transcript abundance of YY1 regulated genes (MSigDB TFT:TFT_legacy). Whole-brain RNA-seq from WT and Surf1−/− mice 2 h or 7 days post-TBI. Samples normalized to uninjured, time-matched controls. Each lane per group corresponds to individual mice. b qPCR quantification of YY1 transcripts in LUHMES cells expressing scramble or YY1 shRNA. shRNA expression was induced for 5 days via IPTG. Unpaired two-tailed t-test. Mean ± SEM. n = 9. c, d qPCR quantification of TH and SLC18A2 transcripts in LUHMES cells expressing scramble control or YY1 shRNA treated with TG. Ordinary one-way ANOVA with Dunnett’s test. Mean ± SEM. n = 9 independent replicates. e SYTOX green fluorescence in LUHMES cells expressing scramble or YY1 shRNA after a 30 min TG pulse, (ΔF/F0). AUC was used for statistical analysis via an unpaired two-tailed t-test. DD = days of differentiation, D post TG = days after TG removal. Mean ± SEM. n = 10 replicates. f Binary firing plots of differentiated LUHMES cells with YY1 knockdown at corresponding timepoints post treatment. Plots show the 80 most active cells per condition as determined by frequency and are sorted accordingly from top to bottom. Total time of acquisition = 5 min (350 frames). Fluorescence time series were collected over 3 recordings/timepoint for DMSO treated cells and 3, 4, 6 recordings/timepoint for cells 4-, 24-, and 48 h post-TG, respectively. g Representative traces of the most active neurons per individual recording 48 h post-TG. Fluo-4 AM fluorescence is normalized to the intrinsic minimum fluorescence per neuron (∆F). h Percentage of neurons with any spontaneous activity per recording. Ordinary one-way ANOVA with Šidák’s correction. Mean ± SEM. n = 3 recordings/timepoint for DMSO treated cells and 3, 4, 6 recordings/timepoint for cells 4-, 24-, and 48-hours post-TG, respectively. i Firing frequency of neurons with spontaneous activity. Recordings were collected at 1.16 FPS so 1 frame= 0.857 s. Ordinary one-way ANOVA with Šidák’s correction. Mean ± SEM. From left to right, n = 37, 177, 39, 13, 18, and 27.
Fig. 5
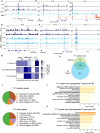
Fig. 5. YY1 regulates dopamine metabolism through distinct genomic element binding mechanisms.
ac Integrative Genomics Viewer (IGV) tracks of YY1 (ENCFF023AFF and ENCFF157ZKE) and CTCF (ENCFF050CCI) ChIP-seq combined with RNA-seq (ENCFF130RGZ) in K562 cells. Tracks display fold change over control of pooled replicates for ChIP-seq and signal of unique reads for RNA-seq. Regions of interest are highlighted by the shaded area. df Integrative Genomics Viewer (IGV) tracks displaying YY1 and H3K4me3 CUT&RUN 24 h after a 30-minute pulse with TG at a final concentration of 10 nM in terminally differentiated LUHMES cells. Tracks display counts per million normalized aggregate reads from pooled replicates. n = 6 per condition. Regions of interest are highlighted by the shaded area. g Quantification of read counts per region normalized to the total read counts per sample multiplied by 106. Regions used for the analysis were the following: TH intron 10 (chr11:2,166,250-2,166,500), SLC18A2 enhancer (chr10:117,216,450-117,217,450), YY1 promoter (chr14:100,239,250-100,240,000). Counts per region were scaled to 1 kb prior to total read count normalization. h MACS2 called YY1 peaks in control and TG stressed groups. Minimum FDR (q-value) cutoff for peak detection was set at 0.05. Peaks were considered overlapping when called peakBEDs had ≥ 1 overlapping bp. i Annotation of genomic elements overlapping with YY1 peaks via ChIPseeker analysis of YY1 called peaks in control (upper) and TG treated (lower) terminally differentiated LUHMES cells. j, k GO-term gene set enrichment analysis of genes with YY1 peaks and differential expression (multiple t-test, p < 0.05) 7 days after traumatic brain injury.
Fig. 6
Fig. 6. DNA damage and stress-dependent guanine quadruplex formation facilitate YY1-mediated repression of TH.
a Computational prediction of guanine quadruplexes (G4) along the TH gene body according to G4Boost and G4Hunter. Top track indicates YY1 CUT&RUN reads of terminally differentiated LUHMES cells 24 h post-TG treatment (same data as Fig. 6d). Middle track displays G4Boost prediction of folded G4s and is color-coded according to the predicted minimum free energy (MFE). Bottom track signal indicates the number of potential guanine quadruplexes within TH as predicted by G4Hunter. The sequence displayed highlights the region where YY1 binding overlaps with the predicted G4 structures. b γH2AX levels determined by western blot of LUHMES cells 3, 6, and 24 h after TG treatment. Blotted for phosphorylated γH2AX and GAPDH. c Quantification of γH2AX normalized to GAPDH and 3 h untreated control. Ordinary one-way ANOVA with Šidák’s correction. Mean ± SEM. n = 6 independent replicates. d, f qPCR quantification of TH and SLC18A2 transcripts in LUHMES cells after TG and/or 10 µM KU55933 treatment. Ordinary one-way ANOVA with Dunnett’s test. Mean ± SEM. n = 6 independent replicates. e, g qPCR quantification of TH and SLC18A2 transcripts in LUHMES cells expressing scramble control or YY1 shRNA treated with 10 µM KU55933 for 24 h. Ordinary one-way ANOVA with Dunnett’s test. Mean ± SEM. n = 3 independent replicates. h, i qPCR quantification of TH and SLC18A2 transcripts in LUHMES cells after a 24 h treatment with 5 µM TMPyP4. Unpaired two-tailed t-test. Mean ± SEM. n = 6 independent replicates for vehicle control and n = 3 for TMPyP4 treated cells. j IGV browser tracks of BG4 CUT&RUN signal normalized to αFLAG control collected 24 h post-TG challenge. k, l Average profiles of BG4 signal at regions retrieved from MACS2 peak calling of vehicle or TG treated cells, respectively.
Fig. 7
Fig. 7. TH intron 10 folds into a parallel G4 with the potential to directly inhibit polymerase transcription.
a Coding strand sequence of the first 126 bp of TH intron 10 which surrounds the predicted G4. Grey blocks illustrate sequences of probes tested for G4 folding using CD. b CD spectra of fragment 4 (Frag 4 53-92), positive parallel G4 control Myc Pu22, and a poly dT negative control. Spectra are a average of 10 accumulations (c) relative ellipticity of fragment 4 with or without TMPyP4 at 263 nm and a temperature range of 20–95 °C. d DNA construct and primer design used for in vitro G4 polymerase inhibition assay. e PCR products amplified by the high fidelity Q5 polymerase. Final TMPyP4 concentration from left to right was 0, 0.1 nM, 1 nM, 10 nM, 100 nM, 1 µM, 10 µM. f Quantification of product shown in (e). Band intensity was normalized to internal, vehicle control. Statistical analysis was performed using a two-way ANOVA with mixed-effects analysis and Dunnett’s test. p values represent TH + intron 10 at the respective TMPyP4 concentration compared back to 10-3 nM TMPyP4. Mean ± SEM. n = 4 independent replicates per condition. g DNA construct design used for in vivo G4 inhibition assay. h mCherry amplification 60 h post-transfection and treated with 1.25 µM TMPyP4. Data is normalized to time-matched, untreated controls. Mean ± SEM. Statistical analysis was performed using an unpaired two-tailed t-test. For statistical analysis of the entire dose response curve see Supplementary Fig. 13c and source data. n = 3 independent replicates per condition. i Proposed model of DSR regulation.

References

    1. Nikolaus, S., Antke, C. & Muller, H. W. In vivo imaging of synaptic function in the central nervous system: II. Mental and affective disorders. Behav. Brain Res.204, 32–66 (2009). - PubMed
    1. Tang, T. S. et al. Huntingtin and huntingtin-associated protein 1 influence neuronal calcium signaling mediated by inositol-(1,4,5) triphosphate receptor type 1. Neuron39, 227–239 (2003). - PMC - PubMed
    1. Hartley, D. M. et al. Protofibrillar intermediates of amyloid beta-protein induce acute electrophysiological changes and progressive neurotoxicity in cortical neurons. J. Neurosci.19, 8876–8884 (1999). - PMC - PubMed
    1. Kamenetz, F. et al. APP processing and synaptic function. Neuron37, 925–937 (2003). - PubMed
    1. Heo, J. Y. et al. Aberrant tonic inhibition of dopaminergic neuronal activity causes motor symptoms in animal models of Parkinson’s disease. Curr. Biol.30, 276–291.e279 (2020). - PubMed

Publication types

MeSH terms

Associated data