. 2024 Dec 4;15(1):10566.
doi: 10.1038/s41467-024-54780-3.

Group 2 innate lymphoid cells are a non-redundant source of interleukin-5 required for development and function of murine B1 cells

Affiliations

Group 2 innate lymphoid cells are a non-redundant source of interleukin-5 required for development and function of murine B1 cells

Karoline F Troch et al. Nat Commun. .

Abstract

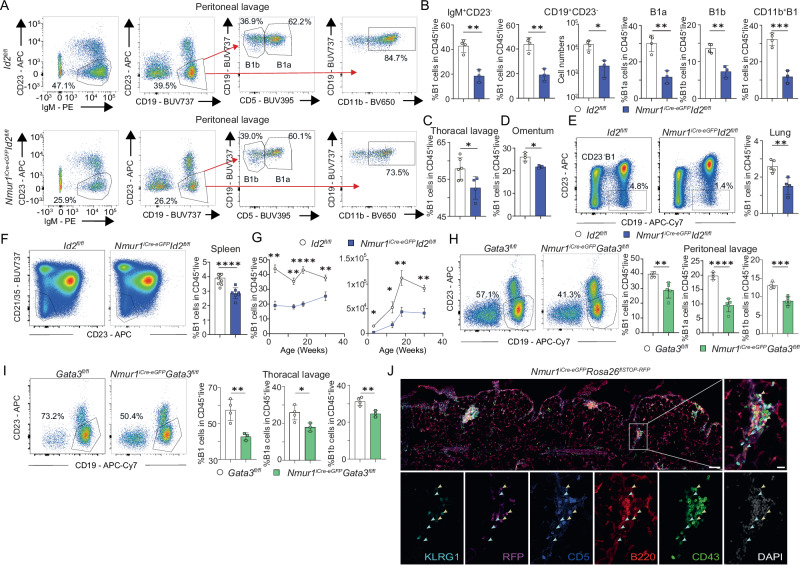
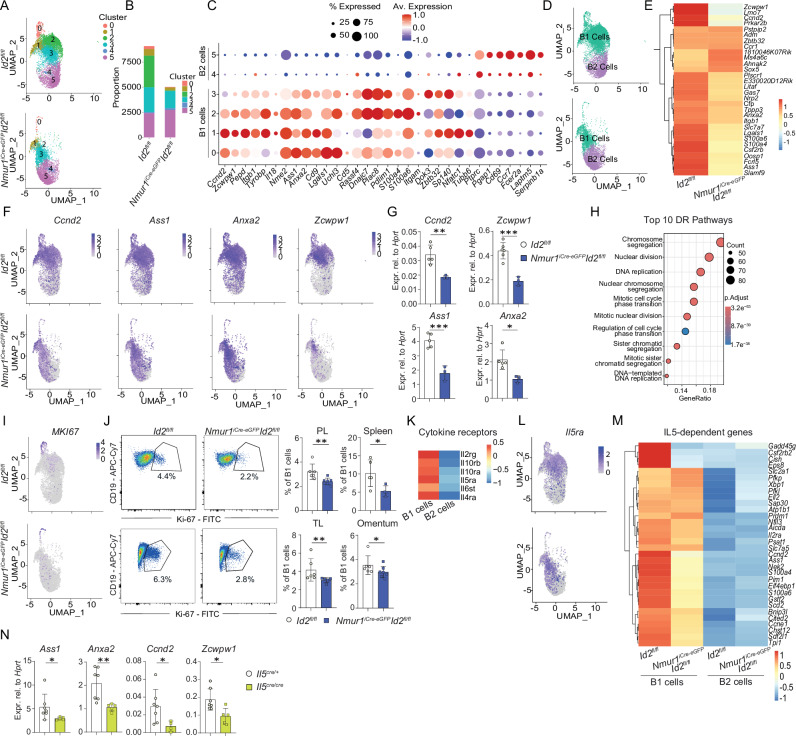
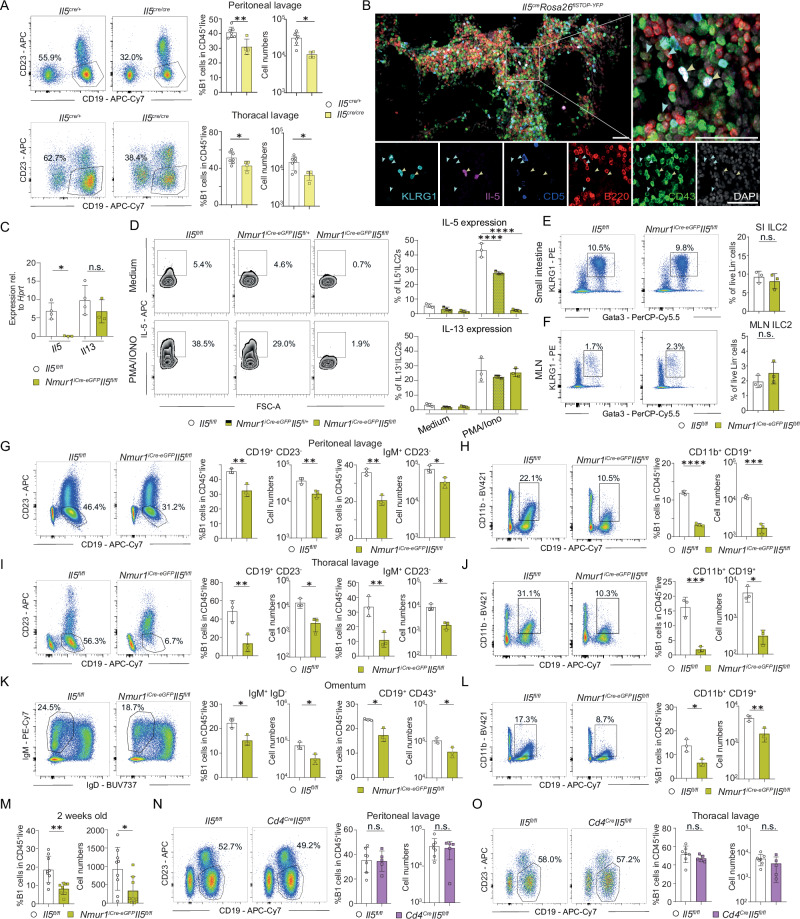
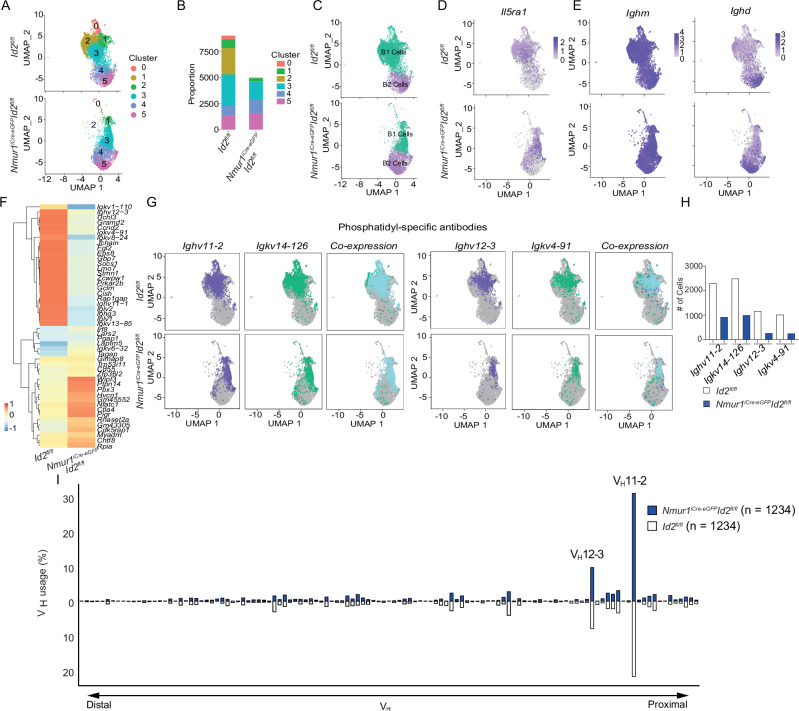
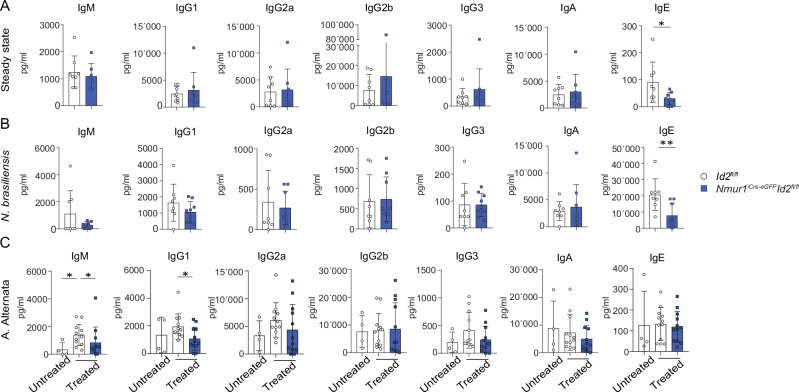
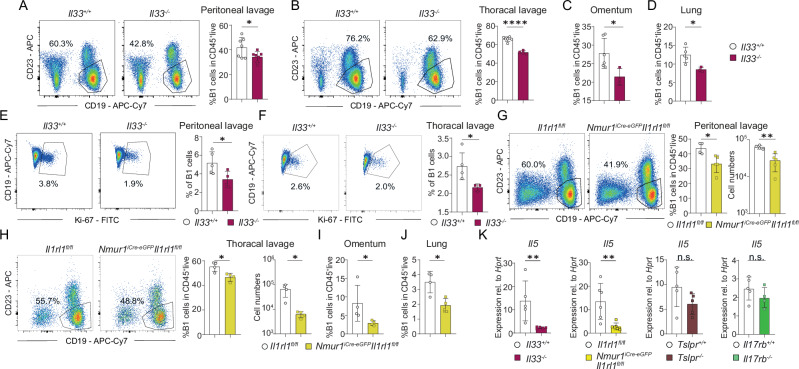
Tissue-resident immune cells, such as innate lymphoid cells, mediate protective or detrimental immune responses at barrier surfaces. Upon activation by stromal or epithelial cell-derived alarmins, group 2 innate lymphoid cells (ILC2s) are a rapid source of type 2 cytokines, such as IL-5. However, due to the overlap in effector functions, it remains unresolved whether ILC2s are an essential component of the type 2 response or whether their function can be compensated by other cells, such as T cells. Here we show a non-redundant role of ILC2s in supporting the development and function of B1 cells. We demonstrate that B1 cells fail to develop properly in the absence of ILC2s and identify the IL-33 receptor on ILC2s as an essential cell-intrinsic regulator of IL-5 production. Further, conditional deletion of Il5 in ILC2s results in defective B1 cell development and immunoglobulin production. Consequently, B1 cells with phosphatidylcholine specific B cell receptor rearrangements are diminished in ILC2-deficient mice. Thus, our data establish an essential function of ILC2s in supporting B1 cells and antibody production at barrier surfaces.


Conflict of interest statement

Competing interests: D.A. has contributed to scientific advisory boards at Pfizer, Takeda, FARE, and the KRF. The other authors declare no competing interests.

Figures

Fig. 1
Fig. 1. ILC2s shape the B1 cell pool.
a Flow cytometric plots of B1 cells in Nmur1iCre-eGFP Id2fl/fl (blue) and littermate Id2fl/fl mice (white) in the peritoneal cavity in steady state. B1 cells were pre-gated on live CD45+ TCRβ-. First gate shows B1 cells gated as IgM+ CD23. Second gate shows B1 cells gated as CD19+ CD23, further gating of B1 cells included CD11b. B1a and B1b cells were subdivided using the marker CD5. b Quantification of B1 cells as in (a) (Id2fl/fl n = 4, Nmur1iCre-eGFP Id2fl/fl n = 3). cf Flow cytometric plots and quantification of B1 cells in the (c), Thoracal lavage (Id2fl/fl n = 6, Nmur1iCre-eGFP Id2fl/fl n = 4), d Omentum (Id2fl/fl n = 4, Nmur1iCre-eGFP Id2fl/fl n = 3) e Lung (Id2fl/fl n = 5, Nmur1iCre-eGFP Id2fl/fl n = 4) and (f) spleen (Id2fl/fl n = 8, Nmur1iCre-eGFP Id2fl/fl n = 7). g Relative and absolute cell numbers of B1 cells across different ages in Nmur1iCre-eGFP Id2fl/fl (blue, 3 weeks n = 3, 13 weeks n = 4, 18 weeks n = 5, 30 weeks n = 4) and littermate Id2fl/fl mice (black, 3 weeks n = 4, 13 weeks n = 4, 18 weeks n = 4, 30 weeks n = 5). h, i Flow cytometric plots of B1 cells in Nmur1iCre-eGFP Gata3fl/fl (green) and littermate Gata3fl/fl (white) mice in the (h), peritoneal cavity (Gata3fl/fl n = 4, Nmur1iCre-eGFP Id2fl/fl n = 5) and (i), thoracal lavage (Gata3fl/fl n = 4, Nmur1iCre-eGFP Id2fl/fl n = 3) at steady state. j Histology section of omental Fat-Associated-Lymphoid-Clusters (FALCs) from the ILC2 reporter mouse Nmur1iCre-eGFP Rosa26flSTOP-RFP/+ (violet signal) stained with anti-KLRG1 (light-blue), anti-CD5 (dark blue), anti-B220 (red), anti-CD43 (green), and DAPI. Yellow arrows identify ILC2s (RFP+ KLRG1+ CD5), blue arrows point towards B1 cells (B220low, CD43+). Scale bar overview 100 µm, zoom 20 µm. Each symbol represents data from one mouse, mean +/− SD, all data are representative of at least two independent experiments. Statistical significance was determined by two-tailed unpaired Student’s t-test (bi), *p < 0.05 **p < 0.01, ***p < 0.001, ****p < 0.0001. Source data, including exact p-values, are provided as a Source data file Fig. 1.
Fig. 2
Fig. 2. ILC2s expand IL5ra+ B1 cells.
a Clustering of flow-sorted and sequenced B cells at a resolution 0.3. b Proportions of the clusters of Nmur1iCre-eGFP Id2fl/fl vs. littermate Id2fl/fl mice. c B1- and B2-specific genes in each Cluster were plotted according to their average expression and percentage of expression. d Annotated and color-coded B1 vs. B2 cells. e Heatmap of top 30 differentially-expressed genes in B1 cells of Nmur1iCre-eGFP Id2fl/fl vs. littermate Id2fl/fl mice. f UMAPs of Ccnd2, Ass1, Anxa2, Zcwpw1. g Validation by qPCR of downregulated B1 cell genes. B1 cells were sort-purified from the peritoneal cavity (Id2fl/fl n = 5, Nmur1iCre-eGFP Id2fl/fl n = 3). h Top 10 differentially-regulated pathways in Cluster 0 of the UMAP in a. i UMAP showing Mki67 in B cells, j flow cytometric plots and quantification of Ki67+ B1 cells (Pre-gated on Live CD45+ CD19+ CD23-) in Nmur1iCre-eGFP Id2fl/fl (blue, PL, peritoneal lavage n = 7, TL, thoracal lavage n = 5, Spleen n = 4, Omentum n = 7) and littermate Id2flox/flox mice (white, PL n = 6, TL n = 6, Spleen n = 5, Omentum n = 6). k Expression of cytokine-receptors on B1 and B2 cells in ILC2-sufficient mice. l UMAP of IL5ra+ B cells. m differentially- regulated gene expression of reported IL-5-induced B1 cell genes of Nmur1iCre-eGFP Id2fl/fl vs. (blue) and littermate Id2flox/flox mice. n B1 cells were sort-purified from Il5Cre/Cre (yellow, n = 5) and littermate Il5Cre/+ mice (white, n = 7) and qPCR was performed for the indicated genes. Each symbol represents data from one mouse, mean +/− SD, data in (g, j, n) are representative of two independent experiments. Statistical significance was determined by two-tailed unpaired Student’s t-test (g) or Mann Whitney test (j, n), *p < 0.05 **p < 0.01, ***p < 0.001, ****p < 0.0001. Source data, including exact p-values, are provided as a Source data file Fig. 2.
Fig. 3
Fig. 3. ILC2-derived IL-5 is required for proper B1 cell development.
a Flow cytometric plots and quantification of B1 cells in Il5Cre/Cre (yellow, n = 4) and littermate Il5Cre/+ mice (white, n = 7) in the peritoneal cavity and thoracal lavage at steady state. b Histology section of omental FALCs from Il5Cre/+ Rosa26flSTOP-YFP/+ mice. Staining with anti-B220 (red), anti-CD43 (green), anti-KLRG1 (light-blue), anti-CD5 (blue), endogenous IL-5 (Violet) and DAPI. Il-5 producing ILC2s (yellow arrows, Il5+KLRG1+CD5-) reside in close proximity to B1 cells (blue arrows, B220lowCD43+). Scale bars 50 µm. c Validation of the mouse line Nmur1iCre-eGFP Il5fl/fl by qPCR of sort-purified ILC2s from the lung (Il5fl/fl n = 4, Nmur1iCre-eGFP Il5fl/fl n = 3). d IL-5 and Il-13 secretion was determined by flow cytometry of cultured immune cells isolated from the small intestine of Nmur1iCre-eGFP Il5fl/fl mice and littermate controls, stimulated with PMA/ionomycin (PMA/Iono) for 4 h (Il5fl/fl n = 3, Nmur1iCre-eGFP Il5fl/+ n = 3, Nmur1iCre-eGFP Il5fl/fl n = 3). e, f Relative ILC2 numbers in the (e), small intestine and (f), mesenteric lymph nodes (MLN) (Il5fl/fl n = 3, Nmur1iCre-eGFP Il5fl/fl n = 3). gl Flow cytometric plots and quantification (Il5fl/fl n = 3, Nmur1iCre-eGFP Il5fl/fl n = 3) of (g, i, k), B1 cells (cells were pre-gated on live CD45+ TCRβ) and (h, j, l), CD11b+ B1 cells in the (g, h) peritoneal lavage, (i, j), the thoracal lavage and (k, l), the omentum. m Flow cytometric quantification of B1 cells in 2 weeks old Nmur1iCre-eGFP Il5fl/fl mice and littermate controls (Il5fl/fl n = 9, Nmur1iCre-eGFP Il5fl/fl n = 8). n, o Flow cytometric plots and quantification of B1 cells in the (n), peritoneal cavity and the (o), thoracal lavage in littermate, co-housed Cd4Cre Il5fl/fl mice and controls (Il5fl/fl n = 7, Cd4Cre Il5fl/fl n = 5). Each symbol represents data from one mouse, mean +/− SD, all data are representative of at least two independent experiments. Statistical significance was determined by two-tailed unpaired Student’s t-test (a, eo) or one-way ANOVA (c, d), n.s. non-significant, *p < 0.05, **p < 0.01, ***p < 0.001, ****p < 0.0001. Source data, including exact p-values, are provided as a Source data file Fig. 3.
Fig. 4
Fig. 4. ILC2s support the expansion of phosphatidylcholine specific B1 cells.
a Clustering of flow-sorted and sequenced B cells from the peritoneal lavage at a resolution 0.3. b Proportions of the clusters of Nmur1iCre-eGFP Id2fl/fl vs. littermate Id2fl/fl mice. c Annotated and color-coded B1 and B2 cells in the peritoneal lavage. d UMAP of IL5ra+ B cells. e UMAPs of Ighm and Ighd. f Heatmap of differentially-regulated genes including BCR genes comparing Nmur1iCre-eGFP Id2fl/fl and littermate Id2fl/fl mice. g UMAPs and (h), quantification of the most important phosphatidyl-specific heavy- and corresponding light chains, Ighv11-2, Igkv14-126 and Ighv12−3, Igkv4-91 in Nmur1iCre-eGFP Id2fl/fl and littermate Id2fl/fl mice. i Ighv usage in single B1 cells from 5 mice from Nmur1iCre-eGFP Id2fl/fl (blue) and littermate Id2fl/fl mice (white). Ighv gene segments are ordered by their relative proximity to the D segments. Number of cells is depicted in the Figure.
Fig. 5
Fig. 5. Serum IgM and IgE levels are dependent on the presence of ILC2s.
ac Immunglobulin concentrations in the serum of Nmur1iCre-eGFP Id2fl/fl and littermate Id2fl/fl mice were determined by using the LEGENDplex multiplex beads-based assay. a Total immunoglobulin concentration in steady state (Id2fl/fl n = 8, Nmur1iCre-eGFP Id2fl/fl n = 8). b Mice were infected with N. brasiliensis and serum was harvested at d11 post-infection (Id2fl/fl n = 8, Nmur1iCre-eGFP Id2fl/fl n = 9). c Inflammation was induced by intranasal administration of Alternaria alternata (A. alternata) extract. Sera were harvested at d7 after induction of inflammation (Untreated Id2fl/fl n = 4, A. alternata Id2fl/fl n = 12, A. alternata Nmur1iCre-eGFP Id2fl/fl n = 12). Each symbol represents data from one mouse, mean +/− SD, data are pooled from two (a, b) or three (c) independent experiments. Statistical significance was determined by two-tailed unpaired Mann Whitney test (ac), *p < 0.05, **p < 0.01. Source data, including exact p-values, are provided as a Source data file Fig. 5.
Fig. 6
Fig. 6. IL-33 triggers IL-5 production in ILC2 to stimulate B1 cells.
ad Flow cytometric plots and quantification of B1 cells in (a), the peritoneal lavage (Il33+/+ n = 7, Il33−/− n = 7), b the thoracal lavage (Il33+/+ n = 6, Il33-/- n = 4), c omentum (Il33+/+ n = 6, Il33−/− n = 3) and (d) lung (Il33+/+ n = 5, Il33-/- n = 3) of Il33-/- and control mice. e, f Flow-cytometric analysis of Ki-67 of B1 cells (Pre-gated on Live CD45+ CD19+ CD23) in Il33−/− versus control mice in the (e), peritoneal lavage (Il33+/+ n = 5, Il33-/- n = 4) and the (f) thoracal lavage (Il33+/+ n = 4, Il33−/− n = 3). gj Flow-cytometric plots and quantification of B1 cells of Nmur1iCre-eGFP Il1r1fl/fl (ST2) mice and littermate controls in (g), the peritoneal lavage (Il1rl1fl/fl n = 4, Nmur1iCre-eGFP Il1rl1fl/fl n = 5) h the thoracal lavage (Il1rl1fl/fl n = 4, Nmur1iCre-eGFP Il1rl1fl/fl n = 4), i omentum (Il1rl1fl/fl n = 4, Nmur1iCre-eGFP Il1rl1fl/fl n = 4), and (j) lung (Il1rl1fl/fl n = 4, Nmur1iCre-eGFP Il1rl1fl/fl n = 4). k Sort-purified small intestinal ILC2s gated as Live CD45+ Lin (CD3, CD5, CD19, Fcεrl, Ly6G) CD127+ KLRG1+ of Tslpr−/− (Tslpr+/+ n = 5, Tslpr−/− n = 5), Il17rb−/− (Il17rb+/+ n = 5, Il17rb−/− n = 4), Il33−/− (Il33+/+ n = 5, Il33−/− n = 5) and Nmur1iCre-eGFP Il1rl1fl/fl (Il1rl1fl/fl n = 6, Nmur1iCre-eGFP Il1rl1fl/fl n = 7) and qPCR for Il5. Each symbol represents data from one mouse, mean +/− SD, data are representative of at least two independent experiments. Statistical significance was determined by two-tailed unpaired Student’s t-test (aj) or Mann Whitney test (k), n.s. non-significant, *p < 0.05, **p < 0.01, ***p < 0.001. Source data, including exact p-values, are provided as a Source data file Fig. 6.

References

    1. Spits, H. et al. Innate lymphoid cells—a proposal for uniform nomenclature. Nat. Rev. Immunol.13, 145–149 (2013). - PubMed
    1. Klose, C. S. N. & Artis, D. Innate lymphoid cells control signaling circuits to regulate tissue-specific immunity. Cell Res.30, 475–491 (2020). - PMC - PubMed
    1. Robinette, M. L. et al. Transcriptional programs define molecular characteristics of innate lymphoid cell classes and subsets. Nat. Immunol.16, 306–317 (2015). - PMC - PubMed
    1. Moro, K. et al. Innate production of T(H)2 cytokines by adipose tissue-associated c-Kit(+)Sca-1(+) lymphoid cells. Nature463, 540–544 (2010). - PubMed
    1. Drake, L. Y., Iijima, K., Bartemes, K. & Kita, H. Group 2 innate lymphoid cells promote an early antibody response to a respiratory antigen in mice. J. Immunol.197, 1335–1342 (2016). - PMC - PubMed

Publication types

Associated data

LinkOut - more resources