. 2024 Dec 4;9(1):75.
doi: 10.1038/s41539-024-00285-z.

Transcranial direct current stimulation targeting the bilateral IFG alters cognitive processes during creative ideation

Affiliations

Transcranial direct current stimulation targeting the bilateral IFG alters cognitive processes during creative ideation

Cong Xie et al. NPJ Sci Learn. .

Abstract

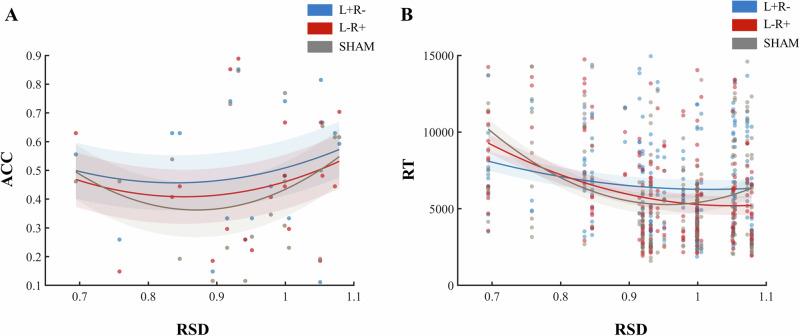
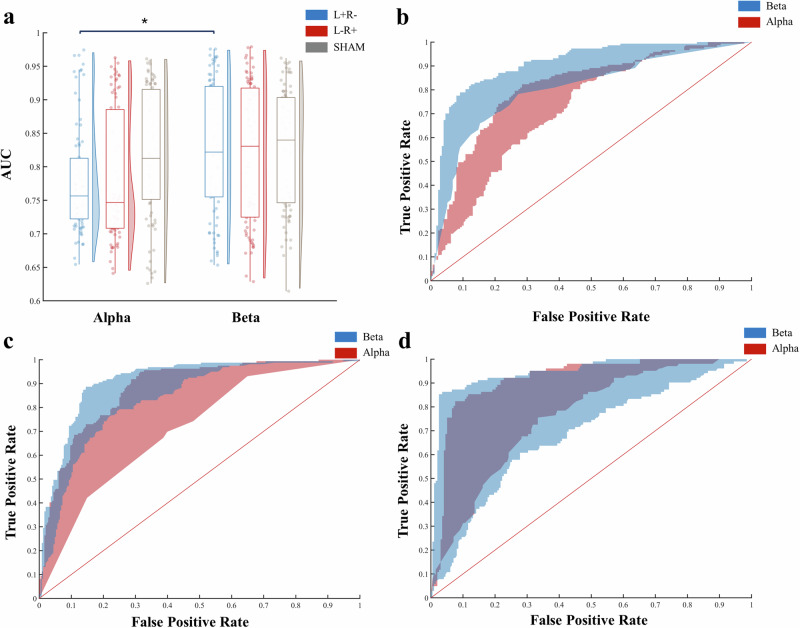
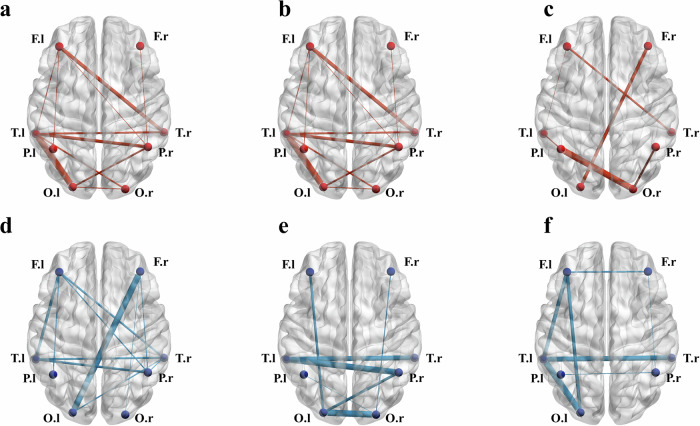
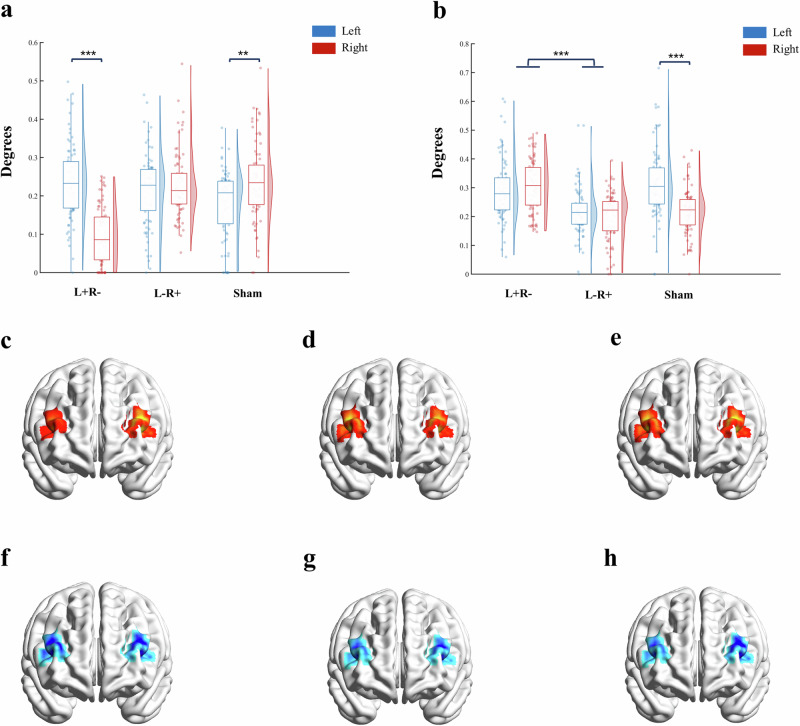
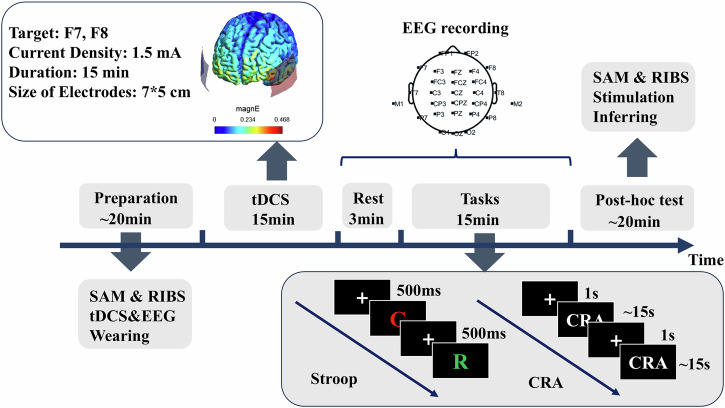
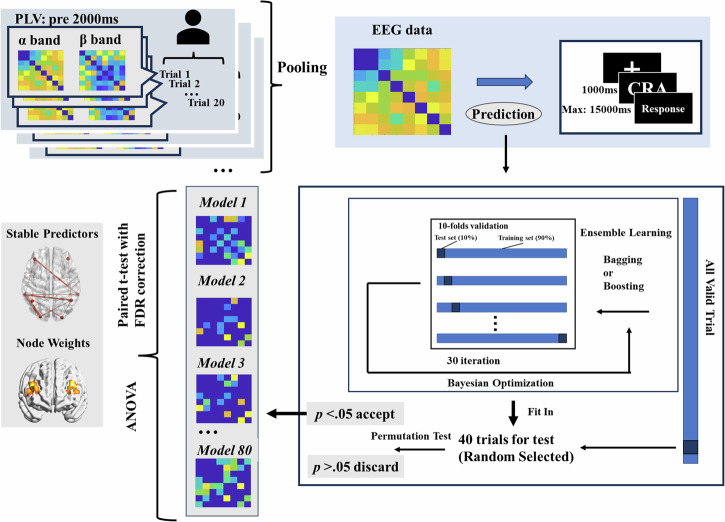
This study investigated whether transcranial direct current stimulation (tDCS) targeting the inferior frontal gyrus (IFG) can alter the thinking process and neural basis of creativity. Participants' performance on the compound remote associates (CRA) task was analyzed considering the semantic features of each trial after receiving different tDCS protocols (left cathodal and right anodal, L + R-; right cathodal and left anodal, L-R+; and Sham). Moreover, we constructed and compared 80 prediction models of CRA performance for each group based on task-related functional connectivity. Results showed that L + R- stimulation improved performance in semantically bundled CRA trials, while L-R+ stimulation enhanced performance in trials with greater semantic distance. Furthermore, alpha-band task connectivity models for the L + R- group showed inferior performance and greater left frontal lateralization than other two groups. These findings suggest that tDCS targeting the bilateral IFG alters cognitive processes during creative ideation rather than enhancing or impairing an established thinking process.


Conflict of interest statement

Competing interests: The authors declare no competing interests.

Figures

Fig. 1
Fig. 1. Relationship between the RSD of CRA and the performance of CRA.
A Relationship between RSD and ACC; b Relationship between RSD and RT. Note. In Fig. 1a, the dots indicate the average ACC in each trial for the three groups. In (B), the dots indicate the RT for each trial. Shadows indicate standard errors. ACC accuracy on compound remote association task, RT reaction time on compound remote association task, RSD relative semantic distance, L+R− anodal stimulation of F7 and cathodal stimulation of F8, L−R+ cathodal stimulation of F7 and anodal stimulation of F8; SHAM sham control for tDCS.
Fig. 2
Fig. 2. Differences in classification performance across different bands and groups.
a ANOVA result; b AUC of L+R− group; c AUC of L−R+ group; d AUC of SHAM group. Note. In (bd), the upper curve indicates the model whose performance was at the 75th percentile among all models, and the lower curve indicates the model whose performance was at the 25th percentile among all models. AUC area under the curve; L+R− anodal stimulation on F7 and cathodal stimulation on F8; L−R+ cathodal stimulation on F7 and anodal stimulation on F8; SHAM sham control for tDCS. *p < 0.05.
Fig. 3
Fig. 3. Predictors that were significant by t-test with Bonferroni correction.
Bold lines indicate higher weights in the classification models. a alpha-band based model of L+R− group; b alpha-band based model of L−R+ group; c alpha-band based model of SHAM group; d beta-band based model of L+R− group; e beta-band based model of L−R+ group; f beta-band based model of SHAM group; Note. l left side; r right side; F frontal area; T temporal area; P parietal area; O occipital area; L+R− anodal stimulation on F7 and cathodal stimulation on F8; L−R+ cathodal stimulation on F7 and anodal stimulation on F8; SHAM sham control for tDCS.
Fig. 4
Fig. 4. Degrees of frontal activity in alpha and beta bands.
a ANOVA results for alpha band; b ANOVA results for at beta band; ce simulated distribution of activity at alpha band respectively for L+R−, L−R+, and SHAM group. The color distribution indicates the degrees in 80 classification models; the warmer the color, the greater the degrees. fh simulated distribution of activity at beta band respectively for L+R−, L−R+, and SHAM group. The color distribution indicates the degrees in 80 classification models; the colder the color, the greater the degrees. Note. L+R− anodal stimulation on F7 and cathodal stimulation on F8; L−R+ cathodal stimulation on F7 and anodal stimulation on F8; SHAM Sham control for tDCS. **p < 0.01. ***p < 0.001.
Fig. 5
Fig. 5. The general procedure of the present study.
Note. SAM Self-Assessment Manikin scale; RIBS Runco Ideational Behavior Scale, CRA compound remote association task.
Fig. 6
Fig. 6. The general procedure of classification modeling.
Twenty correct and twenty incorrect trials were randomly chosen as test data. Bayesian optimization and 10-fold cross-validation were used to identify the optimal model in each iteration. Eighty models were finally obtained for each group.

Similar articles

References

    1. Abraham, A. The Neuroscience of Creativity. (Cambridge University Press, 2018).
    1. Diedrich, J., Benedek, M., Jauk, E. & Neubauer, A. C. Are creative ideas novel and useful? Psychol. Aesthet. Creat. Arts9, 35–40 (2015).
    1. Runco, M. A. & Jaeger, G. J. The standard definition of creativity. Creat. Res. J.24, 92–96 (2012).
    1. Green, A. E., Beaty, R. E., Kenett, Y. N. & Kaufman, J. C. The process definition of creativity. Creat. Res. J.36, 544–572 (2023).
    1. Beaty, R. E., Benedek, M., Kaufman, S. B. & Silvia, P. J. Default and executive network coupling supports creative idea production. Sci. Rep.5, 10964 (2015). - PMC - PubMed

LinkOut - more resources