

Range-wide post- and pre-breeding migratory networks of a declining neotropical-nearctic migratory bird, the blackpoll warbler
- PMID: 39632945
- PMCID: PMC11618696
- DOI: 10.1038/s41598-024-80838-9
Range-wide post- and pre-breeding migratory networks of a declining neotropical-nearctic migratory bird, the blackpoll warbler
Abstract
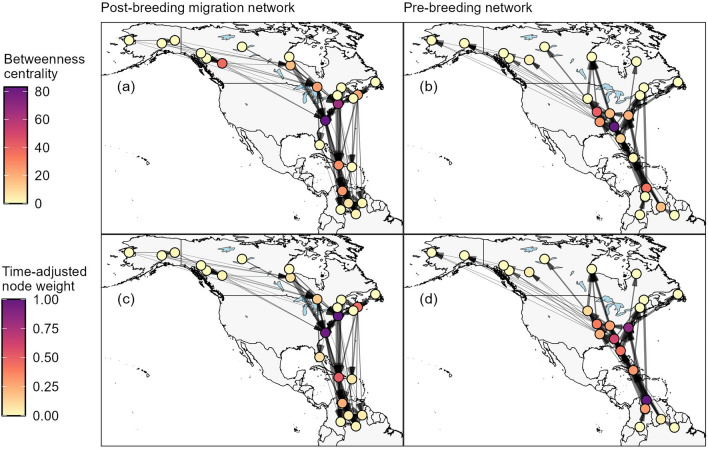
Identifying the drivers of population declines in migratory species requires an understanding of how individuals are distributed between periods of the annual cycle. We built post- (fall) and pre-breeding (spring) migratory networks for the blackpoll warbler (Setophaga striata), a Neotropical-Nearctic songbird, using tracking data from 47 light-level geolocators deployed at 11 sites across its breeding range. During pre-breeding migration, two stopover nodes (regions) on the U.S. eastern seaboard received high scores in our network metrics (betweenness centrality and time-adjusted node weight), likely acting as key refuelling areas for most of the global blackpoll warbler population before their multi-day flights over the Atlantic Ocean. During post-breeding migration, highly ranked stopover nodes in the southeastern U.S. acted as a geographical bottleneck before birds dispersed to their boreal breeding destinations. Nodes located in northern Colombia and Venezuela were also ranked highly during both migrations and were likely used to prepare for (pre-breeding) and recover from (post-breeding) Atlantic flights. Blackpoll warblers showed a crosswise migration pattern, whereby individuals from western breeding populations tended to spend the nonbreeding season in the eastern part of the nonbreeding range and vice-versa. Despite this, the strength of migratory connectivity between the breeding and nonbreeding grounds ranged from moderate to low, largely because many individuals used more than one node during the 'stationary' nonbreeding period. Our results suggest that the number of breeding populations affected by a threat in the blackpoll warbler's range will strongly depend on where and when this threat occurs. Consequently, our migratory network should be key to inform future conservation planning and population monitoring efforts.
Keywords: Conservation; Geolocator; Migratory stopovers; Movement ecology; Setophaga striata; eBird.
© 2024. The Author(s).
Conflict of interest statement
Declarations. Competing interests: The author(s) declare no competing interests. Ethical statements: All geolocator deployments and recoveries made as part of this study were made under the appropriate government and academic permits, and birds were manipulated following national ethical guidelines. Deployments in British Colombia and Yukon in 2018, were carried out under an Environmental and Climate Change Canada (ECCC) permit to capture and band migratory birds (10169 BZ). Deployments in Denali National Park, in 2018, were performed under a United States Geological Survey Bird Banding Permit (24141) and National Park Service Institutional Animal Care and Use Committee authorization (“AK DENA WRST McIntyre Birds 2018.A3”). Deployments in Québec, in 2019, occurred under two ECCC Canada Animal Care Committee permits (19JT05 and 20JT05). Deployments in Newfoundland, in 20219, were performed with an ECCC permit (10616). Deployments in Yellowknife, in 2019, occurred with authorization from the Government of the Northwest Territory Wildlife Care Committee (NWTWCC 2019–011) and a Government of the Northwest Territory Wildlife Research Permit (WL500745). Deployments in Colombia, in 2020, were carried out by SELVA under a permit from the Autoridad Nacional de Licencias Ambientales (ANLA) under Resolución 00874 issued in 2018.
Figures


Similar articles
-
Migratory connectivity of a Neotropical migratory songbird revealed by archival light-level geolocators.Ecol Appl. 2015 Mar;25(2):336-47. doi: 10.1890/14-0195.1. Ecol Appl. 2015. PMID: 26263658
-
Transoceanic migration by a 12 g songbird.Biol Lett. 2015 Apr;11(4):20141045. doi: 10.1098/rsbl.2014.1045. Biol Lett. 2015. PMID: 25832815 Free PMC article.
-
Population trends in Vermivora warblers are linked to strong migratory connectivity.Proc Natl Acad Sci U S A. 2018 Apr 3;115(14):E3192-E3200. doi: 10.1073/pnas.1718985115. Epub 2018 Feb 26. Proc Natl Acad Sci U S A. 2018. PMID: 29483273 Free PMC article.
-
Understanding the ecological and evolutionary function of stopover in migrating birds.Biol Rev Camb Philos Soc. 2022 Aug;97(4):1231-1252. doi: 10.1111/brv.12839. Epub 2022 Feb 8. Biol Rev Camb Philos Soc. 2022. PMID: 35137518 Review.
-
Origin stories: how does learned migratory behaviour arise in populations?Biol Rev Camb Philos Soc. 2025 Apr;100(2):996-1014. doi: 10.1111/brv.13171. Epub 2024 Dec 27. Biol Rev Camb Philos Soc. 2025. PMID: 39727267 Review.
References
-
- Harris, G., Thirgood, S., Hopcraft, J., Cromsight, J. & Berger, J. Global decline in aggregated migrations of large terrestrial mammals. Endanger. Species Res.7, 55–76 (2009).
-
- Lascelles, B. et al. Migratory marine species: their status, threats and conservation management needs. Aquat. Conserv. Mar. Freshw. Ecosyst.24, 111–127 (2014).
-
- Rosenberg, K. V. et al. Decline of the North American avifauna. Science366, 120–124 (2019). - PubMed
-
- Webster, M. S., Marra, P. P., Haig, S. M., Bensch, S. & Holmes, R. T. Links between worlds: Unraveling migratory connectivity. Trends Ecol. Evol.17, 76–83 (2002).
MeSH terms
LinkOut - more resources
Full Text Sources
