. 2024 Dec 4;14(1):30258.
doi: 10.1038/s41598-024-81592-8.

Dichotomous horizontal representation of acute deterioration risk on illnesses

Affiliations

Dichotomous horizontal representation of acute deterioration risk on illnesses

Ryo Hishiya et al. Sci Rep. .

Abstract

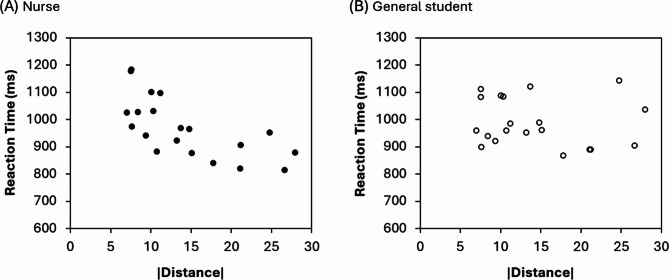
The possibility that risks interact with spatial information (such as the SNARC effect) has been explored but studies did not demonstrate a consistent left-to-right representation of risks. This is probably due to the perception of risk being different in each individual experience. The present study aimed to clarify the spatial characteristics of acute deterioration risks perceived from illnesses. Registered nurses and general students participated in the present experiment. They were instructed to judge, by pressing one of the left/right response buttons, whether the risk of a given target (illness name) presented on a computer screen was higher or lower compared to that of a standard stimulus. Reaction times to the target were measured. No spatial-risk association was observed in the comprehensive analysis, but further inspection revealed that approximately half of the participants have a left-to-right representation and the other half have a right-to-left representation. Moreover, participants' responses appeared to be faster when the target was representationally farther away from the standard stimulus (i.e., distance effect). These findings therefore suggest a spatially aligned magnitude representation of acute deterioration risk (i.e., mental risk line) but this horizontal risk orientation is likely to be dichotomous depending on the individuals and/or given situations.


Conflict of interest statement

Declarations. Competing interests: The authors declare no competing interests. Ethical approval: This study was approved by the Research Ethics Committee of Tokyo Metropolitan University Minami-Osawa Campus (Approval number: H5-78 and H6-114). All participants were informed of the study procedure and signed the written informed consent form before participating in the study. Additionally, the study was conducted in accordance with the Declaration of Helsinki.

Figures

Fig. 1
Fig. 1
The results of a three-way ANOVA performed on the reaction times and the correct response rates. (A) and (B) show the results for the RTs of nurses and general students, respectively. (C) and (D) show the results for the correct response rates of nurses and general students, respectively. The error bar in all figures indicates the standard error. We hypothesized that a significant interaction between the response side and the risk would be observed. However, the results indicate no significant interaction between the two factors for both RTs and correct response rates, suggesting that the SRARC effect was not observed in the comprehensive analysis. The asterisks indicate significant differences determined by the post hoc analysis of the simple main effect (*p < .05; **p < .01; ***p < .001).
Fig. 2
Fig. 2
The results of the slope coefficient of the SRARC effect. (A) and (B) depict the results of the linear regression of nurses and general students, respectively. In (A) and (B), the x-axis indicates the level of risk, and the y-axis indicates the dRTs (the RTs of left-side response – the RTs of right-side response). The error bar indicates the standard error. A one-sample t-test showed no SRARC effect in either group. (C) and (D) show the scatter plot of the results concerning the slope coefficient. In (C), the x-axis indicates the RTs, and the y-axis indicates the slope coefficient which represents the strength and the direction of the SRARC effect. We hypothesized that the mental risk line across all participants was representationally encoded from left to right with a positive value of the slope coefficient. However, the results indicated that 56.3% of participants showed a positive value and 43.8% of them showed a negative value. In (D), the x-axis indicates the slope of the first half (i.e., the results of the first and second trial blocks) and the y-axis indicates that of the second half (i.e., the results of the third and fourth trial blocks) in the task. The results indicated that the number of participants with a positive slope value increased in the second half (68.8%) compared to the first half (52.1%).
Fig. 3
Fig. 3
The scatter plots between the representational distance and the RTs to each illness. (A) and (B) depict the scatter plots for nurses and general students, respectively. In both figures, the x-axis indicates the absolute values of the representational distance from the standard stimulus defined by the pre-experiment. The y-axis indicates the reaction time to each illness. Thus, 20 plots per group, corresponding with the number of presented illness names, are depicted in this figure.
Fig. 4
Fig. 4
The dRTs depicted by the condition of response mapping in the first block. (A) and (B) showed the results obtained from nurses and general students, respectively. In each panel, the x-axis indicates the level of risk, and the y-axis indicates the dRT (the RTs of left-side response – the RTs of right-side response). The error bar indicates the standard error. The results showed that in both groups the participants’ spatial representation was opposite to the given response rule of the first block.
Fig. 5
Fig. 5
The sequence of stimulus presentation in a trial of the risk comparison task. In a normal trial (A), the trial began with the presentation of the fixation cross (1200 ms), followed by the standard stimulus (i.e., the strings of “prostate cancer”) (1200 ms). Then, after the blank screen presentation (1200 ms), the target stimulus was presented randomly among 20 illnesses until participants pressed the left or right button depending on the experimental condition. On the other hand, in a catch trial (B), the flow of the stimulus presentation was the same as in the normal trial except that “prostate cancer” was presented for 3000 ms instead of the target stimuli in the catch trials. The catch trials were no-go trials where participants were asked not to respond with either button.

Similar articles

References

    1. Romero-Brufau, S. et al. The fifth vital sign? Nurse worry predicts inpatient deterioration within 24 hours. JAMIA Open2, 465–470 (2019). - PMC - PubMed
    1. Thompson, C. et al. The effects of time pressure and experience on nurses’ risk assessment decisions. Nurs. Res.57, 302–311 (2008). - PubMed
    1. Fitts, P. M. The information capacity of the human motor system in controlling the amplitude of movement. J. Exp. Psychol.47, 381–391 (1954). - PubMed
    1. Macnamara, A., Loetscher, T. & Keage, H. A. D. Judging risk magnitude: Walking to the left and base jumping to the right. Exp. Brain Res.237, 653–662 (2019). - PubMed
    1. Dehaene, S., Bossini, S. & Giraux, P. The mental representation of parity and number magnitude. J. Exp. Psychol. Gen.122, 371–396 (1993).

LinkOut - more resources