. 2025 Jan;44(2):331-355.
doi: 10.1038/s44318-024-00327-7. Epub 2024 Dec 4.

Kinesin-like motor protein KIF23 maintains neural stem and progenitor cell pools in the developing cortex

Affiliations

Kinesin-like motor protein KIF23 maintains neural stem and progenitor cell pools in the developing cortex

Sharmin Naher et al. EMBO J. 2025 Jan.

Abstract

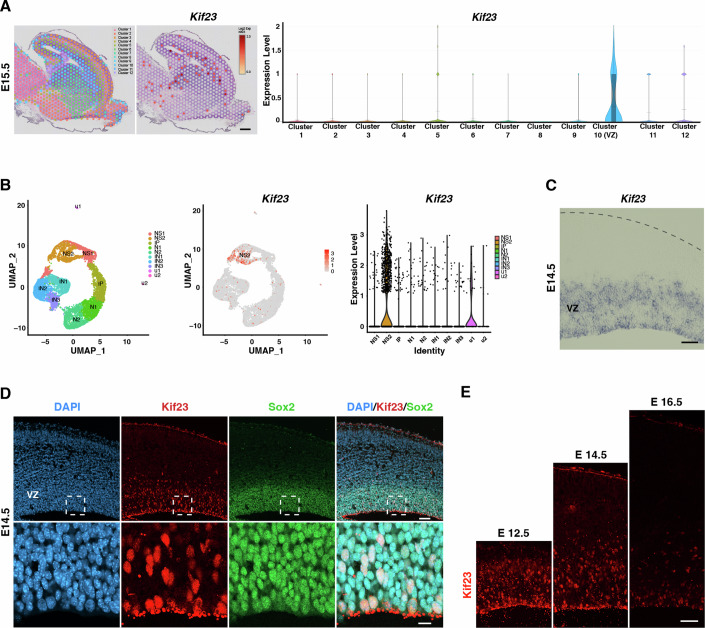
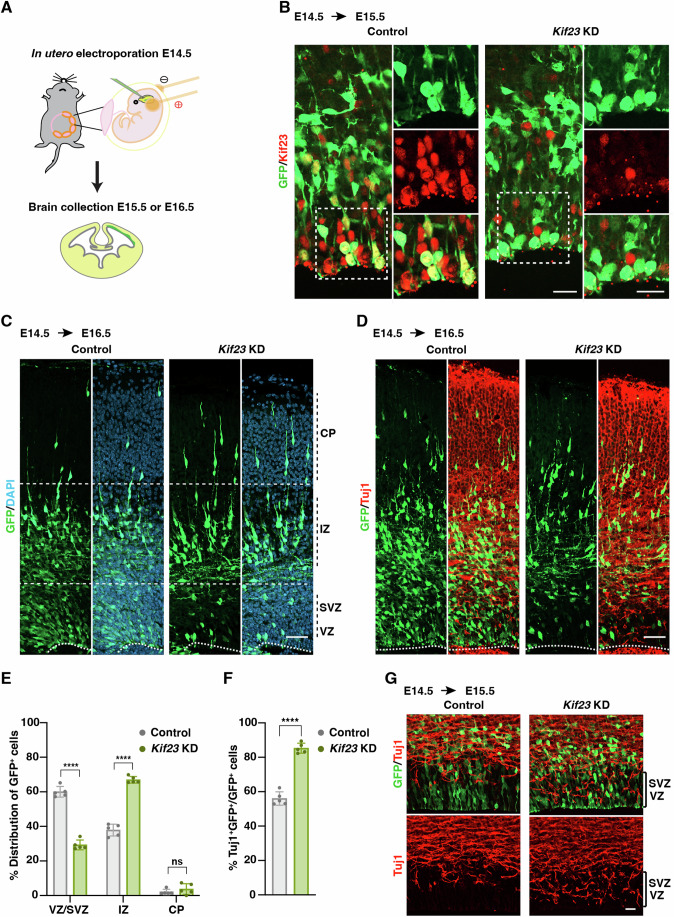
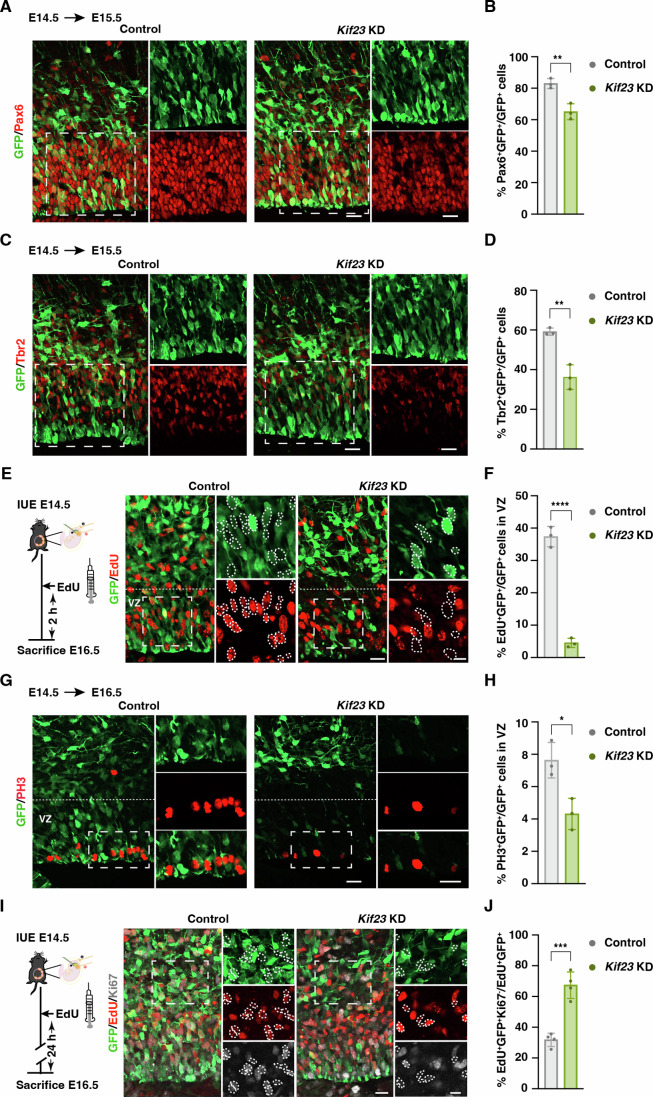
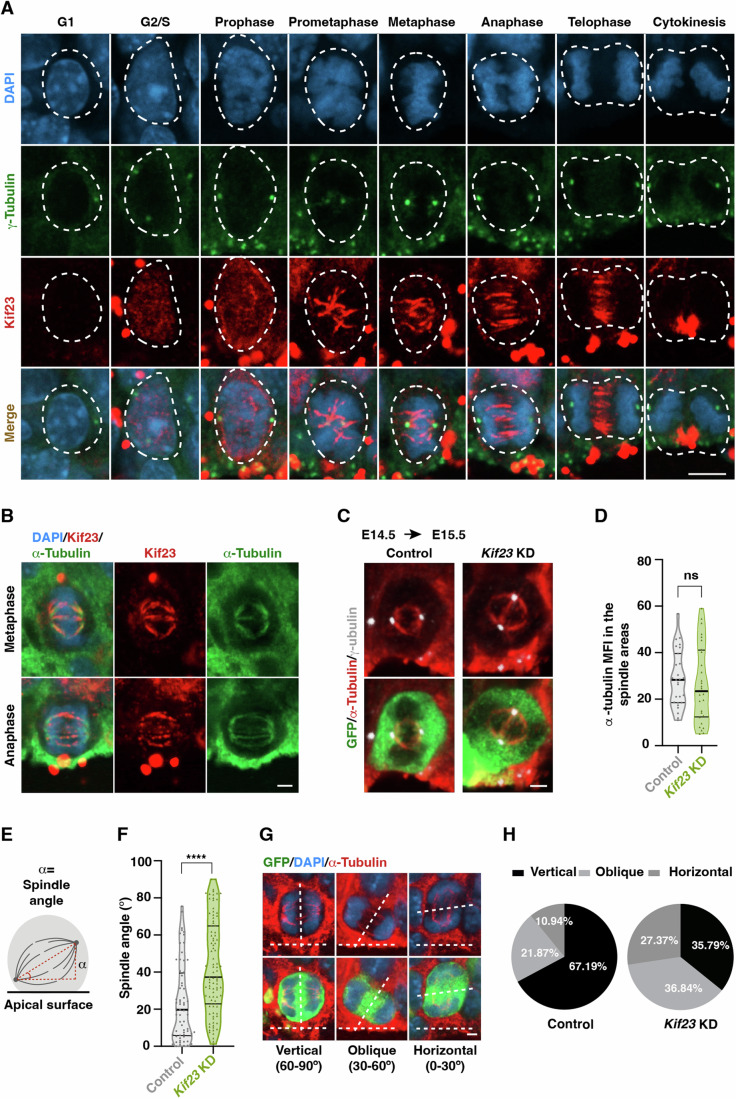
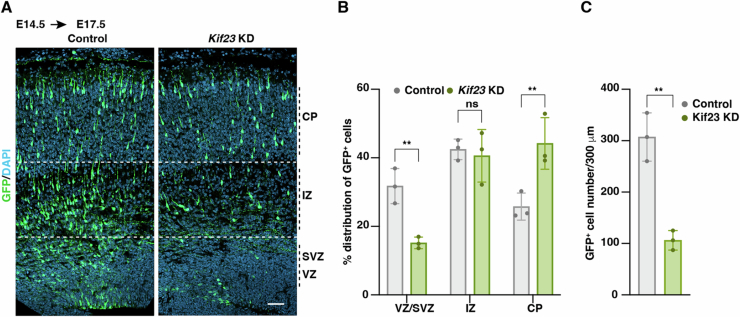
Accurate mitotic division of neural stem and progenitor cells (NSPCs) is crucial for the coordinated generation of progenitors and mature neurons, which determines cortical size and structure. While mutations in the kinesin-like motor protein KIF23 gene have been recently linked to microcephaly in humans, the underlying mechanisms remain elusive. Here, we explore the pivotal role of KIF23 in embryonic cortical development. We characterize the dynamic expression of KIF23 in the cortical NSPCs of mice, ferrets, and humans during embryonic neurogenesis. Knockdown of Kif23 in mice results in precocious neurogenesis and neuronal apoptosis, attributed to an accelerated cell cycle exit, likely resulting from disrupted mitotic spindle orientation and impaired cytokinesis. Additionally, KIF23 depletion perturbs the apical surface structure of NSPCs by affecting the localization of apical junction proteins. We further demonstrate that the phenotypes induced by Kif23 knockdown are rescued by introducing wild-type human KIF23, but not by a microcephaly-associated variant. Our findings unveil a previously unexplored role of KIF23 in neural stem and progenitor cell maintenance via regulating spindle orientation and apical structure in addition to cytokinesis, shedding light on microcephaly pathogenesis.

Keywords: Apoptosis; Cytokinesis; Kinesin Motor Proteins; Microcephaly; Neurogenesis.


Conflict of interest statement

Disclosure and competing interests statement. The authors declare no competing interests.

Figures

Figure 1
Figure 1. Kif23 expression in the developing neocortex.
(A) Visium spatial gene expression analysis of E15.5 mouse brain showing gene expression clusters (left), spatial plots (middle), and violin plots (right) to show the spatial expression of Kif23. The dataset was obtained from Tsai et al, . Kif23 is enriched in the cluster 10. Scale bar, 300 μm. (B) Single-cell RNA-seq analysis of E14.5 mouse cortex showing cell type clusters (left), feature plots (middle), and violin plots (right) to show the expression of Kif23. The dataset was obtained from Loo et al, . Kif23 is enriched in the neural stem/progenitor cells cluster 2 (NS2). NS1, neural stem/progenitor cells cluster 1; IP, intermediate progenitor cells cluster; N1 and N2, neurons cluster 1 and 2; IN1, IN2 and IN3, interneurons cluster 1, 2 and 3. (C) Expression of Kif23 mRNA detected by in situ hybridization of E14.5 embryonic mouse cortex. Kif23 is localized in the ventricular zone (VZ). Scale bar, 30 μm. (D) Representative image of E14.5 mouse cortex stained with the antibodies to Kif23 and Sox2, a marker of neural stem progenitor cells (NSPCs) and DAPI. Kif23 is co-localized with Sox2. Boxed areas are magnified in the bottom panel. Scale bars, 50 μm (top) and 10 μm (bottom). (E) Immunostaining of the mouse cortex at E12.5, E14.5 and E16.5 showing expression of Kif23 at a higher level in E12.5 and E14.5. Scale bar, 50 μm. Source data are available online for this figure.
Figure 2
Figure 2. Kif23 knockdown induces premature neuronal differentiation.
(A) Schematic diagram of Kif23 knockdown (KD) by in-utero electroporation. The embryonic mouse brains were electroporated at E14.5 with control or Kif23 siRNA. (B) Representative images stained for GFP and Kif23 in the E15.5 mouse cortices after in-utero electroporation. The expression of Kif23 is effectively suppressed by Kif23 siRNA. Boxed areas are magnified. Scale bars, 20 μm. (C) Representative images of the distribution of GFP+ cells in the control and Kif23-KD cortices. Dashed lines illustrate the ventricular surface and the borders among the ventricular zone/ subventricular zone (VZ/SVZ), intermediate zone (IZ), and cortical plate (CP). Scale bar, 50 μm. (D) Representative images of the control and Kif23-KD cortices at E16.5 stained for GFP and Tuj1. Dashed lines illustrate the ventricular surface. Scale bar, 50 μm. (E) Quantification of the distribution of GFP+ cells in VZ/SVZ, IZ, and CP, respectively within the 150 μm wide column of E16.5 cortices. The data represent the mean ± SD (Control n = 874 cells, 5 embryos; Kif23-KD n = 433 cells, 5 embryos). Two-way ANOVA with Bonferroni’s multiple comparisons test, p values from left to right: ****p = 9.0E-15, ****p = 2.9E-14, ns not significant. (F) Quantification of the percentage of Tuj1+GFP+ cells relative to the total GFP+ cells within the 150 μm wide column of E16.5 cortices. The data represent the mean ± SD (Control n = 894 cells, 5 embryos; Kif23-KD n = 408 cells, 5 embryos). Two-tailed Student’s t test, ****p = 9.6E-07. (G) Representative images of the control and Kif23-KD cortices at E15.5 stained for GFP and Tuj1. Scale bar, 20 μm. Source data are available online for this figure.
Figure 3
Figure 3. Kif23 deficiency leads to cytokinetic defect and neuronal apoptosis.
(AC) Representative images of E15.5 control and Kif23-KD cortices stained against GFP, CC3, and DAPI showing pyknotic cells across various cortical zones (A). Ventricular zone (VZ), subventricular zone (SVZ), and intermediate zone (IZ). Scale bars, 20 μm. Quantification of the percentage of pyknotic cells VZ, SVZ, and IZ, respectively (B) or CC3+ cells (C) relative to the total GFP+ cells within the 320 μm wide column of E15.5 cortices. The data represent the mean ± SD (Control n = 1167 cells, 3 embryos; Kif23-KD n = 1248 cells, embryos). Multiple t tests, p values from left to right: ***p = 0.000294, **p = 0.005134, **p = 0.003350 (B). Two-tailed Student’s t test, ****p = 6.3E-05 (C). (D, E) Representative images of E15.5 Kif23-KD cortical sections stained for GFP, Sox2, Tbr2, Hu, Tuj1, and DAPI (D). Scale bars, 20 μm. Close arrowheads indicate Sox2+, or Tbr2+, or Hu+, or Tuj1+ pyknotic cells. Open arrowheads indicate Sox2-, or Tbr2-, or Hu-, or Tuj1- pyknotic cells. Quantification of the ratio of pyknotic cells positive for Sox2, Tbr2, Hu, and Tuj1 within the 110 μm wide column of E15.5 cortices (E). The data represent the mean ± SD (n = 148 cells, 3 embryos for Sox2+ group; n = 131 cells, 3 embryos for Tbr2+ group; n = 163 cells, 4 embryos for Hu+ group; n = 234 cells, 4 embryos for Tuj1+ group). (F, G) Representative images of E15.5 Kif23 siRNA transfected cortices stained for CC3 and DAPI (F). Top right panel: binucleated cell stained with DAPI. Bottom right panel: the 3D image of the binucleated cell. Scale bars, 20 μm (left) and 1 μm (right). Open arrowheads indicate pyknotic single with micronuclei. Closed arrowheads indicate pyknotic doublets. Quantification of the percentage of pyknotic cells relative to the total GFP+ cells within the 320 μm wide column of E15.5 cortices (G). The data represent the mean ± SD (Control n = 1167 cells, 3 embryos; Kif23-KD n = 1248 cells, 3 embryos). Multiple t tests, p values from left to right: ***p = 0.000193, ***p = 0.000302. Source data are available online for this figure.
Figure 4
Figure 4. Kif23 deficiency depletes NSPCs pool and induce premature cell cycle exit.
(A, B) Representative images of the control and Kif23-KD cortices at E15.5 stained for GFP and Pax6 (A). Boxed areas denote zoomed areas. Scale bars, 20 μm. Quantification of the percentage of Pax6+GFP+ cells relative to the total GFP+ cells within the 100 μm wide column of E15.5 cortices (B). The data represent the mean ± SD (Control n = 524 cells, 3 embryos; Kif23-KD n = 450 cells, 3 embryos). Two-tailed Student’s t test, **p = 0.006541. (C, D) Representative images of the control and Kif23-KD cortices at E15.5 stained for GFP and Tbr2 (C). Boxed areas denote zoomed areas. Scale bars, 20 μm. Quantification of the percentage of Tbr2+GFP+ cells relative to the total GFP+ cells within the 100 μm wide column of E15.5 cortices (D). The data represent the mean ± SD (Control n = 547 cells, 3 embryos; Kif23-KD n = 494 cells, 3 embryos). Two-tailed Student’s t test, **p = 0.003548. (E, F) Timeline of the in-utero electroporation and EdU injection (left). Electroporated cortical sections were stained for GFP and EdU (right) (E). Dashed lines illustrate the boundary for the ventricular zone (VZ). Boxed areas denote zoomed areas. Scattered lines encircle GFP+ cells that are EdU+ or EdU. Scale bars, 20 μm. Quantification of the percentage of EdU+GFP+ cells relative to the total GFP+ cells within the VZ of 150 μm wide column of E16.5 cortices (F). The data represent the mean ± SD (Control n = 415 cells, 3 embryos; Kif23-KD n = 87 cells, 3 embryos). Two-tailed Student’s t test, ****p = 7.8E-05. (G, H) Representative images of the control and Kif23-KD cortices at E16.5 stained for GFP and PH3 (G). Dashed lines illustrate the boundary for the ventricular zone (VZ). Boxed areas denote zoomed areas. Scale bars, 25 μm. Quantification of the percentage of PH3+GFP+ cells relative to the total GFP+ cells within the VZ of 200 μm wide column of E16.5 cortices (H). The data represent the mean ± SD (Control n = 208 cells, 3 embryos; Kif23-KD n = 72 cells, 3 embryos). Two-tailed Student’s t test, *p = 0.017095. (I, J) Timeline of the in-utero electroporation and EdU injection (left). Electroporated cortical sections were stained for GFP, Ki67, and EdU (right) (I). Boxed areas denote zoomed areas. Scattered lines encircle EdU+GFP+ cells that are Ki67+ or Ki67. Scale bars, 20 μm. Quantification of the percentage of EdU+GFP+Ki67 cells relative to the total EdU+GFP+ cells within the 200 μm wide column of E16.5 cortices (J). The data represent the mean ± SD (Control n = 460 cells, 4 embryos; Kif23-KD n = 121 cells, 4 embryos). Two-tailed Student’s t test, ***p = 0.000318. Source data are available online for this figure.
Figure 5
Figure 5. Knockdown of Kif23 disrupts the orientation of mitotic spindle.
(A, B) Representative images of WT E14.5 cortex stained for Kif23, DAPI and γ-tubulin (centrosomal marker) (A) or α-tubulin (microtubule marker) (B). Dashed lines indicate cells in the different stages of the cell cycle. Scale bars, 5 μm (A); 2 μm (B). (C, D) Representative images of the electroporated brain sections at E15.5 stained for GFP, α-tubulin, and γ-tubulin (C). Scale bar, 2 μm. Quantification of the mean fluorescence intensity of α-tubulin in the spindle areas of GFP+ metaphase cells (D). The data represent n = 27 cells, 9 embryos for the control group; n = 28 cells, 11 embryos for the Kif23-KD group. The thick and thin black horizontal lines represent the medians and the quartiles, respectively. Two-tailed Student’s t test, ns: not significant. (E, F) Graphical representation of spindle angle measurement (E). Distribution of spindle angles (°) (F). The data represent n = 64 cells, 10 embryos for the control group; n = 95 cells, 12 embryos for the Kif23-KD group. The thick and thin black horizontal lines represent the medians and the quartiles, respectively. Two-tailed Student’s t test, ****p = 1.8E-06. (G, H) Representative images of vertical, oblique, and horizontal cleavage plane orientation stained against GFP, α-tubulin, and DAPI (G). Scale bar, 2 μm. White dashed lines indicate the cleavage plane. Quantification of the percentage of each class of spindle cleavage plane orientation (H). Data represent n = 64 cells, 10 embryos for the control group; n = 95, 12 embryos for the Kif23-KD group. Source data are available online for this figure.
Figure 6
Figure 6. Kif23 deficiency impairs the localization of cytokinetic molecules.
(A, B) Images of E15.5 control and Kif23-KD cortical sections stained for GFP and ECT2 (A). Examples of cells at the anaphase stage are outlined in the ventricular zone (VZ), and arrows point to the spindle midzone. Scale bar, 5 μm. Quantification of the mean fluorescence intensity of ECT2 in the spindle midzone of GFP+ anaphase cells (B). The data represent n = 54 cells, 11 embryos for the control group; n = 58 cells, 16 embryos for the Kif23-KD group. The thick and thin black horizontal lines represent the medians and the quartiles, respectively. Two-tailed Student’s t test, ****p = 5.8E-09. (C, D) Images of E15.5 control and Kif23-KD cortical sections stained for GFP and RhoA to show RhoA localization in the VZ containing GFP+ cells (C). Scale bar, 10 μm. Quantification of the mean fluorescence intensity of apical RhoA (within 30 μm from the GFP+ ventricular surface) (D). The data represent the mean ± SD (Control n = 9 embryos; Kif23-KD n = 10 embryos). Two-tailed Student’s t test, ***p = 0.000129. (E) Images of WT E14.5 cortex to show the co-localization of Cit-K and Kif23 at the apical surface of the VZ. Scale bars, 2 μm. (F, G) Images of E15.5 control and Kif23-KD cortical sections stained for GFP and Cit-K (F). Arrows point to apical midbodies in the VZ. Scale bar, 10 μm. Quantification of the ratio of Cit-K labeled apical midbodies relative to the apical GFP+ cells within the 160 μm wide column of E15.5 cortices (G). The data represent the mean ± SD (Control n = 158, 5 embryos; Kif23-KD n = 173, 5 embryos). Two-tailed Student’s t test, **p = 0.001335. Source data are available online for this figure.
Figure 7
Figure 7. Knockdown of Kif23 results in upregulation of cell cycle arrest and cell apoptosis pathway.
(AF) Representative images of E15.5 control and Kif23-KD cortices stained for GFP and γ-H2AX (A) or GFP and p53 (C) or GFP and p21 (E). Scale bars, 20 μm. Quantification of the percentage of GFP+ cells that are γ-H2AX+ (B), p53+ (D) or p21+ (F). The data represent the mean ± SD (Control n = 510 cells, 3 embryos; Kif23-KD n = 551 cells, 3 embryos for γ-H2AX; Control n = 1054 cells, 3 embryos; Kif23-KD n = 1257 cells, 3 embryos for p53; Control n = 650 cells, 3 embryos; Kif23-KD n = 574 cells, 3 embryos for p21). Multiple t tests, p values from left to right: ***p = 0.000861, **p = 0.007526 (B); ****p = 1.3E-05, ***p = 0.000936 (D); **p = 0.001724, **p = 0.001724 (F). Source data are available online for this figure.
Figure 8
Figure 8. Knockdown of Kif23 results in the disruption of apical junction integrity.
(A) Representative images of the control and Kif23-KD cortical sections at E15.5 stained for GFP, F-actin, p120-catenin, and β-catenin. Scale bars, 20 μm. (BD) Schematic illustration of the whole mount immunohistochemistry to observe the apical structure (B). Whole-mount images of the electroporated brain sections immunostained for GFP and ZO-1 (C). Scale bars, 20 μm. Quantification of the apical domain areas (D). The data represent n = 363 apical domains, 4 embryos for the control group; n = 475 apical domains, 6 embryos for the Kif23-KD group. The thick and thin black horizontal dash lines represent the medians and the quartiles, respectively. Two-tailed Student’s t test, ****p < 1.0E-15. Source data are available online for this figure.
Figure 9
Figure 9. Kif23 knockdown defects can be rescued by WT human KI23 but not by mutant found in microcephaly patients.
(A) Single-cell RNA-seq analysis of gestational week 17–18 human fetal cortex showing cell type clusters (left), feature plots (middle), and violin plots (right) to show the expression of KIF23. The dataset was obtained from Polioudakis et al, . vRG ventricular radial glia, oRG outer radial glia, PgS progenitors in S phase, PgG2M progenitors in G2M phase, IP intermediate progenitor, ExN excitatory newborn neurons, ExM maturing excitatory neurons, ExM-U maturing upper layer excitatory neurons, ExDp deep layer excitatory neurons, InMGE medial ganglionic eminence interneurons, InCGE caudal ganglionic eminence interneurons, OPCs oligodendrocyte precursor cells, End endothelial cells, Per pericytes. (BD) Diagram of WT human KIF23 and mutant KIF23 constructs, and overview of the experiment (B). Representative images of the mouse cortices two days after in-utero electroporation of indicated constructs stained for GFP and DAPI (C). Scale bar, 50 μm. Quantification of the distribution of GFP+ cells in VZ/SVZ, IZ, and CP, respectively within the 200 μm wide column of E16.5 cortices (D). The data represent the mean ± SD (n = 1379 cells, 6 embryos for control siRNA + pCAX group; n = 507 cells, 5 embryos for Kif23 siRNA + pCAX group; n = 768 cells, 4 embryos for Kif23 siRNA + pCAX-hKIF23 group; n = 1467 cells, 8 embryos for Kif23 siRNA + pCAX-mhKIF23 group). One-way ANOVA with Bonferroni’s multiple comparisons test, p values from left to right: ****p = 4.5E-11, ****p = 1.9E-06, ****p = 1.6E-12, ****p = 7.4E-08, ns: not significant (vs control siRNA + pCAX group); ####p = 4.2E-10, ####p = 4.9E-07, ####p = 1.2E-11, ####p = 3.5E-08, ns: not significant (vs Kif23 siRNA + pCAX group); ΔΔΔΔp = 2.4E-05, ΔΔΔΔp = 7.8E-07, ns: not significant (vs Kif23 siRNA + pCAX-mhKIF23 group). Source data are available online for this figure.
Figure EV1
Figure EV1. Knockdown of Kif23 leads to profound loss of GFP expressing cells.
(A) Representative images of GFP+ cells distribution in the control and Kif23-KD cortices at E17.5. Dashed lines illustrate the borders among VZ/SVZ, IZ, and CP. Scale bar, 50 μm. (B) Quantification of GFP+ cells distribution in VZ/SVZ, IZ, and CP, respectively within the 300 μm wide column of E17.5 cortices. The data represent the mean ± SD Control n = 921 cells, 3 embryos; Kif23-KD n = 318 cells, 3 embryos). Two-way ANOVA with Bonferroni’s multiple comparison test, p values from left to right: **p = 0.007258, **p = 0.003357, ns: not significant. (C) Quantification of the average number of GFP+ cells within the 300 μm wide column of E17.5 cortices. The data represent the mean ± SD (Control n = 921 cells, 3 embryos; Kif23-KD n = 318 cells, 3 embryos). Two-tailed Student’s t test, **p = 0.002355.
Figure EV2
Figure EV2. Kif23 knockdown reduces Kif23 protein level in the microtubule.
Representative images of the control and Kif23-KD cortical sections at E15.5 stained for GFP, Kif23, and DAPI. Examples of GFP+ cells at the metaphase or anaphase stage are outlined. Scale bar, 2 μm.
Figure EV3
Figure EV3. Kif23 siRNA decreases mouse Kif23 protein levels, not human KIF23.
(A) Schematic overview of the experiment. (B) Representative images of mouse cortices one day after electroporation of pCAX or pCAX-hKIF23 stained for GFP and Kif23/KIF23. Scale bar, 20 μm. (C) Representative images of mouse cortices one day after electroporation of Kif23 siRNA/pCAX, Kif23 siRNA/pCAX-hKIF23 or Kif23 siRNA/pCAX-mhKIF23 stained for GFP and Kif23/KIF23. Scale bar, 20 μm.

Similar articles

Cited by

References

    1. Adams RR, Tavares AA, Salzberg A, Bellen HJ, Glover DM (1998) pavarotti encodes a kinesin-like protein required to organize the central spindle and contractile ring for cytokinesis. Genes Dev 12:1483–1494 - PMC - PubMed
    1. Asselin L, Rivera Alvarez J, Heide S, Bonnet CS, Tilly P, Vitet H, Weber C, Bacino CA, Baranaño K, Chassevent A et al (2020) Mutations in the KIF21B kinesin gene cause neurodevelopmental disorders through imbalanced canonical motor activity. Nat Commun 11:2441 - PMC - PubMed
    1. Bai X, Melesse M, Sorensen Turpin CG, Sloan DE, Chen CY, Wang WC, Lee PY, Simmons JR, Nebenfuehr B, Mitchell D et al (2020) Aurora B functions at the apical surface after specialized cytokinesis during morphogenesis in C. elegans. Development 147:dev181099 - PMC - PubMed
    1. Boonsawat P, Joset P, Steindl K, Oneda B, Gogoll L, Azzarello-Burri S, Sheth F, Datar C, Verma IC, Puri RD et al (2019) Elucidation of the phenotypic spectrum and genetic landscape in primary and secondary microcephaly. Genet Med 21:2043–2058 - PMC - PubMed
    1. Breznau EB, Semack AC, Higashi T, Miller AL (2015) MgcRacGAP restricts active RhoA at the cytokinetic furrow and both RhoA and Rac1 at cell-cell junctions in epithelial cells. Mol Biol Cell 26:2439–2455 - PMC - PubMed

LinkOut - more resources