. 2024 Dec;3(12):1549-1567.
doi: 10.1038/s44161-024-00577-y. Epub 2024 Dec 4.

Pharmacological blocking of neutrophil extracellular traps attenuates immunothrombosis and neuroinflammation in cerebral cavernous malformation

Affiliations

Pharmacological blocking of neutrophil extracellular traps attenuates immunothrombosis and neuroinflammation in cerebral cavernous malformation

Favour C Onyeogaziri et al. Nat Cardiovasc Res. 2024 Dec.

Abstract

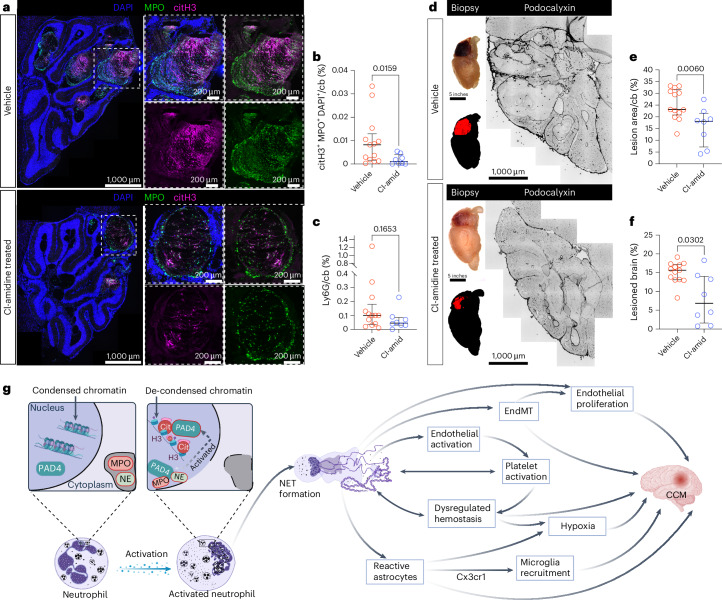
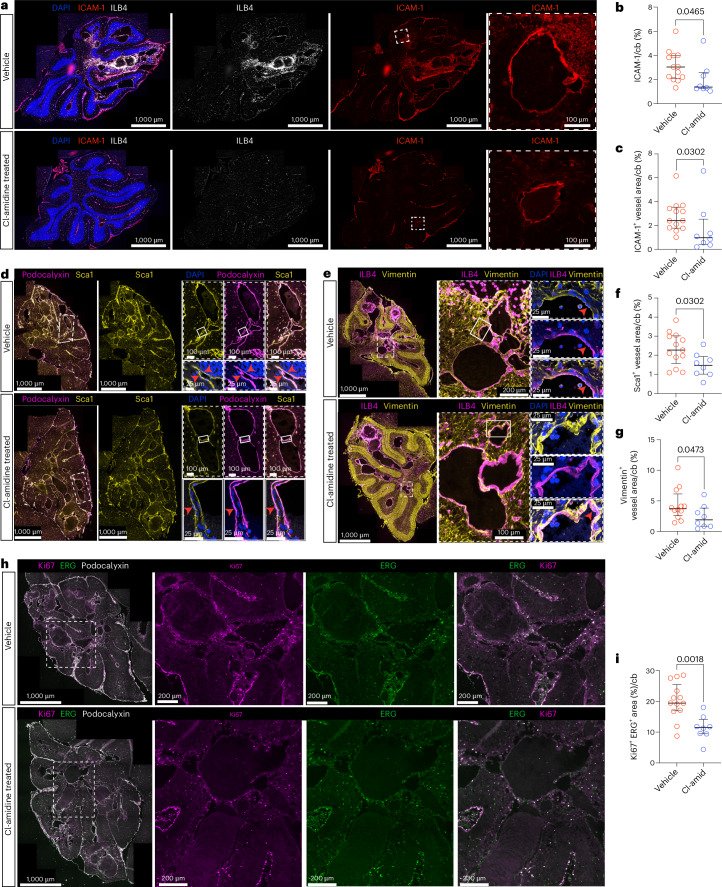
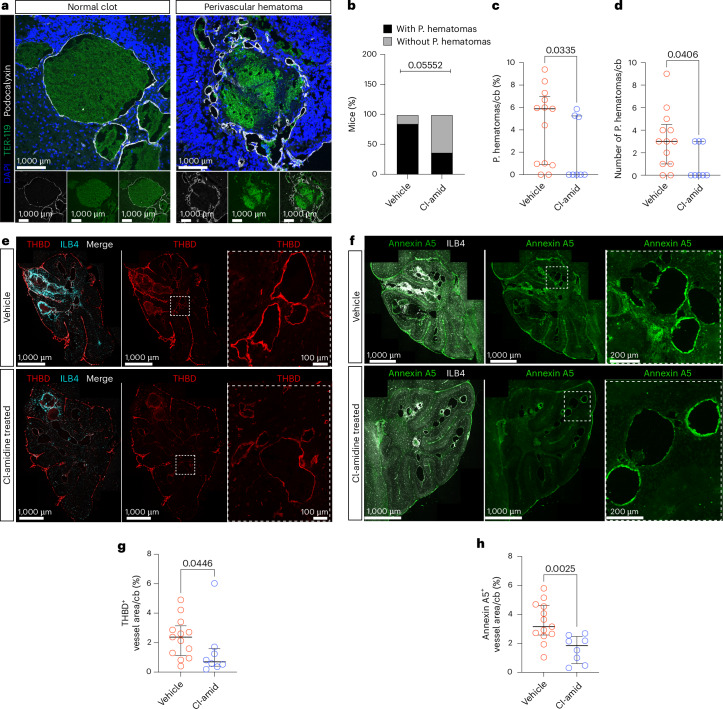
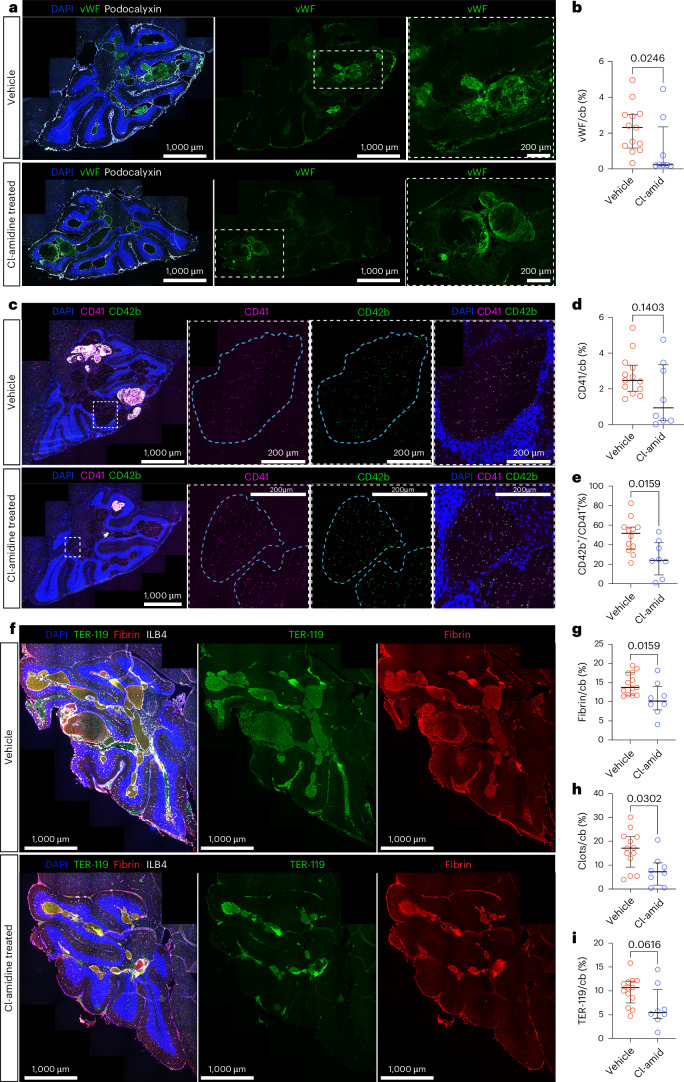
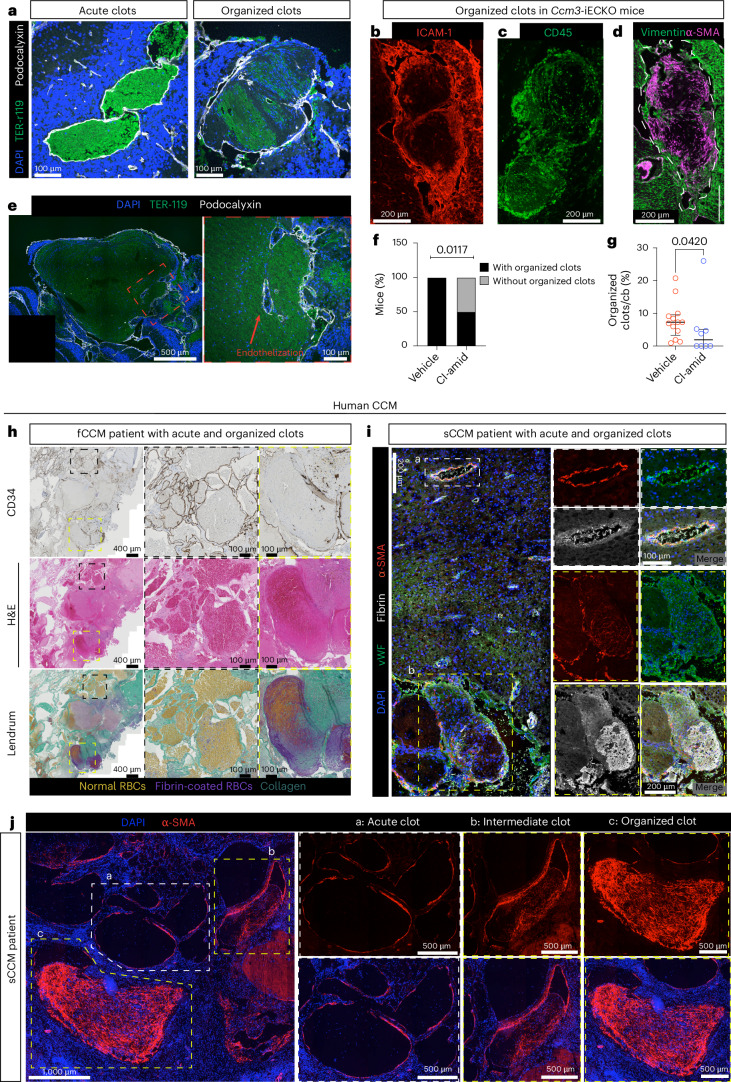
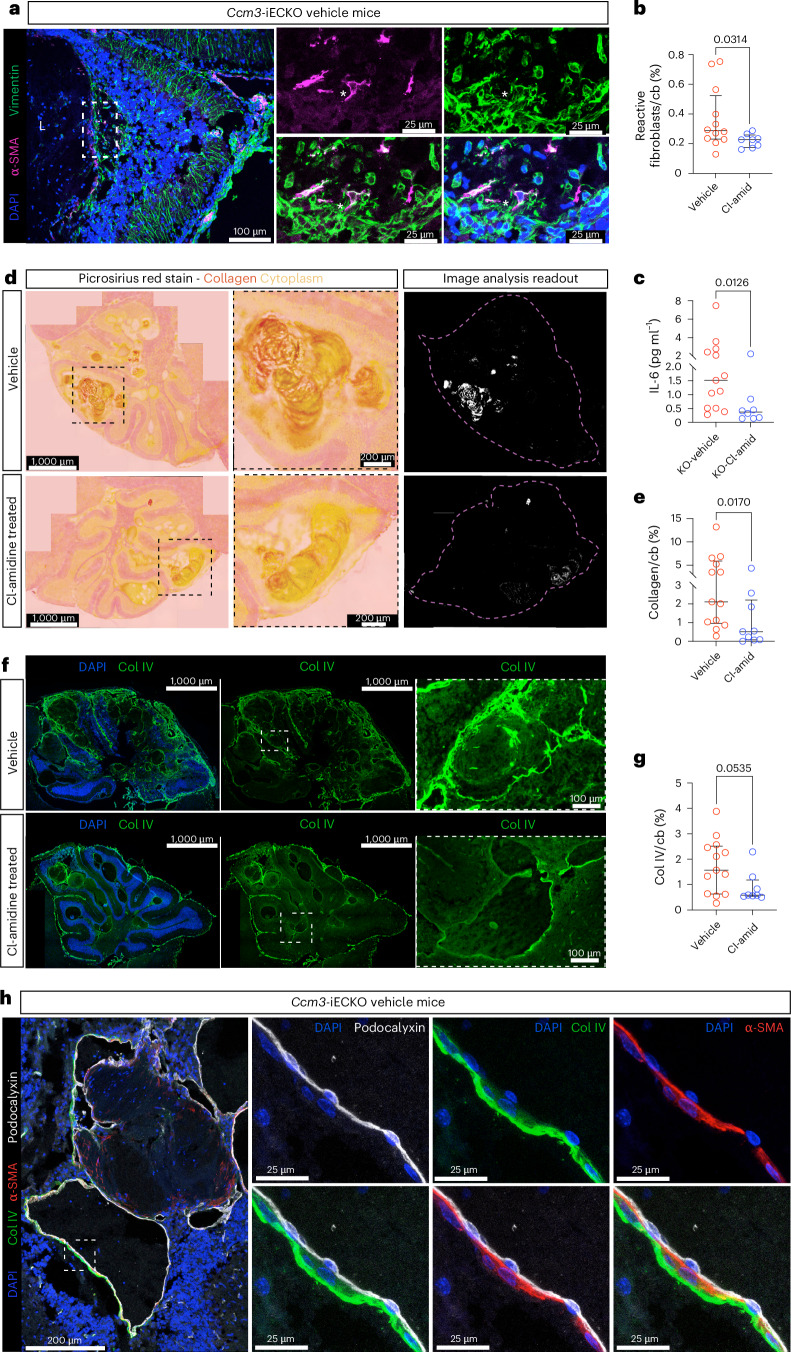
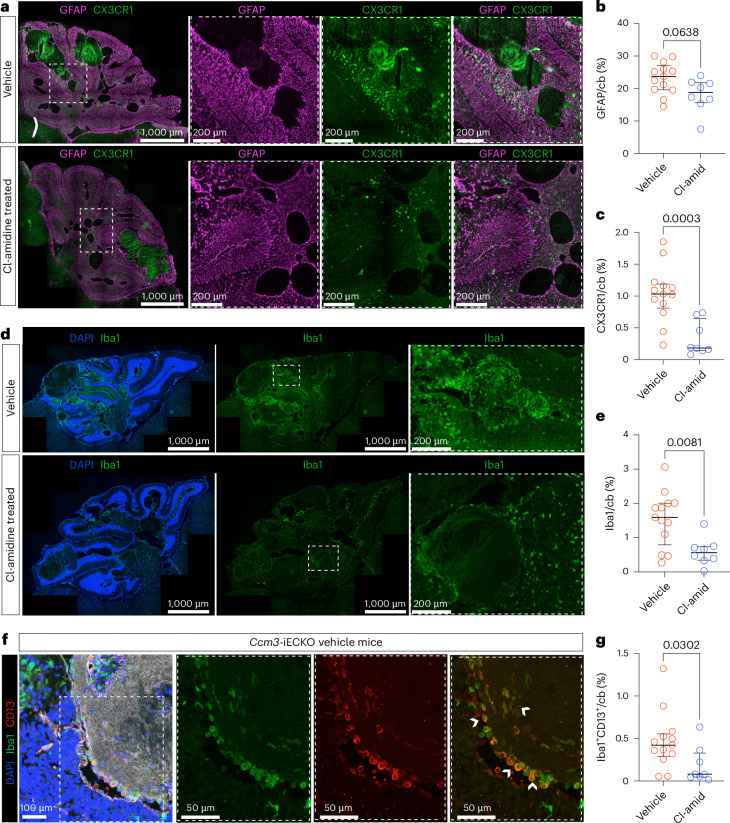
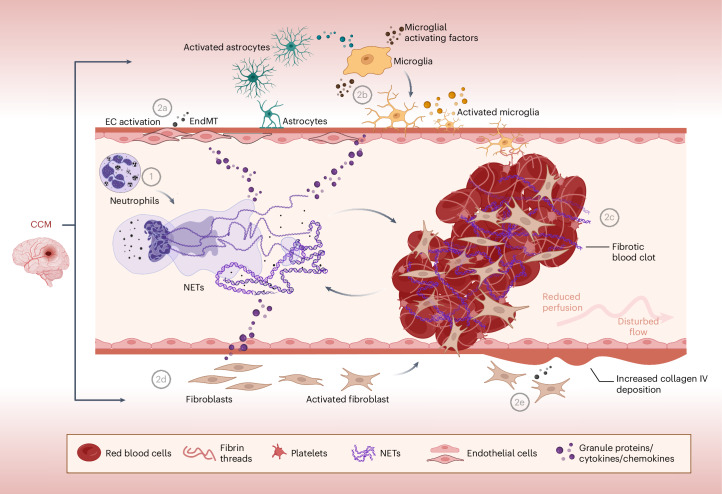
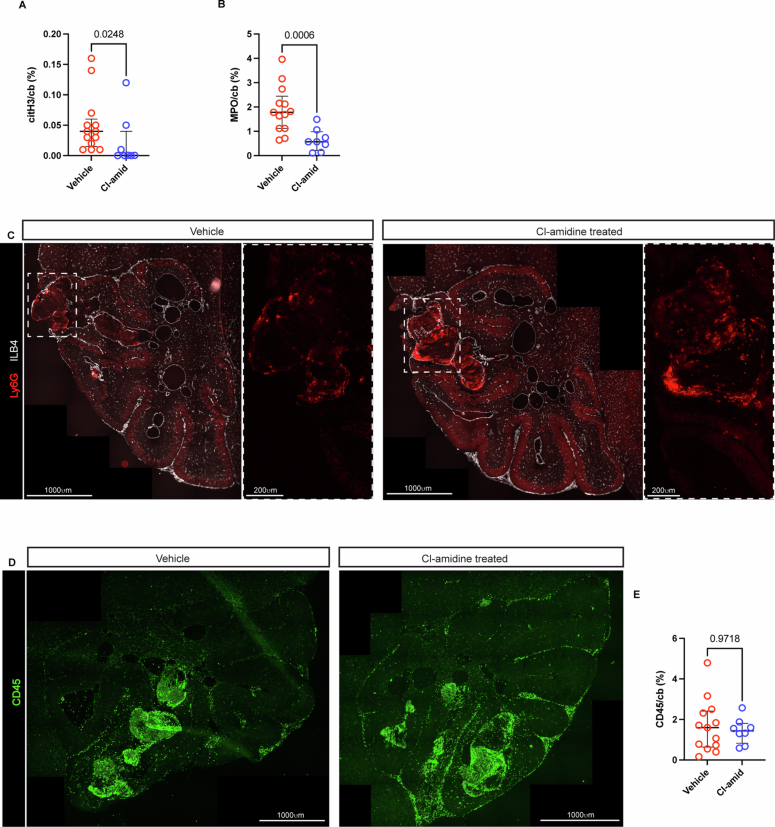
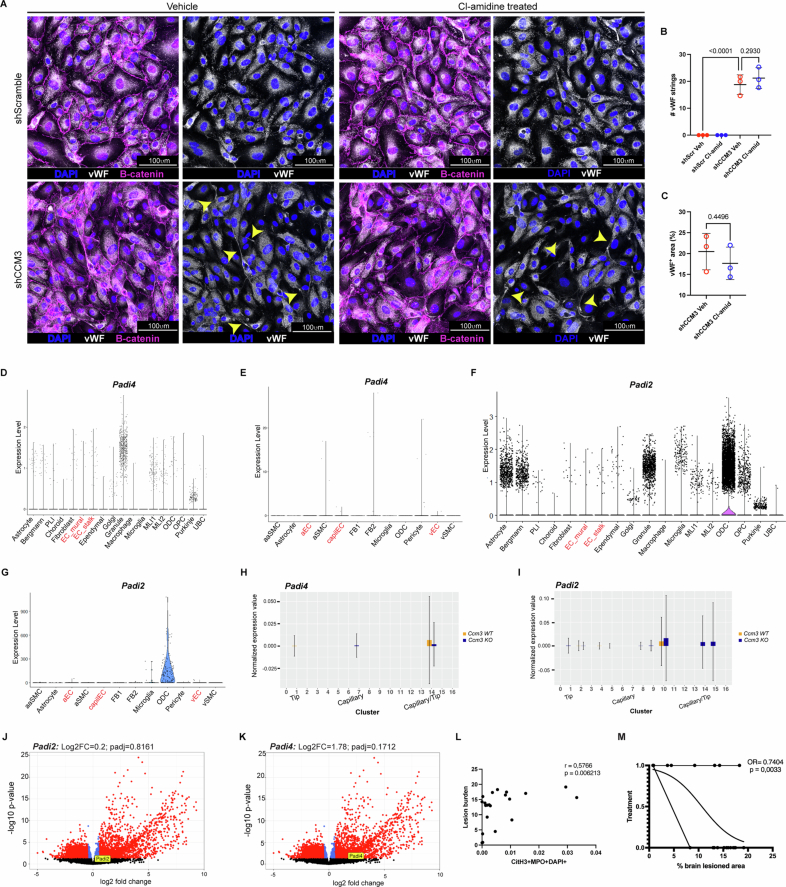
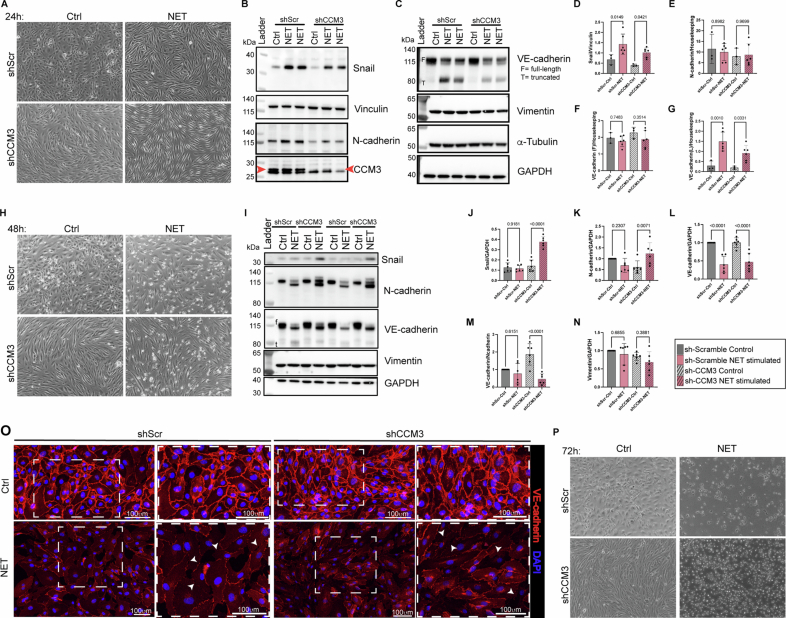
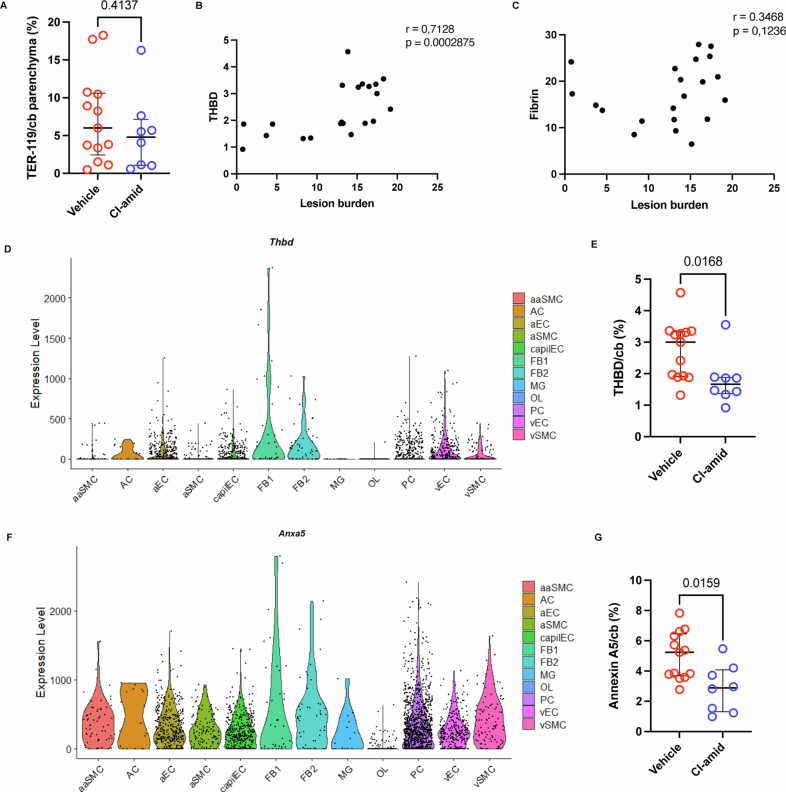
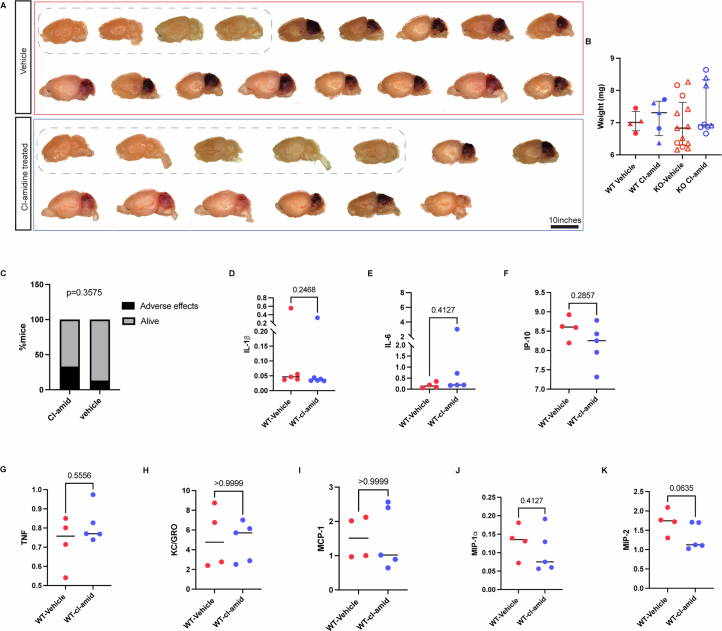
Cerebral cavernous malformation (CCM) is a neurovascular disease with symptoms such as strokes, hemorrhages and neurological deficits. With surgery being the only treatment strategy, understanding the molecular mechanisms of CCM is crucial in finding alternative therapeutic options for CCM. Neutrophil extracellular traps (NETs) were recently reported in CCM, and NETs were shown to have positive or negative effects in different disease contexts. In this study, we investigated the roles of NETs in CCM by pharmacologically inhibiting NET formation using Cl-amidine (a peptidyl arginine deiminase inhibitor). We show here that Cl-amidine treatment reduced lesion burden, coagulation and endothelial-to-mesenchymal transition. Furthermore, NETs promoted the activation of microglia and fibroblasts, leading to increased neuroinflammation and a chronic wound microenvironment in CCM. The inhibition of NET formation caused endothelial quiescence and promoted a healthier microenvironment. Our study suggests the inhibition of NETs as a potential therapeutic strategy in CCM.


Conflict of interest statement

Competing interests: The authors declare no competing interests.

Figures

Fig. 1
Fig. 1. Cl-amidine treatment attenuated NETs and lesion formation in CCM.
a, Representative images of the cerebellum of Ccm3-iECKO vehicle-treated mice (upper panel) and Cl-amidine-treated (10 mg kg−1 d−1) mice (lower panel) stained with DAPI (blue), MPO (green) and citH3 (magenta). Insets (right) are zoomed-in regions. b,c, Quantification of citH3+MPO+DAPI+ NETs (b) and Ly6G (c) in the cerebellum of Ccm3-iECKO vehicle-treated (n = 13) and Cl-amidine-treated (10 mg kg−1 d−1; n = 8) mice. d, Representative images of mouse brains used in the study and the output from the semi-automated quantification of lesion burden in the brain of Ccm3-iECKO vehicle-treated and Cl-amidine-treated (10 mg kg−1 d−1) mice. e,f, Quantification of lesion area (e) and lesion burden (f) within the cerebellum of Ccm3-iECKO vehicle-treated (n = 13) and Cl-amidine-treated (10 mg kg−1 d−1; n = 8) mice. In the graphs, each data point represents one biological replicate; the bar indicates the median of each group; and the error bars represent the IQR. Statistical significance was determined using a Mann–Whitney U-test (two-tailed). g, Schematic depicting the process of NET formation (left) and the pathways affected by NETs and CCM. NETs were reported to induce endothelial activation. Endothelial activation facilitates the binding of platelets,, leading to increased thrombi formation. NETs can also directly induce platelet activation. Continuous thrombi formation would lead to ischemia/hypoxia within the brain. EndMT is a known driver of CCM lesion progression and was reported to be promoted by NETosis. Endothelial cells that undergo EndMT become mesenchymal and, consequently, more proliferative and highly mobile, leading to lesion growth. Reactive astrogliosis was shown to promote CCM pathogenesis directly through HIF1/VEGF hypoxia pathway and indirectly by attracting microglial cells via CX3CR1 (ref. ). This figure was created with BioRender. cb, cerebellum. Source data
Fig. 2
Fig. 2. Cl-amidine reduced endothelial activation, EndMT and proliferation in CCM.
a, Representative images of the cerebellum of Ccm3-iECKO vehicle-treated mice (upper panel) and Cl-amidine-treated (10 mg kg−1 d−1) mice (lower panel) stained with DAPI (blue), ICAM-1 (red) and ILB4 (white). Insets with white line highlight magnifications to the right. b,c, Quantification of total ICAM-1+ area (b) and vascular (ILB4+) ICAM-1+ area (c) in the cerebellum of Ccm3-iECKO vehicle-treated (n = 13) and Cl-amidine-treated (10 mg kg−1 d−1; n = 8) mice. d, Representative images of endothelial cells undergoing EndMT in the cerebellum of Ccm3-iECKO mice stained with DAPI (blue), Sca1 (yellow) and podocalyxin (magenta). Co-localization of Sca1 and podocalyxin is shown as white. Insets with dashed, white line are shown in the magnifications to the right. Insets with white line are shown in the magnifications to the bottom, showing zoomed-in areas with EndMT with nuclei stained with DAPI (blue). e, Representative images of endothelial cells undergoing EndMT in the cerebellum of Ccm3-iECKO mice stained with DAPI (blue), vimentin (yellow) and ILB4 (magenta). Co-localization of vimentin and ILB4 markers is shown as white. Insets with dashed, white line are shown in the magnifications to the right. Insets with white line are shown in the magnifications to the bottom, showing zoomed-in areas with EndMT with nuclei stained with DAPI (blue). f, Quantification of vascular (podocalyxin+) Sca1+ area in the cerebellum of Ccm3-iECKO vehicle-treated (n = 13) and Cl-amidine-treated (10 mg kg−1 d−1; n = 8) mice. g, Quantification of vascular (podocalyxin+) vimentin+ area in the cerebellum of Ccm3-iECKO vehicle-treated (n = 12) and Cl-amidine-treated (10 mg kg−1 d−1; n = 8) mice. h, Representative images of the cerebellum of Ccm3-iECKO vehicle-treated mice (upper panel) and Cl-amidine-treated (10 mg kg−1 d−1) mice (lower panel) stained with Ki67 (magenta), ERG (green) and podocalyxin (white). Insets with dashed, white lines are shown in the magnifications to the right. i, Quantification of Ki67+ vascular (ERG+) area in the cerebellum of Ccm3-iECKO vehicle-treated (n = 13) and Cl-amidine-treated (10 mg kg−1 d−1; n = 8) mice. In the graphs, each data point represents one biological replicate; the bar indicates the median of each group; and the error bars represent the IQR. Statistical significance was determined using a Mann–Whitney U-test (two-tailed). cb, cerebellum. Source data
Fig. 3
Fig. 3. Cl-amidine reduced perivascular hematomas and anti-coagulant proteins in CCM.
a, Representative images of a normal clot (left) and a perivascular hematoma (right) in the cerebellum of Ccm3-iECKO vehicle-treated mice stained with DAPI (blue), TER-119 (green) and podocalyxin (white). b, Quantification of percentage of mice with perivascular hematomas in Ccm3-iECKO vehicle-treated (n = 13) and Cl-amidine-treated (10 mg kg−1 d−1; n = 8) mice. Statistical significance was analyzed with Fisher’s exact t-test. c,d, Quantification of the number and area of perivascular hematomas in the cerebellum of Ccm3-iECKO vehicle-treated (n = 13) and Cl-amidine-treated (10 mg kg−1 d−1; n = 8) mice. e, Representative images of the cerebellum of Ccm3-iECKO vehicle-treated mice (upper panel) and Cl-amidine-treated (10 mg kg−1 d−1) mice (lower panel) stained with THBD (red) and ILB4 (cyan). Insets with dashed, white line are shown in the magnifications to the right. f, Representative images of the cerebellum of Ccm3-iECKO vehicle-treated mice (upper panel) and Cl-amidine-treated (10 mg kg−1 d−1) mice (lower panel) stained with annexin A5 (green) and ILB4 (white). Insets with dashed, white line are shown in the magnifications to the right. g,h, Quantification of vascular (ILB4+) THBD expression (g) and vascular (ILB4+) annexin A5 expression (h) in the cerebellum of Ccm3-iECKO vehicle-treated (n = 13) and Cl-amidine-treated (10 mg kg−1 d−1; n = 8) mice. In the graphs c,d and in g,h, each data point represents one biological replicate; the bar indicates the median of each group; and the error bars represent the IQR. Statistical significance was determined using a Mann–Whitney U-test (two-tailed). cb, cerebellum; P. hematoma, perivascular hematoma; THBD, thrombomodulin. Source data
Fig. 4
Fig. 4. Cl-amidine reduced platelet activation and coagulation in CCM.
a, Representative images of the cerebellum of Ccm3-iECKO vehicle-treated mice (upper panel) and Cl-amidine-treated (10 mg kg−1 d−1) mice (lower panel) stained with DAPI (blue), vWF (green) and podocalyxin (white). Insets with dashed, white line are shown in the magnifications to the right. b, Quantification of vWF+ area in the cerebellum of Ccm3-iECKO vehicle-treated (n = 13) and Cl-amidine-treated (10 mg kg−1 d−1; n = 8) mice. c, Representative images of the cerebellum of Ccm3-iECKO vehicle-treated mice (upper panel) and Cl-amidine-treated (10 mg kg−1 d−1) mice (lower panel) stained with DAPI (blue), CD41(magenta) and CD42b (green). Insets with dashed, white line are shown in the magnifications to the right (lesion periphery is shown with blue lines). d, Quantification of CD41+ area in the cerebellum of Ccm3-iECKO vehicle-treated (n = 13) and Cl-amidine-treated (10 mg kg−1 d−1; n = 8) mice. e, Quantification of total platelet (CD41+) area that is activated (CD42b+) in the cerebellum of Ccm3-iECKO vehicle-treated (n = 12) and Cl-amidine-treated (10 mg kg−1 d−1; n = 8) mice. f, Representative images of the cerebellum of Ccm3-iECKO vehicle-treated mice (upper panel) and Cl-amidine-treated (10 mg kg−1 d−1) mice (lower panel) stained with DAPI (blue), TER-119 (erythrocytes, green), fibrin (red) and ILB4 (white). gi, Quantification of fibrin+ area (h), clot area (defined as lumens with fibrin and erythrocytes; g) and TER-119+ area (i), in the cerebellum of Ccm3-iECKO vehicle-treated (n = 13) and Cl-amidine-treated (10 mg kg−1 d−1; n = 8) mice. In the graphs, each data point represents one biological replicate; the bar indicates the median of each group; and the error bars represent the IQR. Statistical significance was determined using a Mann–Whitney U-test (two-tailed). cb, cerebellum. Source data
Fig. 5
Fig. 5. Impaired clot resolution in CCM is improved with Cl-amidine treatment.
a, Representative images of acute (left) and chronic/organized (right) clots from the cerebellum of Ccm3-iECKO vehicle mice stained with DAPI (blue), TER-119 (green) and podocalyxin (white). bd, Representative image of organized clots from the cerebellum of Ccm3-iECKO vehicle mice with increased ICAM-1 expression (red) (b), infiltrated with CD45+ cells (green) (c) and with increased expression of vimentin (green) and α-SMA (magenta) (d). e, Representative image showing endothelization of organized clots in the cerebellum of Ccm3-iECKO vehicle mice stained with DAPI (blue), TER-119 (green) and podocalyxin (white). Insets with red line highlight the magnifications to the right, with red arrow highlighting new vessels. f,g, Quantification of number of mice with organized clot (f) and organized clot area (g) in the cerebellum of Ccm3-iECKO Ccm3-iECKO vehicle-treated (n = 13) and Cl-amidine-treated (10 mg kg−1 d−1; n = 8) mice. Each data point represents one biological replicate; the bar indicates the median of each group; and the error bars represent the IQR. Statistical significance was determined using a Mann–Whitney U-test (two-tailed). h, Representative images of patients with familial CCM (fCCM) showing acute (black box) and organized (yellow box) clots. Samples were stained for CD34 (top panel), hematoxylin and eosin (middle panel) and Fraser–Lendrum stain (bottom panel). The stains were repeated independently in all samples (n = 3) with similar results. i, Representative images of acute (black box) and organized (yellow box) clots in sporadic CCM (sCCM) patient biopsy stained with DAPI (blue), vWF (green), α-SMA (red) and fibrin (white). Insets with white lines highlight the magnifications below. The stains were repeated independently in all samples (n = 4) with similar results. j, Representative images stained with DAPI (blue) and α-SMA (red) showing different clot stages from acute (white box; a) to intermediate (yellow box; b) and organized (yellow box; c) clots. Insets highlight the magnifications to the right. a: lesion without α-SMA deposition—acute clot; b: lesion with moderate α-SMA deposition—intermediate clot; c: lesion with intense α-SMA deposition—organized clot. The stains were repeated independently in all samples (n = 4) with similar results. cb, cerebellum. Source data
Fig. 6
Fig. 6. Cl-amidine treatment reduced Col IV deposition in the extracellular matrix and activated fibroblasts in CCM.
a, Representative images of reactive fibroblasts in the cerebellum of Ccm3-iECKO mice stained with DAPI (blue), α-SMA (magenta) and vimentin (green). * represents reactive fibroblast expressing vimentin and α-SMA. b, Quantification of percentage of reactive fibroblast population in the cerebellum of Ccm3-iECKO vehicle-treated (n = 12) and Cl-amidine-treated (10 mg kg−1 d−1; n = 8) mice. c, Quantification of IL-6 levels in the plasma of Ccm3-iECKO vehicle-treated (n = 13) and Cl-amidine-treated (10 mg kg−1 d−1; n = 8) mice. d, Representative images of the cerebellum of Ccm3-iECKO vehicle-treated mice (upper panel) and Cl-amidine-treated (10 mg kg−1 d−1) mice (lower panel) stained with picrosirius red (collagen, red/orange; cytoplasm, yellow). Insets with dashed, black line are shown in the magnifications in the middle. Representation of the image analysis output is shown to the right. e, Quantification of collagen expression in the cerebellum of Ccm3-iECKO vehicle-treated (n = 13) and Cl-amidine-treated (10 mg kg−1 d−1; n = 8) mice. f, Representative images of the cerebellum of Ccm3-iECKO vehicle-treated mice (upper panel) and Cl-amidine-treated (10 mg kg−1 d−1) mice (lower panel) stained with DAPI (blue) and Col IV (green). Insets with dashed, white line are shown in the magnifications to the right. g, Quantification of total Col IV expression in the cerebellum of Ccm3-iECKO vehicle-treated (n = 13) and Cl-amidine-treated (10 mg kg−1 d−1; n = 8) mice. h, Representative images showing that Col IV is expressed in non-endothelial cells in Ccm3-iECKO mice stained with DAPI (blue), Col IV (green) and α-SMA (red). The stains were repeated independently in all samples (n = 21) with similar results. In the graphs, each data point represents one biological replicate; the bar indicates the median of each group; and the error bars represent the IQR. Statistical significance was determined using a Mann–Whitney U-test (two-tailed). cb, cerebellum. Source data
Fig. 7
Fig. 7. Cl-amidine reduced neuroinflammation in CCM.
a, Representative images of the cerebellum of Ccm3-iECKO vehicle-treated mice (upper panel) and Cl-amidine-treated (10 mg kg−1 d−1) mice (lower panel) stained with GFAP (magenta) and CX3CR1 (green). Insets with dashed, white line are shown in the magnifications to the right. b, Quantification of GFAP expression in the cerebellum of Ccm3-iECKO vehicle-treated (n = 13) and Cl-amidine-treated (10 mg kg−1 d−1; n = 8) mice. c, Quantification of CX3CR1 expression in the cerebellum of Ccm3-iECKO vehicle-treated (n = 13) and Cl-amidine-treated (10 mg kg−1 d−1; n = 8) mice. d, Representative images of the cerebellum of Ccm3-iECKO vehicle-treated mice (upper panel) and Cl-amidine-treated (10 mg kg−1 d−1) mice (lower panel) stained with DAPI (blue) and Iba1 (green). Insets with dashed, white line are shown in the magnifications to the right. e, Quantification of Iba1 expression in the cerebellum of Ccm3-iECKO vehicle-treated (n = 13) and Cl-amidine-treated (10 mg kg−1 d−1; n = 8) mice. f, Representative images of reactive microglia in the cerebellum of Ccm3-iECKO mice stained with DAPI (blue), CD13 (red) and Iba1 (green). Insets with dashed, white line are shown in the magnifications to the right. White arrows represent reactive microglia expressing Iba1 and CD13. g, Quantification of percentage of reactive microglia in the cerebellum of Ccm3-iECKO vehicle-treated (n = 13) and Cl-amidine-treated (10 mg kg−1 d−1; n = 8) mice. Insets (far right) are zoomed-in regions. In the graphs, each data point represents one biological replicate; the bar indicates the median of each group; and the error bars represent the IQR. Statistical significance was determined using a Mann–Whitney U-test (two-tailed). cb, cerebellum. Source data
Fig. 8
Fig. 8. Graphical summary of findings.
Representative summary of the findings of this study. In CCM, neutrophils become activated, leading to the release of NETs (1). These NETs trigger or exacerbate processes dysregulated in CCM: endothelial activation and EndMT (2a), neuroinflammation (2b), coagulation and clot organization (2c), fibroblast activation (2d) and increased collagen deposition (2e). The graphical abstract was created with BioRender.
Extended Data Fig. 1
Extended Data Fig. 1. Cl-amidine’s effect on immune cells.
(a, b) Quantification of citH3+ (a), MPO+ (b) in the cerebellum (cb) of Ccm3-iECKO vehicle and Cl-amidine (10 mg/kg/day) treated mice. (c) Representative images of the cerebellum of Ccm3-iECKO vehicle and Cl-amidine treated mice stained with Ly6G (red), and ILB4 (white). (d) Representative images of the cerebellum of Ccm3-iECKO vehicle and Cl-amidine treated mice stained with CD45 (green) to detect immune cells. (e) Quantification of CD45 in the cerebellum (cb) of Ccm3-iECKO vehicle (n = 13) and Cl-amidine (10 mg/kg/day; n = 8) treated mice. In the graphs, each data point represents one biological replicate, the bar indicates the median of each group, and the error bars represent the interquartile range. Statistical significance was determined using a Mann–Whitney U test (two tailed). Source data
Extended Data Fig. 2
Extended Data Fig. 2. Padi2 and Padi4 expression in mouse brain is minimal.
(a) Representative images of HBMVECs (shScramble, top and shCCM3, bottom) treated with vehicle control (left) or 6 μM Cl-amidine (right) for 24 h. Stained for vWF (white), B-catenin (magenta), and DAPI (blue). Arrows highlight vWF strings. (b) Quantification of the number of vWF strings per field of view in shScramble (shScr) and shCCM3 HBMVECs treated with vehicle or 6 μM Cl-amidine. Each data point represents 1 biological replicate (n = 3) with three fields of view imaged and quantified per condition. The bar indicates the mean of each group, and the error bars represent the standard deviation. Statistical significance was determined using one-way ANOVA followed by a post-hoc Holm-sidak’s test. (c) Quantification of the number of total vWF area per field of view in shCCM3 HBMVECs treated with vehicle or 6 μM Cl-amidine. Each data point represents 1 biological replicate (n = 3) with three fields of view imaged per condition. The bar indicates the mean of each group, and the error bars represent the standard deviation. (d, e) Gene expression of Padi4 in mouse brain cerebellum (D) and vascular and perivascular cells (E). (f, g) Gene expression of Padi2 in mouse brain cerebellum (F) and vascular and perivascular cells (G). (h, i): Bulk RNA-seq data of Padi4 (H) and Padi2 (I) in mouse brain endothelial cells. The error bars represent the standard deviation. (J-K) single cell RNA-seq data of Padi4 (j) and Padi2 (k) in mouse brain cells; Thresholds: blue signifies log2FC ≥ 0.5 & padj ≤ 0.05, red signifies log2FC < 0.5 & padj ≤ 0.05, black signifies p value > 0.05. (l) Correlation analysis of lesion burden to NET burden characterized by citH3+MPO + DAPI+ signals. (m) Logistic regression graph showing the relationship between receiving treatment (1) or not (0) and lesion burden. OR: odds ratio, p: significance level. Source data
Extended Data Fig. 3
Extended Data Fig. 3. Effect of NET stimulation on HBMVECs.
(a) Representative images of HBMVECs (shScramble (shScr), top and shCCM3, bottom) stimulated with 500 ng/mL NET-enriched supernatant or control (Ctrl) media for 24 h showing changes in cell morphology (n = 3). (b–g) Representative western blot images of HBMVECs (shscramble or shCCM3) stimulated with 500 ng/mL NET-enriched supernatant or control media for 24 h (n = 3 biological replicates) (B-C) and quantified (D-G; in E-G normalization was done to α-tubulin or GAPDH). (h) Representative images of HBMVECs (shScramble, top and shCCM3, bottom) stimulated with 500 ng/mL NET-enriched supernatant or control (Ctrl) media for 48 h showing showing changes in cell morphology (n = 6 biological replicates). (i–n) Representative western blot images of HBMVECs (shscramble or shCCM3) stimulated with 500 ng/mL NET-enriched supernatant or control media for 48 h (n = 6) (J) and quantified (J-N). (o) Representative images of HBMVECs (shScramble, left and shCCM3, right) stimulated with NET-enriched supernatant (bottom) or control (Ctrl; top) media for 48 h stained for VE-cadherin (red; junction) and DAPI (blue; nuclei). White arrow head highlights areas with no VE-cadherin staining. The stains were repeated independently three times with similar results. (p) Representative images of HBMVECs (shScramble, top and shCCM3, bottom) stimulated with 500 ng/mL NET-enriched supernatant or control (Ctrl) media for 72 h. The stains were repeated independently two times with similar results. In the graphs, the bar indicates the mean of each group, and the error bars represent the standard deviation. Statistical significance was determined using one-way ANOVA followed by a post-hoc Holm-sidak’s test. Source data
Extended Data Fig. 4
Extended Data Fig. 4. Thrombomodulin and Annexin A5 expression in mouse brain is not endothelial specific.
(a) Quantification of TER-119+ leakage in the cerebellum parenchyma of Ccm3-iECKO vehicle (n = 13) and Cl-amidine (10 mg/kg/day; n = 8) treated mice. (b, c) Correlation analysis of thrombomodulin (THBD) (b) and fibrin (c) expression to lesion burden. (d) Gene expression of thrombomodulin (Thbd) in mouse brain vascular and perivascular cells (e) Quantification of total thrombomodulin (Thbd) expression in the cerebellum (cb) of Ccm3-iECKO vehicle and Cl-amidine (10 mg/kg/day) treated mice. (f) Gene expression of annexin A5 (Anxa5) in mouse brain vascular and perivascular cells. (g) Quantification of total annexin A5 expression in the cerebellum (cb) of Ccm3-iECKO vehicle (n = 13) and Cl-amidine (10 mg/kg/day; n = 8) treated mice. In the graphs (A, E, G), each data point represents one biological replicate, the bar indicates the median of each group, and the error bars represent the interquartile range. Statistical significance was determined using a Mann–Whitney U test (two tailed). Source data
Extended Data Fig. 5
Extended Data Fig. 5. Characterization of organized clots in Ccm3-iECKO mice.
(a) Representative images of the cerebellum of Ccm3-iECKO vehicle mice stained with DAPI (blue), and fibrin (green). Showing organized (a) and acute (b) clots. (b) Representative images of acute (left) and organized (right) clots the cerebellum of Ccm3-iECKO vehicle mice stained with DAPI (blue), TER-119 (green), and podocalyxin (white). Insets (bottom) are zoomed in regions. (c) Representative images of the cerebellum of Ccm3-iECKO mice stained with DAPI (blue), and ICAM-1 (red). Showing organized (a) and acute (b) clots. (c) Representative images of the cerebellum of Ccm3-iECKO vehicle mice stained with DAPI (blue), and CD45+ cells (in green). Showing organized (a) and acute (b) clots. (d) Representative images of the cerebellum of Ccm3-iECKO vehicle mice stained with DAPI (blue), vimentin (green) and α-SMA (magenta). Showing organized (a) and acute (b) clots. (f) Representative images of the cerebellum of Ccm3-iECKO vehicle mice stained with Picro-Sirius red stain (collagen-red/orange, cytoplasm-yellow) Insets with dashed, black line are shown in the magnifications to the right. (g) Representative images of the cerebellum of Ccm3-iECKO vehicle mice stained with DAPI (blue), collagen IV (Col IV; green), α-SMA (red) and podocalyxin (white). Showing increased Col IV deposition in organized clots. (h) Representative image showing endothelization of organized clots the cerebellum of Ccm3-iECKO vehicle mice stained with DAPI (blue), TER-119 (green), and podocalyxin (white). Insets (right) are zoomed in regions, with red asterisk highlighting red blood cells within the endothelized vessel. (i) Representative image showing endothelization of organized clots the cerebellum of Ccm3-iECKO mice at endpoint (P29) stained with DAPI (blue), α-SMA (red), CD31 (white) and ERG (cyan). Inserts (right) are zoomed in regions, highlighting an endothelized vessel. For all images (a-i), the stains were repeated independently in all the samples (n = 21) with similar results. Source data
Extended Data Fig. 6
Extended Data Fig. 6. Organized clots in Ccm3-iECKO mice reduce vessel perfusion.
(a): Representative scanning electron microscopy image of a perfused Ccm3-iECKO mice showing acute (I) and organized clot (II-III) areas. Insets at the bottom are close-up views of the dashed areas marked I-III. Inset figure (a) represents the red dashed area in figure II. Figure (b) from orange dashed area and figure (c) from green dashed area, both in figure III. Asterisks highlight collateral vessels. Arrow heads highlight erythrocytes. The stains were repeated independently in all the samples (n = 10) with similar results (b): Representative image of the cerebellum of Ccm3-iECKO vehicle mice stained via RNAscope with DAPI (blue), Ubc (white) Polr2a (green), Ppib (red) and Cldn5 (magenta; consecutive section). Showing intense reduction of housekeeping genes around organized clots. The stains were repeated independently in all the samples (n = 10) with similar results. Source data
Extended Data Fig. 7
Extended Data Fig. 7. Kinetic analysis of clots in Ccm3-iECKO mice and characterization of organized clots in sporadic human CCM biopsies.
(a–d) Representative images of Ccm3-iECKO mice aged P11 (No NETs; a), P13 (NETs present; b), P15 ((c), P21 (d), stained with DAPI (blue), fibrin (green) and α-SMA (red). (e) Quantification of organized clot area in the cerebellum (cb) of Ccm3-iECKO P11, P13, P15-28 mice. Each data point represents one biological replicate (n = 9-13 mice per group), the bar indicates the median of each group, and the error bars represent the interquartile range. Statistical significance was determined using a Kruskal-Wallis test followed by a post-hoc Mann-whitney test (f) Representative image of organized clots in sporadic human CCM stained with DAPI (blue), CD31 (magenta), and CD45 (green) showing CD45+ cell infiltration of organized clots. (g) Representative image of organized clots in sporadic human CCM stained with DAPI (blue), CD31 (green), and carbonic anhydrase (CA9, white) showing increased CA9 deposition in organized clots. (h) Representative image showing endothelization of organized clots in sporadic human CCM stained with vWF (green), and the angiogenesis marker, CD93 (magenta). Inserts with white line are shown in the magnifications to the right. For images f-h, the stains were repeated independently in all the samples (n = 4) with similar results. Source data
Extended Data Fig. 8
Extended Data Fig. 8. Organized clots in human CCMs.
(a–d) Representative images of familial CCM (fCCM) patients showing acute or organized clots. Samples were stained for CD34 (top panel), and Fraser-Lendrum stain (normal red blood cells (yellow), fibrin coated red blood cells (purple), collagen (turquoise). Using Fraser-Lendrum stain, organized clots having increased collagen deposition are shown and contrasted with acute clots without collagen deposition. Insets with dashed, black line are shown in the magnifications below. Black arrows highlight the organized clots. (e-j) Representative images of sporadic CCM (sCCM) patients showing acute or organized clots in stained with DAPI (blue), vWF (green), α-SMA (red). Insets with dashed, white line are shown in the magnifications to the right. White arrows highlight the organized clots. For all images the stains were repeated independently in all the samples with similar results.
Extended Data Fig. 9
Extended Data Fig. 9. Effect of NET inhibition on mouse weight, and cytokines.
(a) Macroscopic images of mouse brains used in study. Brains within the box with dashed lines are wild type mice. (b) Quantification of mouse weight and sex distribution across Cl-amidine treated vs vehicle groups. Open and filled circles represent females and open and filled triangles represent males. (c) Quantification of adverse effects (death or balance issues) in Ccm3-iECKO mice used in the study. (d–k) Quantification of IL-1β (d), IL-6 (e), IP-10 (f), TNF (g), KC/GRO (h), MCP-1 (i), MIP-1α (j), MIP-2 (k) levels in the plasma of Ccm3-WT vehicle and Cl-amidine (10 mg/kg/day) treated mice.

Similar articles

Cited by

References

    1. Snellings, D. A. et al. Cerebral cavernous malformation: from mechanism to therapy. Circ. Res.129, 195–215 (2021). - PMC - PubMed
    1. Choquet, H., Pawlikowska, L., Lawton, M. T. & Kim, H. Genetics of cerebral cavernous malformations: current status and future prospects. J. Neurosurg. Sci.59, 211–220 (2015). - PMC - PubMed
    1. Liquori, C. L. et al. Deletions in CCM2 are a common cause of cerebral cavernous malformations. Am. J. Hum. Genet.80, 69–75 (2007). - PMC - PubMed
    1. Peyre, M. et al. Somatic PIK3CA mutations in sporadic cerebral cavernous malformations. N. Engl. J. Med.385, 996–1004 (2021). - PMC - PubMed
    1. Ren, A. A. et al. PIK3CA and CCM mutations fuel cavernomas through a cancer-like mechanism. Nature594, 271–276 (2021). - PMC - PubMed

MeSH terms

Substances

LinkOut - more resources