. 2025 Jan;637(8046):698-707.
doi: 10.1038/s41586-024-08272-5. Epub 2024 Dec 4.

Macrophages excite muscle spindles with glutamate to bolster locomotion

Affiliations

Macrophages excite muscle spindles with glutamate to bolster locomotion

Yuyang Yan et al. Nature. 2025 Jan.

Erratum in

Abstract

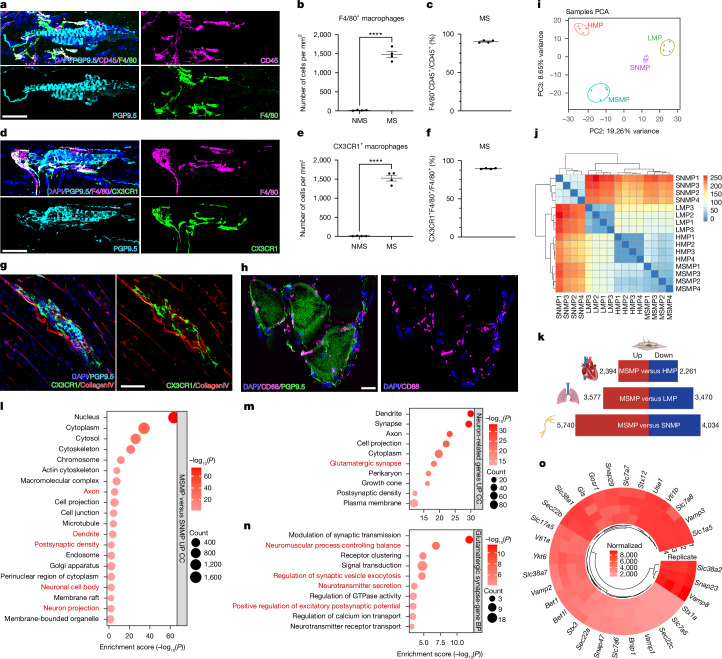
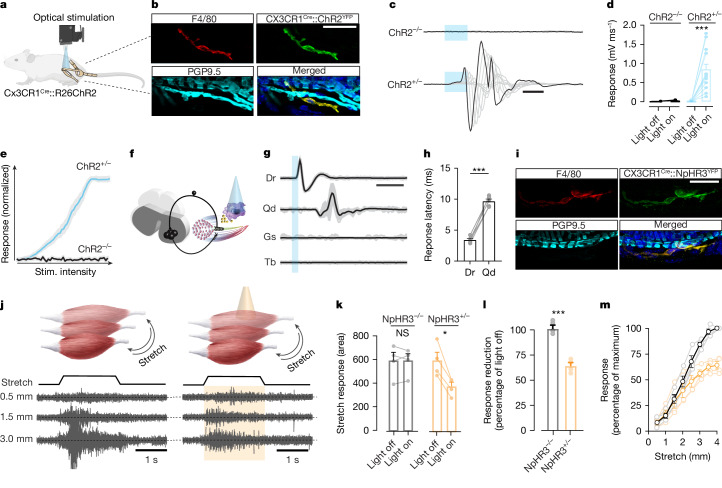
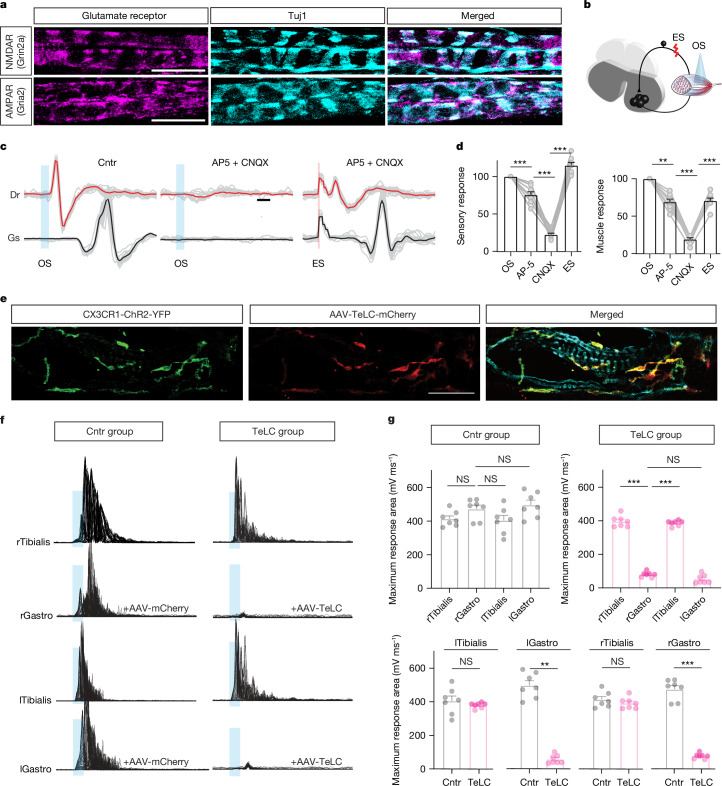
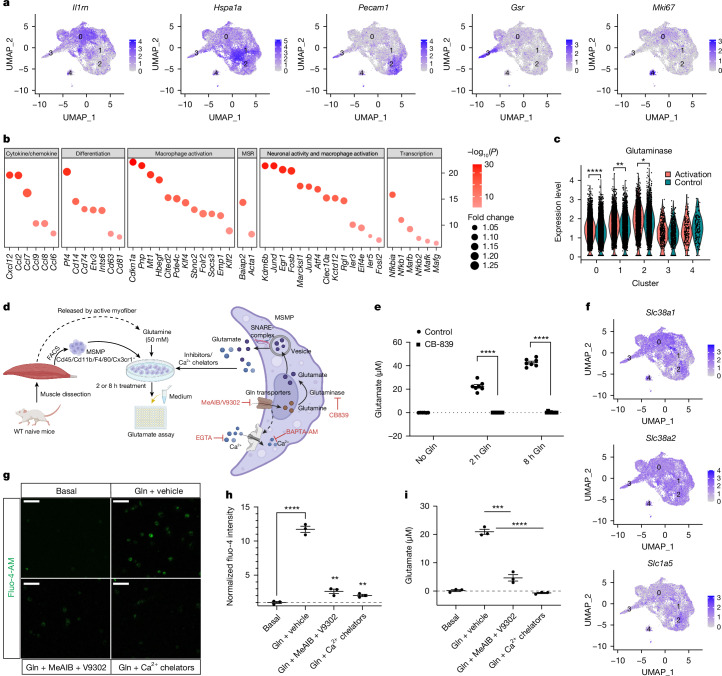
The stretch reflex is a fundamental component of the motor system that orchestrates the coordinated muscle contractions underlying movement. At the heart of this process lie the muscle spindles (MS), specialized receptors finely attuned to fluctuations in tension within intrafusal muscle fibres. The tension variation in the MS triggers a series of neuronal events including an initial depolarization of sensory type Ia afferents that subsequently causes the activation of motoneurons within the spinal cord1,2. This neuronal cascade culminates in the execution of muscle contraction, underscoring a presumed closed-loop mechanism between the musculoskeletal and nervous systems. By contrast, here we report the discovery of a new population of macrophages with exclusive molecular and functional signatures within the MS that express the machinery for synthesizing and releasing glutamate. Using mouse intersectional genetics with optogenetics and electrophysiology, we show that activation of MS macrophages (MSMP) drives proprioceptive sensory neuron firing on a millisecond timescale. MSMP activate spinal circuits, motor neurons and muscles by means of a glutamate-dependent mechanism that excites the MS. Furthermore, MSMP respond to neural and muscle activation by increasing the expression of glutaminase, enabling them to convert the uptaken glutamine released by myocytes during muscle contraction into glutamate. Selective silencing or depletion of MSMP in hindlimb muscles disrupted the modulation of the stretch reflex for force generation and sensory feedback correction, impairing locomotor strategies in mice. Our results have identified a new cellular component, the MSMP, that directly regulates neural activity and muscle contraction. The glutamate-mediated signalling of MSMP and their dynamic response to sensory cues introduce a new dimension to our understanding of sensation and motor action, potentially offering innovative therapeutic approaches in conditions that affect sensorimotor function.


Conflict of interest statement

Competing interests: The authors declare no competing interests.

Figures

Fig. 1
Fig. 1. CX3CR1+ macrophages in proximity to MS express a distinct molecular signature enriched in neuronal genes for glutamatergic transmission.
a, Immunostaining for CD45/F4/80+ macrophages in mouse hindlimb skeletal muscle. MS are labelled with PGP9.5. b, F4/80+ macrophages in MS and NMS areas (n = 4 biological independent mice; two-tailed unpaired Student’s t-test; mean ± s.e.m.; ****P < 0.0001). c, Percentage of CD45+/F4/80+ macrophages in CD45+ cells in MS (n = 4 biological independent mice; mean ± s.e.m.). d, Immunostaining for F4/80+/CX3CR1+ macrophages in proximity to PGP9.5+ MS. e, CX3CR1+ macrophages in MS and NMS areas (n = 4 biological independent mice; two-tailed unpaired Student’s t-test; mean ± s.e.m.; ****P < 0.0001). f, Percentage of F4/80+/CX3CR1+ in F4/80+ MSMP (n = 4 biological independent mice; mean ± s.e.m.). g, Immunostaining of CX3CR1+ cells inside the capsule of MS (labelled by Collagen IV). h, Immunostaining showing enrichment for CD68+ macrophages in PGP9.5+ MS from quadriceps muscle of a normal subject. i, PCA of FACS-sorted MSMP versus FACS-sorted heart (HMP), lung (LMP) macrophages and SNMP. j, Correlation-based sample-to-sample distance heatmap of MSMP, HMP, LMP and SNMP. k, Differential expression analysis (FDR < 0.05, fold change greater than 1.5) of MSMP versus HMP, LMP and SNMP. l, GO of upregulated genes in MSMP versus SNMP (FDR < 0.05, fold change greater than 1.5). GO categories highlighted in red text are neuron-related pathways. m, GO analysis of 336 neuron-related upregulated genes in MSMP versus SNMP (FDR < 0.05, fold change greater than 1.5). n, GO of 77 ‘Glutamatergic synapse’ category upregulated genes in MSMP versus SNMP (FDR < 0.05, fold change greater than 1.5). o, Expression of glutamine transporters, glutamate synthesis and glutamate release-related genes by MSMP. Scale bars, 50 μm (a,d,g), 100 μm (h). Illustrations in k created using BioRender (https://biorender.com). Source Data
Fig. 2
Fig. 2. MSMP activation or inhibition elicit rapid neural activity with muscle contraction or impair muscle activity in response to stretch, respectively.
a, Schematic of the experimental design. Optogenetic stimulation a specific hindlimb muscle in CX3CR1Cre::ChR2YFP mice to activate CX3CR1+ macrophages and simultaneously record sensory and muscle responses animals while illuminating. b, Immunostaining for the Cre-driven expression of opsin (ChR2YFP) in F4/80+ cells located in the PGP9.5+ MS. ce, Traces and graphs showing the response of the gastrocnemius muscle in a CX3CR1Cre::ChR2YFP mouse (ChR2+/−) and its negative littermate (ChR2−/−) on optical stimulation (stim.) (c), with quantification of the response amplitude (d) and the stimulus–response curve (e) in both groups (n = 7 biological independent mice; Wilcoxon test, mean ± s.e.m.). fh, Schematic of the experiment in CX3CR1cre::ChR2YFP mice (f) with representative traces of response from the quadriceps (Qd), Tibialis (Tb) and Gastrocnemius (Gs) muscles with the sensory root response (Dr) during short optical stimulation (2 ms duration, g) with quantification of latencies for sensory (Dr) and muscle (Qd) responses (h, n = 5 biological independent mice, paired Student’s t-test, mean ± s.e.m.). i, Immunostaining showing colocalization of NpHR3YFP and F4/80 in CX3CR1Cre::NpHR3YFP mice in PGP9.5+ MS. j, Schematic of the experiment with representative muscle responses to greater stretches of the gastrocnemius muscle in mice with and without light stimulation. k, Absolute amplitude responses in CX3CR1Cre mice expressing halorhodopsin (NpHR3+/−) and their negative littermates (NpHR3−/−). n = 4 biological independent mice per condition, unpaired Student’s t-test, mean ± s.e.m. l, Amplitude response as percentage to the control condition (no light) (n = 4 biological independent mice per condition, paired Student’s t-test, mean ± s.e.m.). m, The stimulus–response in relation to stretch in NpHR3+/− mice without (black) and with (orange) inactivation of MSMP (n = 4 biological independent mice). Significance levels: NS, not significant; *P < 0.05, ***P < 0.001. Scale bars, 30 μm (b,i), 5 ms (c), 10 ms (g), 1 s (j). Illustration in a created using BioRender (https://biorender.com). Source Data
Fig. 3
Fig. 3. MSMP modulate neural activity and muscle contraction by means of fast glutamatergic transmission.
a, Representative immunostaining of glutamate receptors (Grin2a, NMDA and Gria2, AMPA receptors) in MS afferents (labelled with Tuj1). b,c, Schematic (b) and representative traces (c) for sensory and muscle responses in CX3CR1cre::ChR2YFP mice induced by optical stimulation (OS) (left panel, c), optical stimulation with AP-5 and CNQX (middle panel, c) and electric stimulation (ES) of the dorsal root (50 ms, 1 Hz, right panel, c). d, Bar graphs showing normalized sensory (left graph) and muscle response (right panel) (n = 7 biological independent mice; one-way ANOVA, Tukey’s multiple comparisons test; mean ± s.e.m.) in c. e, Representative immunostaining for the expression of TeLC-mCherry (red) in CX3CR1cre::ChR2YFP macrophages in mouse gastrocnemius MS (labelled with PGP9.5, cyan) with AAV9/2-FLEX-mCherry-TeLC (referred to as TeLC) intramuscular injection. fg, Representative traces (f) and quantification of response amplitude (g) after short optical stimulation (5 ms) in anaesthetized CX3CR1cre::ChR2YFP mice that received a viral injection of either a control fluorescent marker mCherry (control group (cntr), n = 7 biological independent mice; one-way ANOVA, Tukey’s multiple comparisons test; mean ± s.e.m.) or TeLC-mCherry (TeLC, n = 7 biological independent mice; one-way ANOVA, Tukey’s multiple comparisons test; mean ± s.e.m.) in the gastrocnemius muscles. Tibialis muscles were not injected with either control virus (AAV-mCherry) or TeLC virus (they were used as negative controls in both control and TeLC mice). Significance levels: NS, not significant, **P < 0.01, ***P < 0.001. Scale bars, 20 μm (a), 2 ms (c), 50 μm (e). Source Data
Fig. 4
Fig. 4. MSMP respond to proprioceptive neuronal activation and convert glutamine into glutamate by means of glutaminase.
a, UMAP results show the expression of marker genes for five clusters of 18,538 FACS-sorted MSMP. b, DE analysis from identified macrophage clusters shows increased expression of genes involved in cytokine or chemokine signalling, macrophage or neuron activation, transcription, differentiation and macrophage shape remodel (MSR) (FDR < 0.05, fold change greater than 1). c, DE analysis shows significantly increased expression of glutaminase in response to Pv neuron activation in MSMP cluster 0, 1 and 2 (FDR < 0.05, fold change greater than 1). d, Experimental design of in vitro MSMP culture medium glutamate assay with FACS-sorted MSMP treated with vehicle or glutamine or glutaminase inhibitor (CB-839) or glutamine transporter inhibitors (MeAIB and V9302) or Ca2+ chelators (BAPTA-AM and EGTA). e, Glutamate was detected in MSMP culture medium 2 or 8 h after 50 mM glutamine treatment. The release of glutamate was diminished by glutaminase inhibitor (CB-839) (n = 6 biological replicates; one-way ANOVA, Tukey’s multiple comparisons test; mean ± s.e.m.). f, Expression of glutamine transporters SNAT1 (Slc38a1), SNAT2 (Slc38a2) and ASCT2 (Slc1a5) by MSMP. g,h, Immunostaining (g) and bar graphs (h) showing elevated MSMP intracellular Ca2+ level (Fluo-4-AM signal) induced by 50 mM glutamine treatment that was significantly reduced by glutamine transporter inhibitors (MeAIB + V9302) and Ca2+ chelators (BAPTA-AM and EGTA) (n = 3 biological replicates; one-way ANOVA, Tukey’s multiple comparisons test; mean ± s.e.m.). i, Glutamate was detected in MSMP culture medium after 2 h of 50 mM glutamine treatment. The medium glutamate level was significantly reduced by glutamine transporter inhibitors (MeAIB + V9302) and Ca2+ chelators (BAPTA-AM and EGTA) (n = 3 biological replicates; one-way ANOVA, Tukey’s multiple comparisons test; mean ± s.e.m.). Significance levels: NS, not significant, *P < 0.05, **P < 0.01, ***P < 0.001; ****P < 0.0001. Scale bar, 50 μm. Illustrations in d created using BioRender (https://biorender.com). Source Data
Fig. 5
Fig. 5. Selective disruption of MSMP activity alters locomotor strategies in freely swimming mice.
a, Experimental design of swimming tests after selective disrupt MSMP neurotransmitter release (AAV-TeLC) and MSMP depletion (AAV-Cas3). b, Schematic representation of key hindlimb points. c, Stick diagram decomposition of the hindlimb stroke cycle in CX3CR1cre::ChR2YFP mice before and after viral delivery of TeLC (magenta) or a control fluorescent marker (grey) into both gastrocnemius muscles. d,e, PCA of gait features clustered the control (grey) and TeLC (magenta) groups based on the first three principal components with individual animals represented by small circles and group centroids by large sphere (d) and the first ten components explained variability (e). fh, Graphs showing changes in gait features (f, two-tailed unpaired Student’s t-test, mean ± s.e.m.), angular excursion (g, Welch’s t-test, mean ± s.e.m.) and angular excursion variability (h, Mann–Whitney test, mean ± s.e.m.) of the control group (grey, n = 9 biological independent mice) and TeLC group (magenta, n = 7 biological independent mice). i,j, Representative confocal images of gastrocnemius MS from a CX3CR1cre::ChR2YFP mouse injected with either AAV-DIO-mCherry (control) or AAV-DIO-Caspase3 to deplete MSMP (Cas3 group) (i), with the relative count of MSMP 5 weeks after the viral injection (j) (n = 3 biological independent mice; two-tailed unpaired Student’s t-test; mean ± s.e.m.). k,l, Graphs showing changes in angular excursion (k, Welch’s t-test; mean ± s.e.m) and angular excursion variability (l, Mann–Whitney test; mean ± s.e.m.) of the control group (grey, n = 9 biological independent mice) and caspase group (green, n = 7 biological independent mice). Significance levels: NS, not significant, *P < 0.05, **P < 0.01, ***P < 0.001; ****P < 0.0001. Illustrations in a created using BioRender (https://biorender.com). Source Data
Extended Data Fig. 1
Extended Data Fig. 1. Molecular signatures of mouse muscle spindles (MS).
a, Experimental flow chart of laser-capture microdissection (LCM) to dissect MS and non-MS (NMS) tissues from mouse hindlimb skeletal muscles. b, Micrograph of laser-captured MS and NMS areas with cresyl violet staining. Scale bar = 50 μm. c, Principal component analysis (PCA) of MS and NMS RNA-seq datasets. d, Normalized genes expressed by MS and NMS areas (FDR < 0.1, normalized count >10). e, Summary of differential expression analysis of up- and downregulated genes in MS versus NMS (FDR < 0.1, fold change > 1.5). f, Exclusive expression of MS marker genes in MS areas compared with NMS areas. g, Functional analysis for genes only expressed by MS compared with NMS areas (with FDR < 0.1, normalized count > 10). Shown are significantly upregulated GO pathways categorized by the Database for Annotation, Visualization, and Integrated Discovery (DAVID) Bioinformatics Resource with p < 0.05. h, Quantification of different types of immune cells in MS areas (n = 4 biological independent mice). Illustrations in a created using BioRender (https://biorender.com). Source Data
Extended Data Fig. 2
Extended Data Fig. 2. Localization of macrophages in muscle spindles and neuromuscular junctions.
a, Immunostaining for Iba1+ macrophages in mouse hindlimb skeletal muscle. Muscle spindles (MS) are localized by the annulospiral axons labelled with Tuj1 and DAPI counterstaining. b, Quantification of the number of Iba1+ macrophages in MS and non-MS (NMS) areas (n = 4 biological independent mice; two-tailed unpaired Student’s t-test; mean ± s.e.m; ****p < 0.0001). Scale bar = 50 μm. c, Immunostaining showing F4/80+ macrophages are found in the MS in proximity to sensory afferents (labelled by PGP9.5 and DAPI counterstaining) compared with γ-motor neurons (labelled by bungarotoxin; BTX). Scale bar = 100 μm. d, Quantification of the number of F4/80+ macrophage close to MS sensory afferents and γ-motor neurons (n = 4 biological independent mice; two-tailed unpaired Student’s t-test; mean ± s.e.m; ****p < 0.0001). e, Immunostaining indicating the lack of F4/80+ macrophages around neuromuscular junctions (NMJ), labelled by bungarotoxin (BTX). f, Quantification of macrophage distribution in MS and NMJ (n = 4 biological independent mice; two-tailed unpaired Student’s t-test; mean ± s.e.m; ****p < 0.0001). Scale bar = 50 μm. Source Data
Extended Data Fig. 3
Extended Data Fig. 3. Macrophages isolated from various tissues via fluorescence-activated cell sorting.
a, Experimental flow chart of RNAseq of macrophages from dissected muscle, heart and lung, and isolated by fluorescence-activated cell sorting (FACS). b, FACS gating to isolate live CD45/CD11b/F4/80/CX3CR1+ macrophages. c, Cell sorting gate. d, Fluorescence Minus One (FMO)-CX3CR1 for CX3CR1 gating. e,f, Histogram and FACS showing the purity of sorted live CD45/CD11b/F4/80/CX3CR1+ macrophages. Illustrations in a created using BioRender (https://biorender.com).
Extended Data Fig. 4
Extended Data Fig. 4. Differential expression analysis of genes higher and lower expressed in muscle spindle macrophages (MSMP) compared with heart, lung and sciatic nerve macrophages.
a,b, Functional analysis of biological process (BP) of upregulated (a) and downregulated (b) genes in MSMP versus heart macrophage (HMP) (FDR < 0.05, fold change > 1.5). c,d, Functional analysis of BP of upregulated (c) and downregulated (d) MSMP versus lung macrophage (LMP) (FDR < 0.05, fold change > 1.5). e, Functional analysis of BP of downregulated genes in MSMP versus sciatic nerve macrophages (SNMP) (FDR < 0.05, fold change > 1.5). f, Functional analysis of cellular component (CC) of downregulated genes in MSMP versus SNMP (FDR < 0.05, fold change > 1.5). Shown are significantly upregulated and downregulated GO pathways categorised by the Database for Annotation, Visualization, and Integrated Discovery (DAVID) Bioinformatics Resource with p < 0.05. The statistically significant GO categories highlighted in red and blue are upregulated and downregulated pathways, respectively. Illustrations in a,c,e created using BioRender (https://biorender.com).
Extended Data Fig. 5
Extended Data Fig. 5. Electrophysiological characterisation of MSMP expressing ChR2 and NpHR3.
a,f, Shown are membrane potentials of cultured negative and positive cells for excitatory (a, CX3CR1cre::ChR2YFP, ChR2 and ChR2+) or inhibitory (f, CX3CR1cre::NpHR3YFP, NpHR3 and NpHR3+) opsins with the relative responses upon light stimulation (473 nm for ChR2 and 593 nm for NpHR3) at various light powers (0%, 5%, 10%, 15%, 50%, 100%) and various pulse durations (5, 50, 100, 500 ms). b,g, Quantification of depolarization in ChR2 and ChR2+ macrophages (n = 14 independent cells per group, three independent experiments) and hyperpolarization in NpHR3 and NpHR3+ macrophages (n = 16 independent cells per group, three independent experiments) with and without light stimulation (mean ± s.e.m.). c,h, Response amplitude in ChR2+ cells (c) and NpHR3+ (h) at different pulse durations with 100% light power. d,e, Response amplitude (depolarization) in ChR2+ cells at various laser powers for 5 ms (d) and 100 ms (e) pulse durations. i,j, Response amplitude (hyperpolarization) in NpHR3+ cells at various laser powers for 50 ms (i) and 500 ms (j) pulse durations. Data are given as mean ± s.e.m.; paired Student’s t-test (b,g), RM One-way ANOVA with Tukey’s (ce,h), with Sidak (j) multiple comparisons test were used. Significance levels: n.s. = not significant, *p < 0.05, **p < 0.01, ***p < 0.001. Source Data
Extended Data Fig. 6
Extended Data Fig. 6. Optical stimulation of hindlimb muscle CX3CR1+ macrophages in CX3CR1Cre::ChR2YFP animals modulates the reflex arc and muscle response.
a,b, Shown are traces (a) of sensory (Dr) and muscle responses (Qd) to optical stimulation (train of 15 pulses, 5 ms duration, 15% power) at low (20 HZ) and high frequency (100 Hz) in anaesthetized CX3CR1Cre::ChR2YFP mice, and quantification of response probability (b, responses/number of pulses in the train, n = 5 biological independent mice). c,d, A short optical pulse (5 ms) in the gastrocnemius of anaesthetized CX3CR1Cre::ChR2YFP mice evokes a muscle response (c) that is abolished when the homologues dorsal root is cut (d). e,f, Representative traces (e) and correlation matrix (f) showing the spatial specificity of MSMP modulation in CX3CR1Cre::ChR2YFP. Optical stimulation of specific muscles (stim. site) mice elicited the activation of the response only in that muscle (e), indicating the high spatial specificity of the MSMP modulation onto the neural activity and muscle contraction. Source Data
Extended Data Fig. 7
Extended Data Fig. 7. MSMP clusters express tissue resident markers and share similar sub-anatomical localization within MS.
a, Uniform manifold approximation and projection (UMAP) results show 5 clusters of MSMP from 18,538 F4/80/CX3CR1+ MSMP. b, Expression of MSMP markers and tissue-resident markers in MSMP. c,d, Violin plot (c) and representative immunostaining (d) for the expression of marker genes (Il1rn, Hspa1a and Pecam1) of cluster 0-2 MSMP (labelled by F4/80) in MS (labelled by PGP9.5). Scale bar = 50 μm. e, Spatial localization (distance between MSMP and MS sensory fibre) of cluster 0-2 MSMP by using the sensory annular fibres as reference. Cluster 0, cluster 1 and cluster 2 MSMP are identified by the expression of Il1rn (n = 65 MSMP), Hspa1a (n = 69 MSMP) and Pecam1 (n = 69 MSMP), respectively (n = 3 biological independent mice; one-way ANOVA, Tukey’s multiple comparisons test; ns = not significant). f, Expression of Gls (Glutaminase) and Slc17a5 (Sialin) by MSMP. Source Data
Extended Data Fig. 8
Extended Data Fig. 8. All muscle spindle macrophage (MSMP) clusters respond to optogenetic proprioceptive neuronal activation and swimming.
a, Differential expression (DE) analysis showing increased expression of genes involved in cytokine/chemokine signalling, macrophage/neuron activation, transcription, differentiation, and macrophage shape remodel (MSR) (FDR < 0.05, fold change > 1) of MSMP cluster 0 (a), cluster 1 (b) and cluster 2 (c) after optogenetic stimulation of Pv neurons. b, RT-qPCR results showing increased expression of glutaminase (Gls) and early response genes (Egr1, JunB, Atf4 and Ier5) in sorted MSMP after swimming (n = 3 biological replicates; two-tailed unpaired Student’s t-test; mean ± s.e.m.; *p < 0.05, **p < 0.01). Source Data
Extended Data Fig. 9
Extended Data Fig. 9. Macrophage depletion weakens the molecular signature of dorsal root ganglia proprioceptive neurons and impairs mouse locomotor behaviour.
a,c, Immunostaining for F4/80+ macrophages in MS (a) and sciatic nerve (c) (labelled by PGP9.5 and DAPI counterstaining) before and after MSMP depletion. b, Quantification of the number of CD45/F4/80+ macrophages in MS on day 0 (control), day 4 and day 11 (n = 4 biological independent mice per group; one-way ANOVA, Tukey’s multiple comparisons test; mean ± s.e.m; ns, not significant; ****p < 0.0001). d, Quantification of the number of F4/80+ macrophages in MS and sciatic nerves before and after macrophage depletion treatment (n = 4 biological independent mice per group; two-tailed unpaired Student’s t-test; mean ± s.e.m; **p < 0.01 ****p < 0.0001). e, FACS gating to isolate DAPI+/NeuN+ neuronal nuclei from mouse L4-6 DRGs. f, Uniform manifold approximation and projection (UMAP) results show 11 clusters of 19,156 DRG neuronal nuclei. LTMR, low threshold mechanoreceptors; NP, non-peptidergic C-fibre nociceptors; PEP, C-fibre peptidergic nociceptors; Cold, cold thermoreceptor. g, Functional analysis of biological process (BP) analysis of downregulated genes in 1,352 proprioceptive neurons after macrophage depletion (FDR < 0.05, log2(fold change) > 0.25). GO pathways categorized by the DAVID Bioinformatics Resource with p  <  0.05). Scale bar = 50 μm. h, Treadmill result showing gait variables (spatiotemporal and coordination features) with statistically significant differences (p < 0.05) between conditions. Cohen’s effect size was interpreted as weak (<0.2), moderate (0.2–1), or strong (>1). Red dash line represents p = 0.05. i, Comparison between Cohen’s effect size of each gait variable listed in figure c at the speed of 40 cm/s and 20 cm/s (17 variables, paired Student’s t-test, *p < 0.05). j, Grid walk results showing the increased percentage of misstep after macrophage depletion (n = 15 biological independent mice per group; two-tailed unpaired Student’s t-test; mean ± s.e.m; ****p < 0.0001). Source Data
Extended Data Fig. 10
Extended Data Fig. 10. Analysis of gait dynamics after manipulations of MSMP in a free swimming or skilled locomotion paradigm.
ac, PCA analysis clustering (a), variance explained by the first ten principal components (b) and changes in step duration, frequency, height, speed, and length (mean ± s.e.m, c) control (cntr, grey, n = 9 biological independent mice) and MSMP depleted (Cas3, green, n = 7 biological independent mice) CX3CR1cre::ChR2YFP mice during swimming, referred to figure 5 (Mann-Whitney tests). df, Percentage of missed steps (d), step number (e) and time (f) to complete the task for CX3CR1Cre::ChR2YFP mice walking on a ladder before and after the delivery of a cre-dependent virus to express a fluorophore (cntr, grey, n = 9 biological independent mice, mean ± s.e.m), and either TeLC (magenta, n = 7 biological independent mice, mean ± s.e.m) or Caspase 3 (Cas3, green, n = 7 biological independent mice, mean ± s.e.m). Statistical analysis was conducted using paired Student’s t-test (d,f) and Wilcoxon test (e) to determine significance. Significance levels: n.s. = not significant, *p < 0.05, **p < 0.01, ***p < 0.001. Source Data

References

    1. Matthews, P. B. Where anatomy led, physiology followed: a survey of our developing understanding of the muscle spindle, what it does and how it works. J. Anat.227, 104–114 (2015). - PMC - PubMed
    1. Sherrington, C. S. in Scientific and Medical Knowledge Production, 17961918 (ed. Boddice, R.) 217–253 (Routledge, 2023).
    1. Liddell, E. G. T. & Sherrington, C. S. Reflexes in response to stretch (myotatic reflexes). Proc. R. Soc. Lond. Series B. Biol. Sci.96, 212–242 (1924).
    1. Creed, R. S., Denny-Brown, D., Eccles, J. C., Liddell, E. G. T. & Sherrington, C. S. Reflex Activity of the Spinal Cord (Clarendon Press, 1932).
    1. Matthews, P. Evidence that the secondary as well as the primary endings of the muscle spindles may be responsible for the tonic stretch reflex of the decerebrate cat. J. Physiolo.204, 365–393 (1969). - PMC - PubMed

LinkOut - more resources