. 2025 Jan;637(8044):156-166.
doi: 10.1038/s41586-024-08284-1. Epub 2024 Dec 4.

RANK drives structured intestinal epithelial expansion during pregnancy

Affiliations

RANK drives structured intestinal epithelial expansion during pregnancy

Masahiro Onji et al. Nature. 2025 Jan.

Abstract

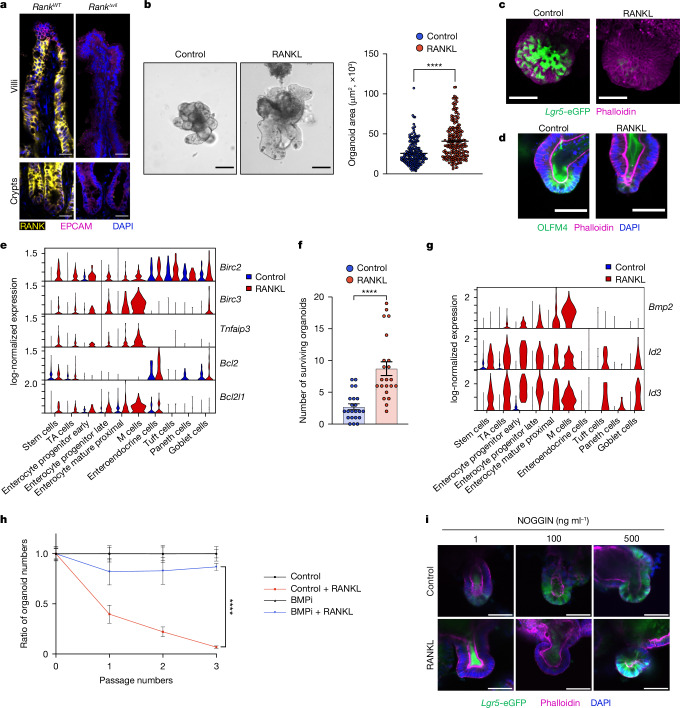
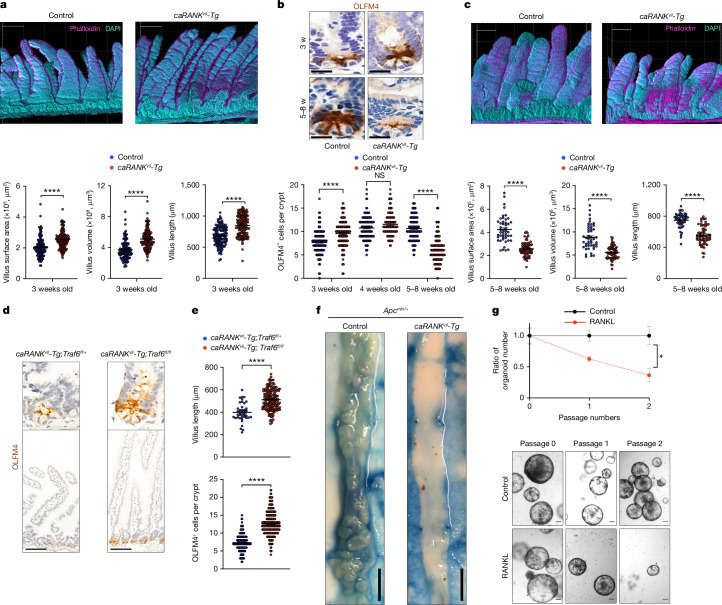
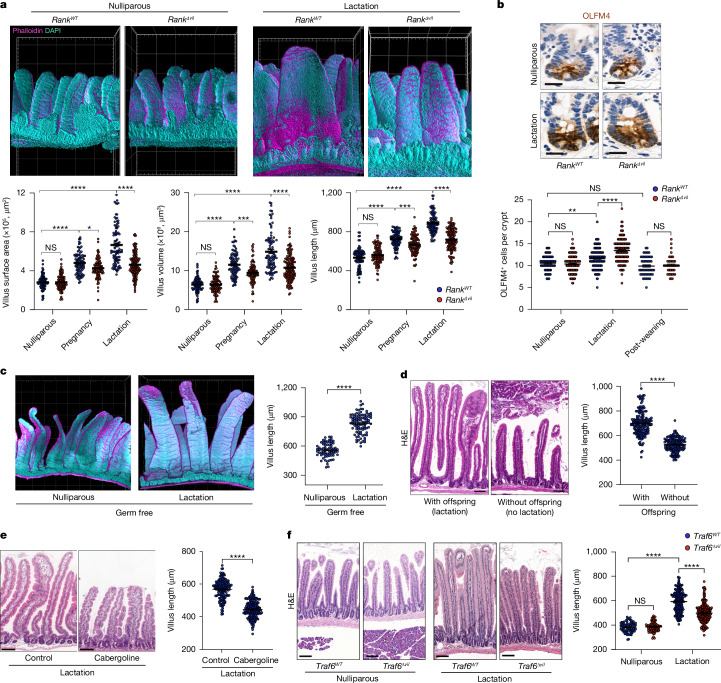
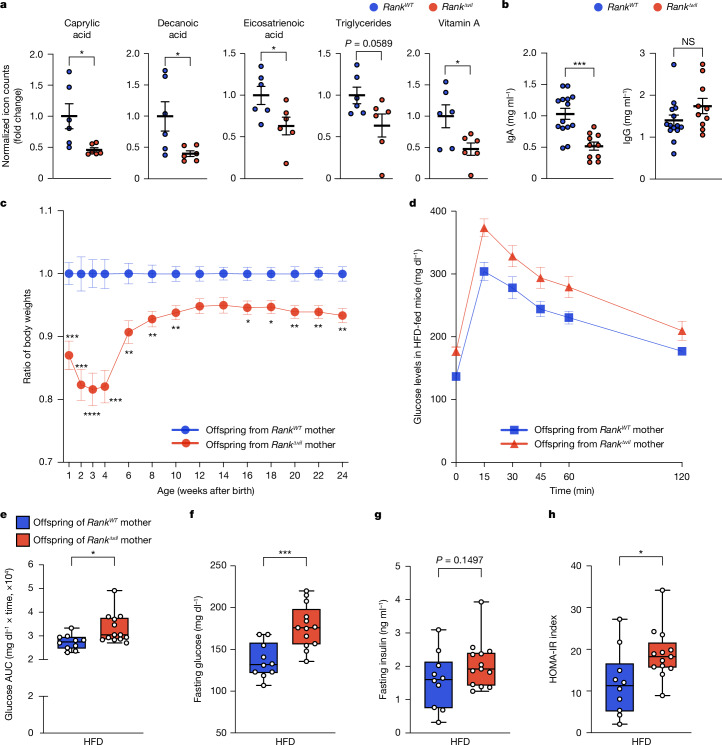
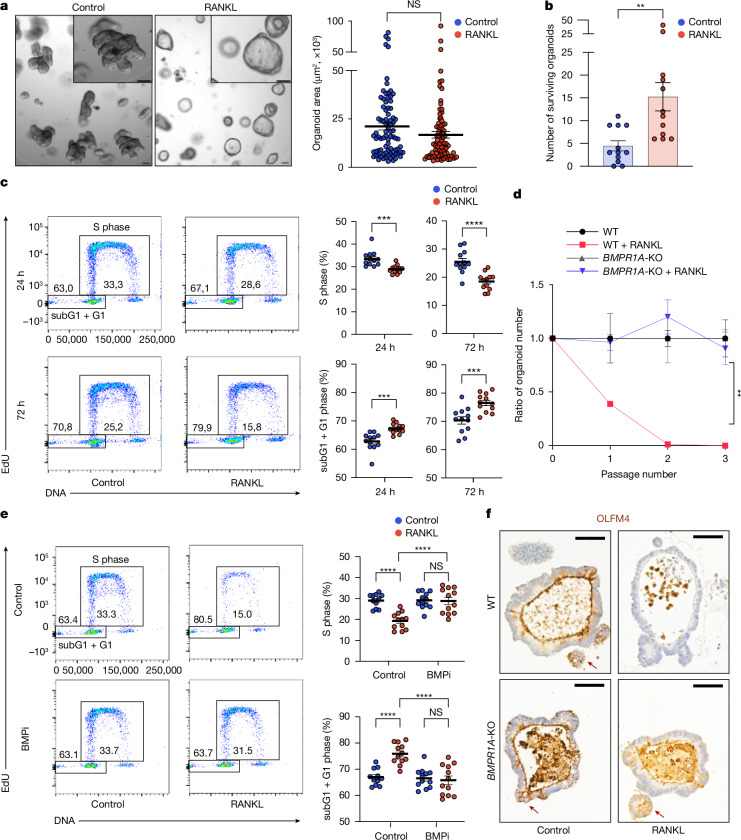
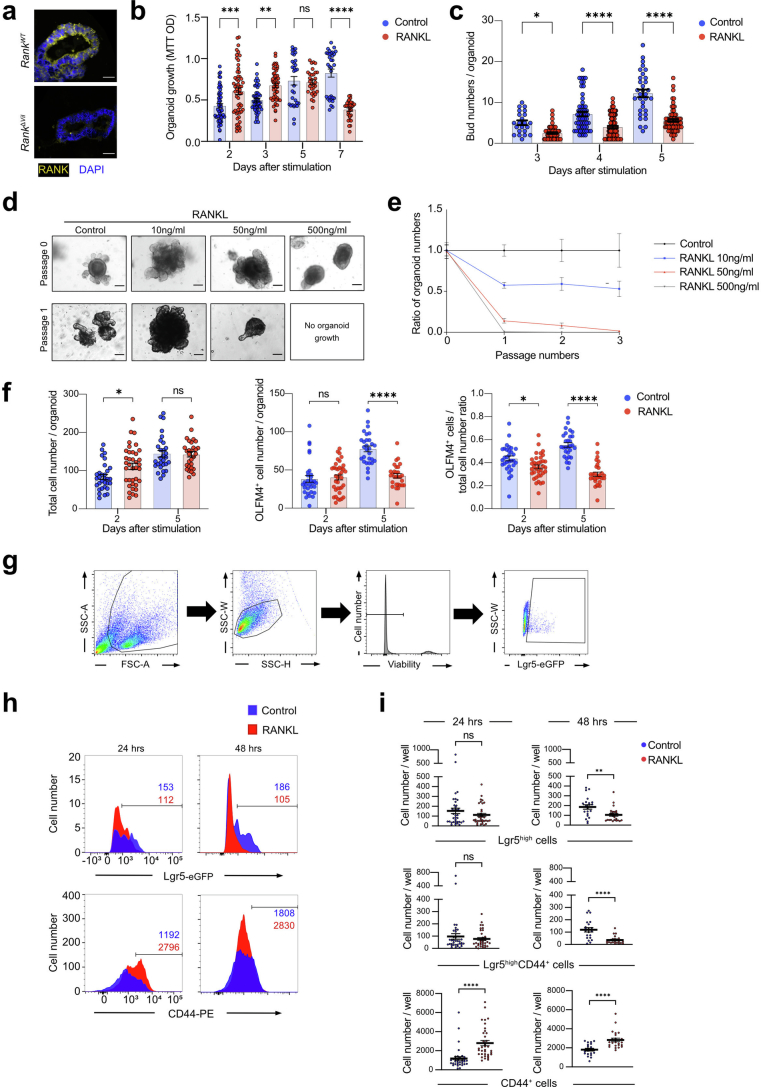
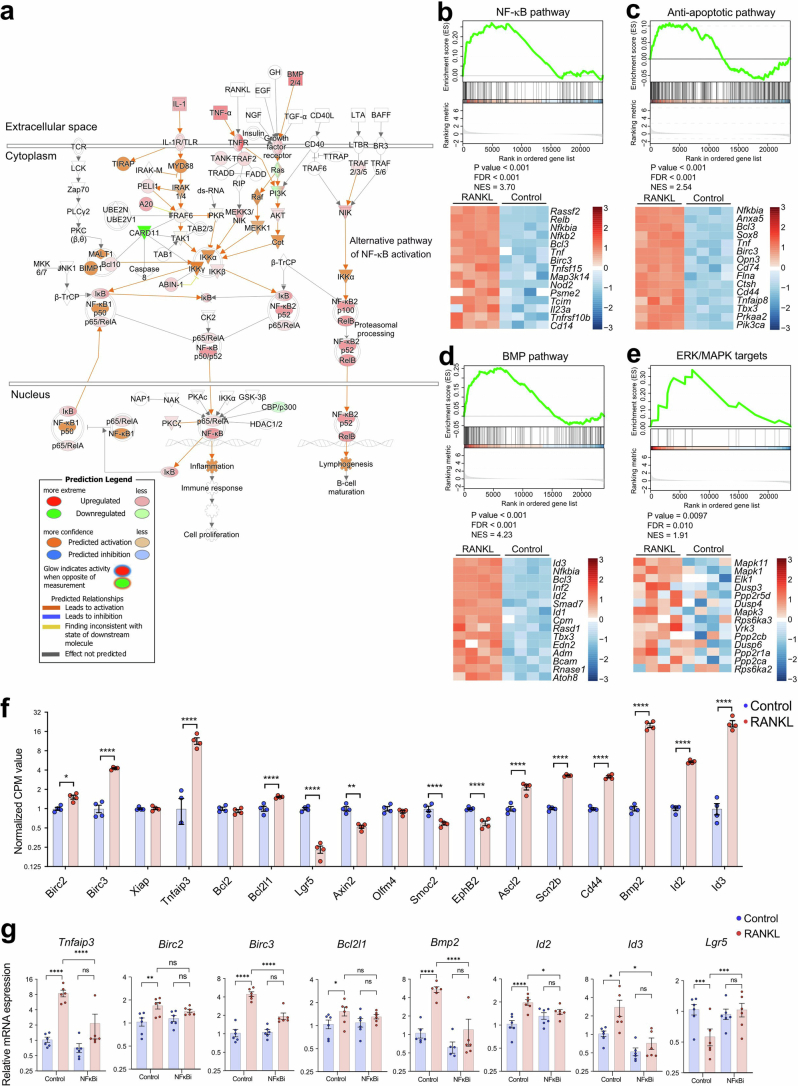
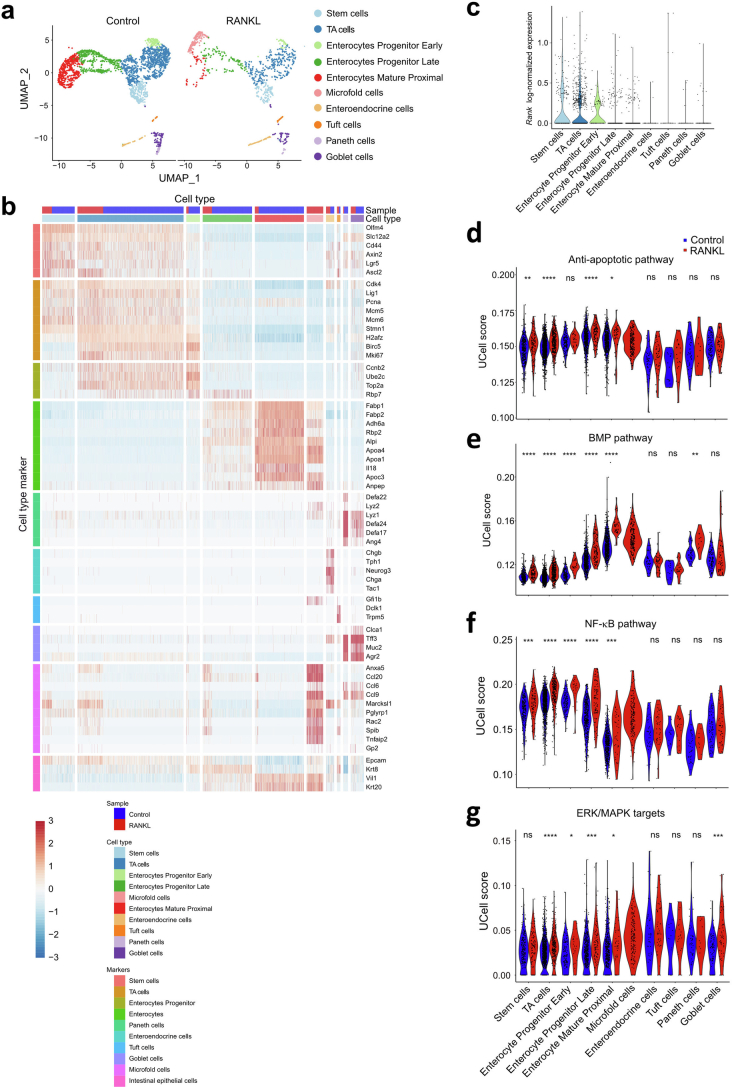
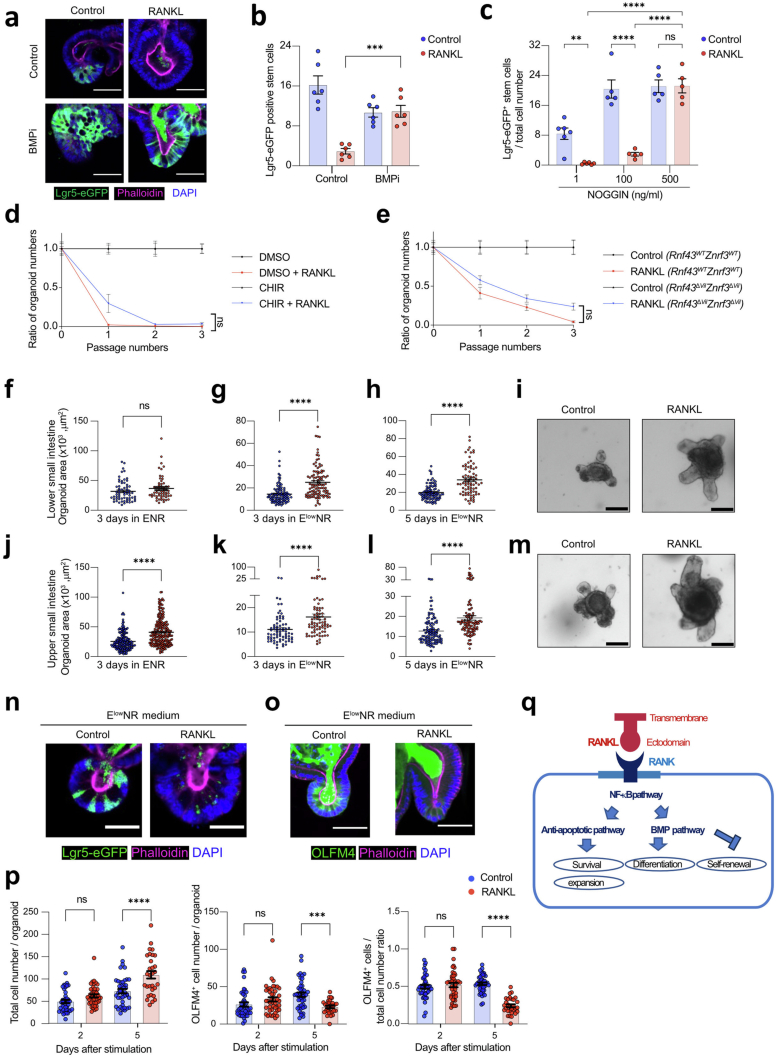
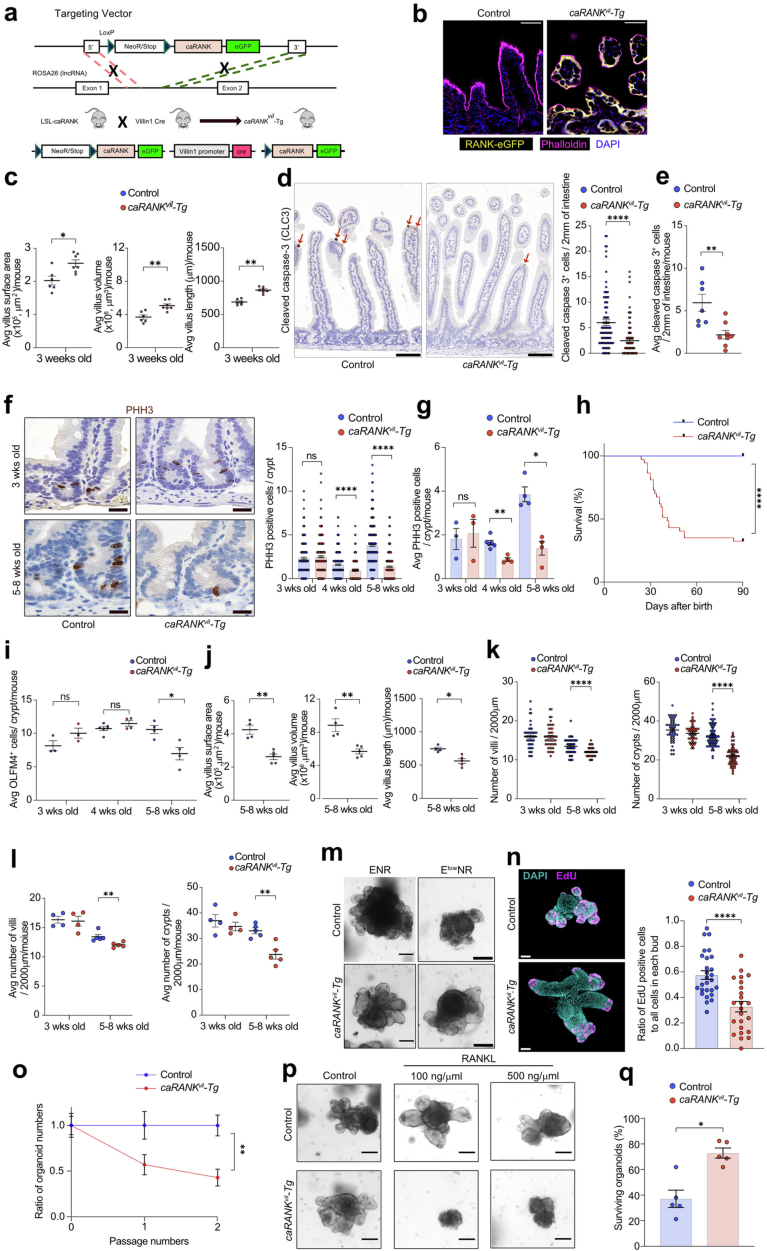
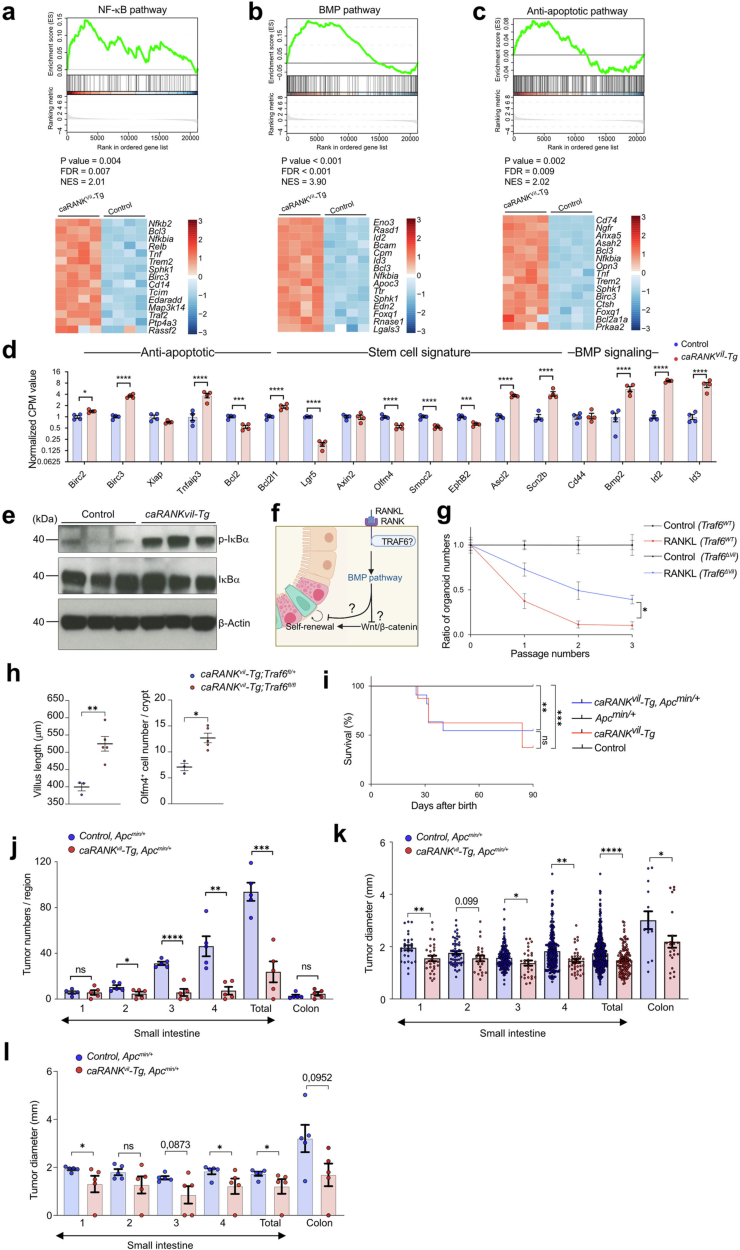
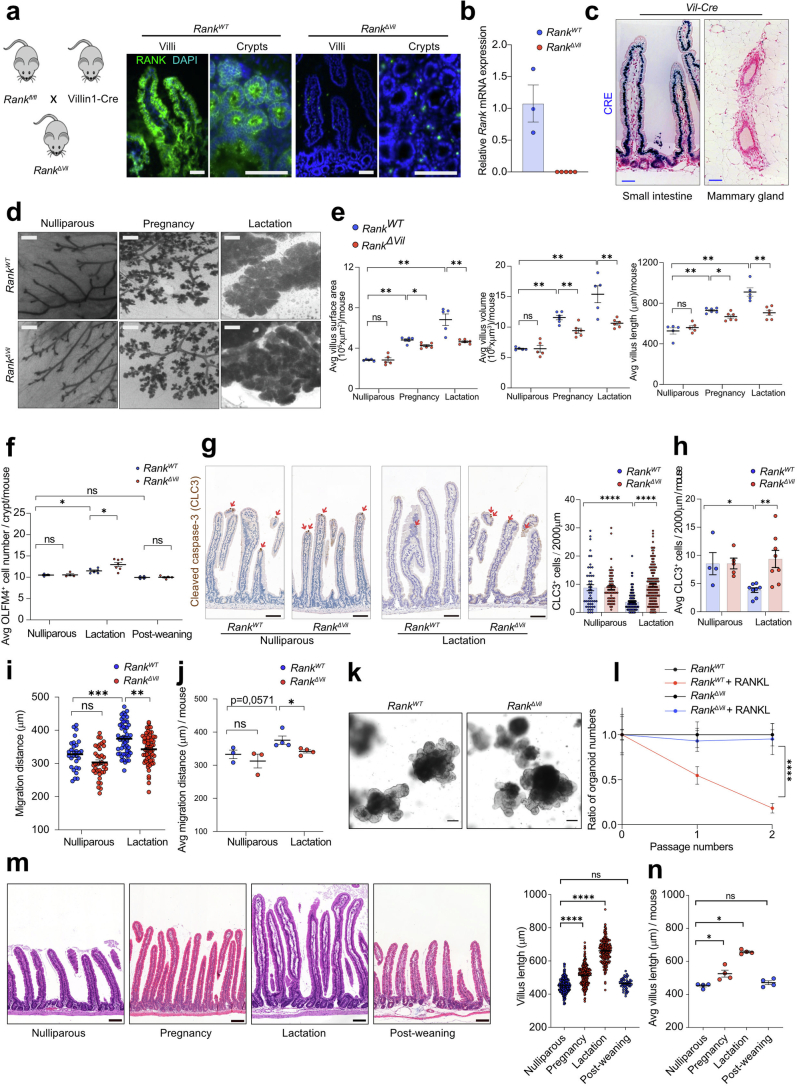
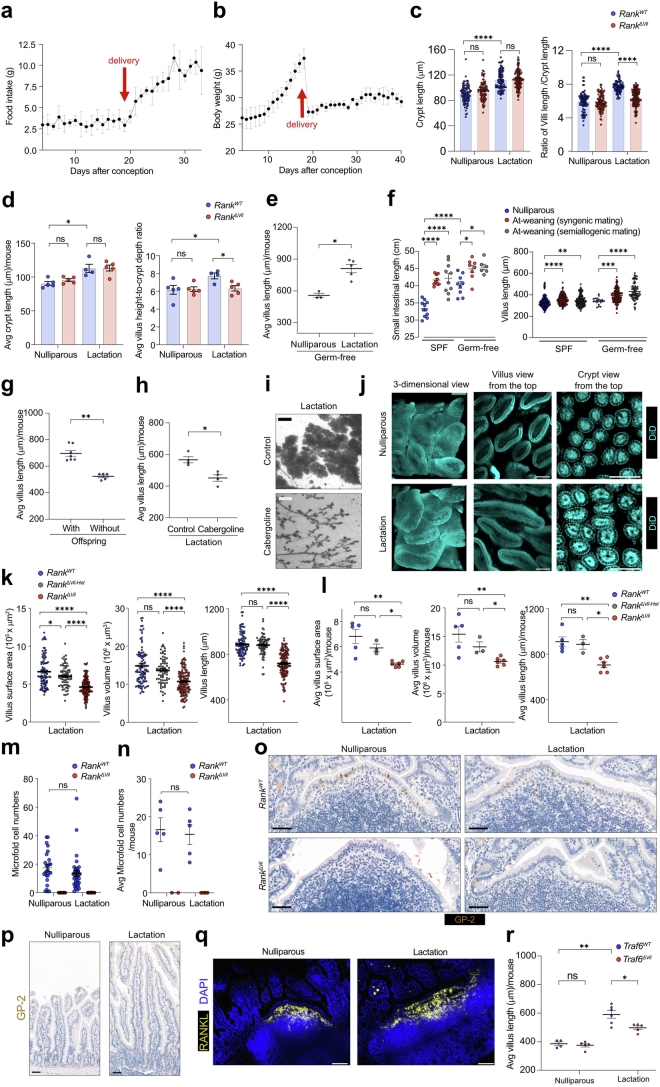
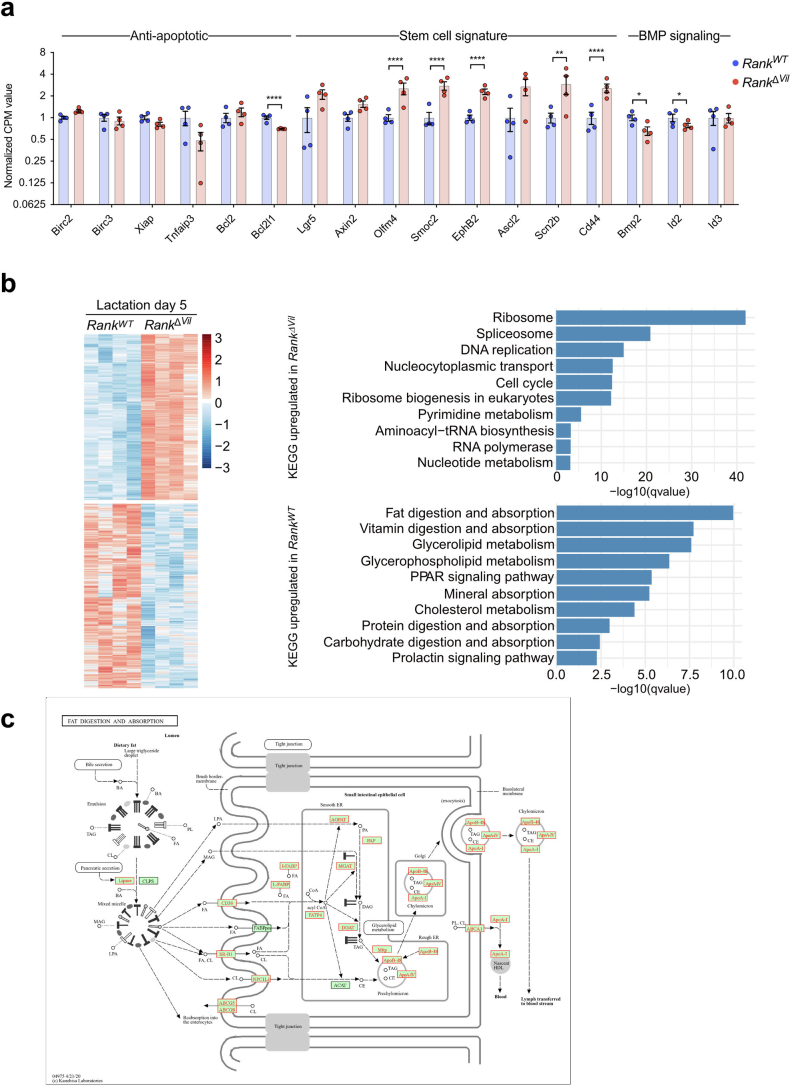
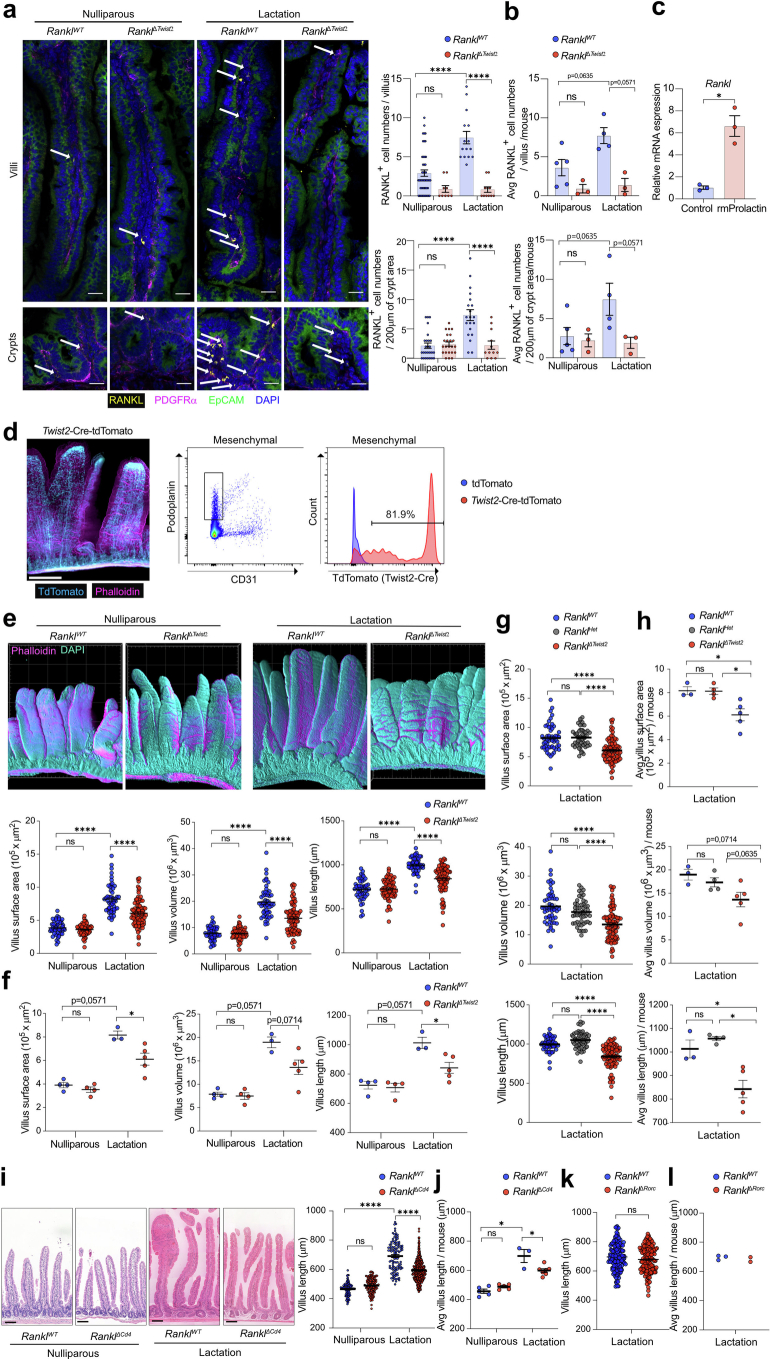
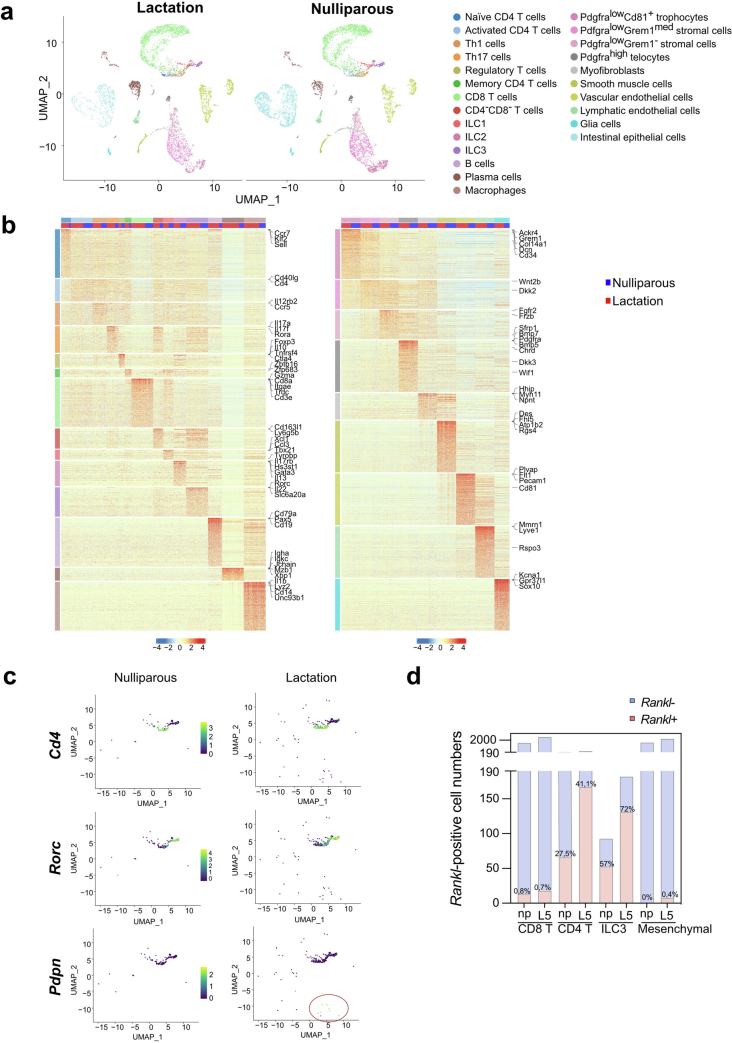
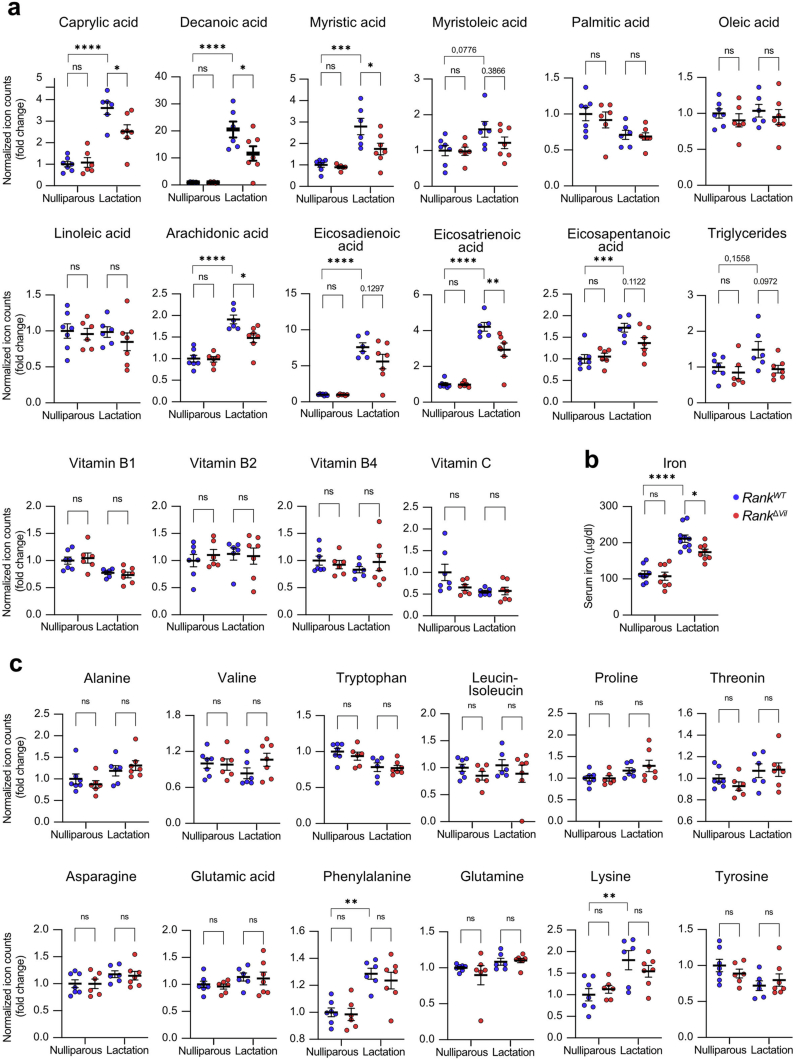
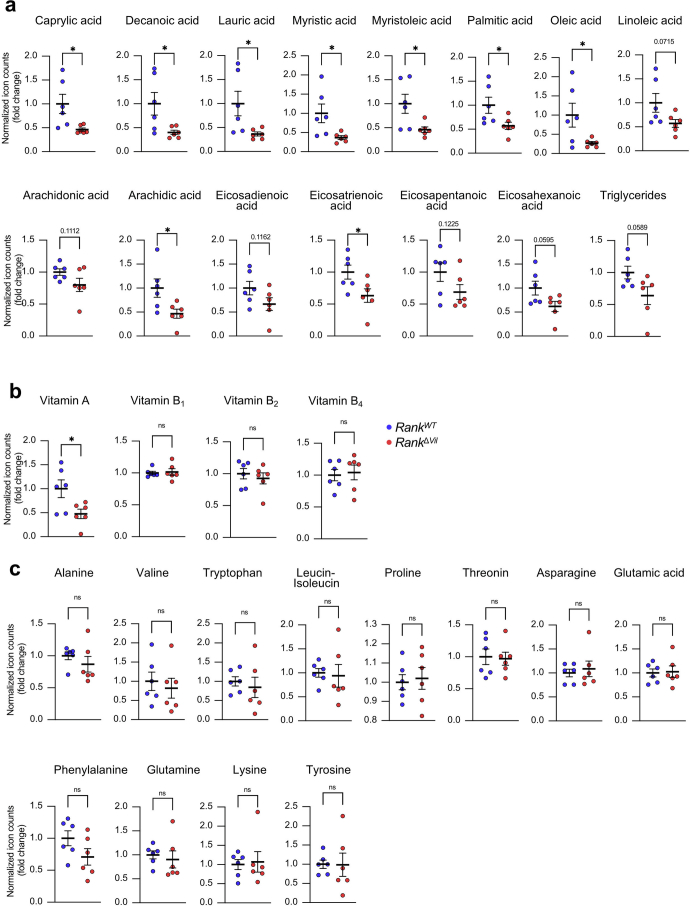
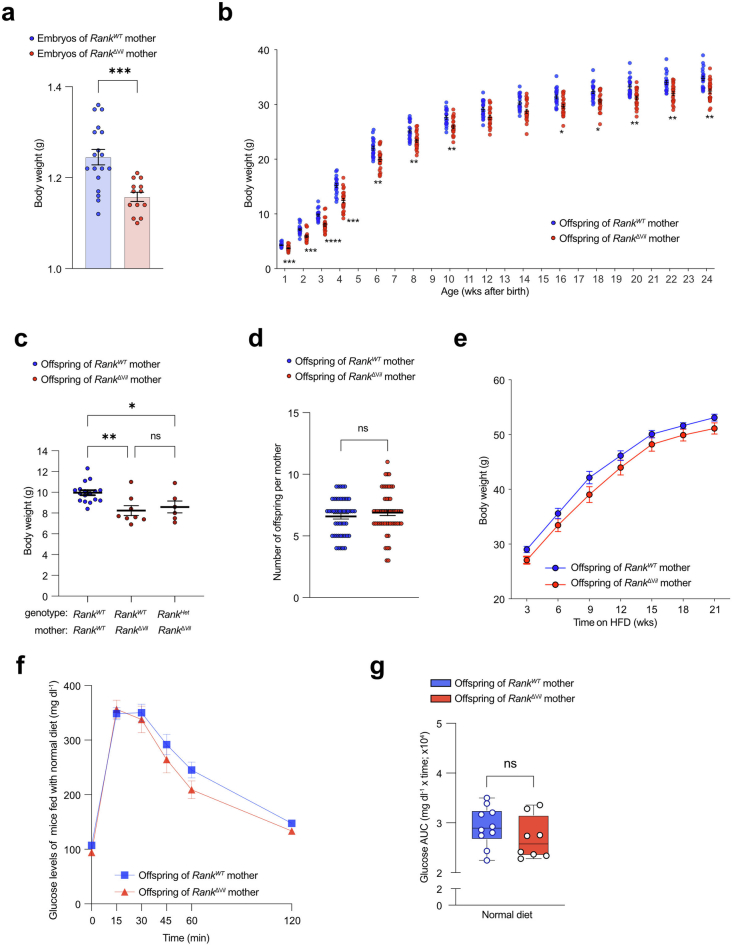
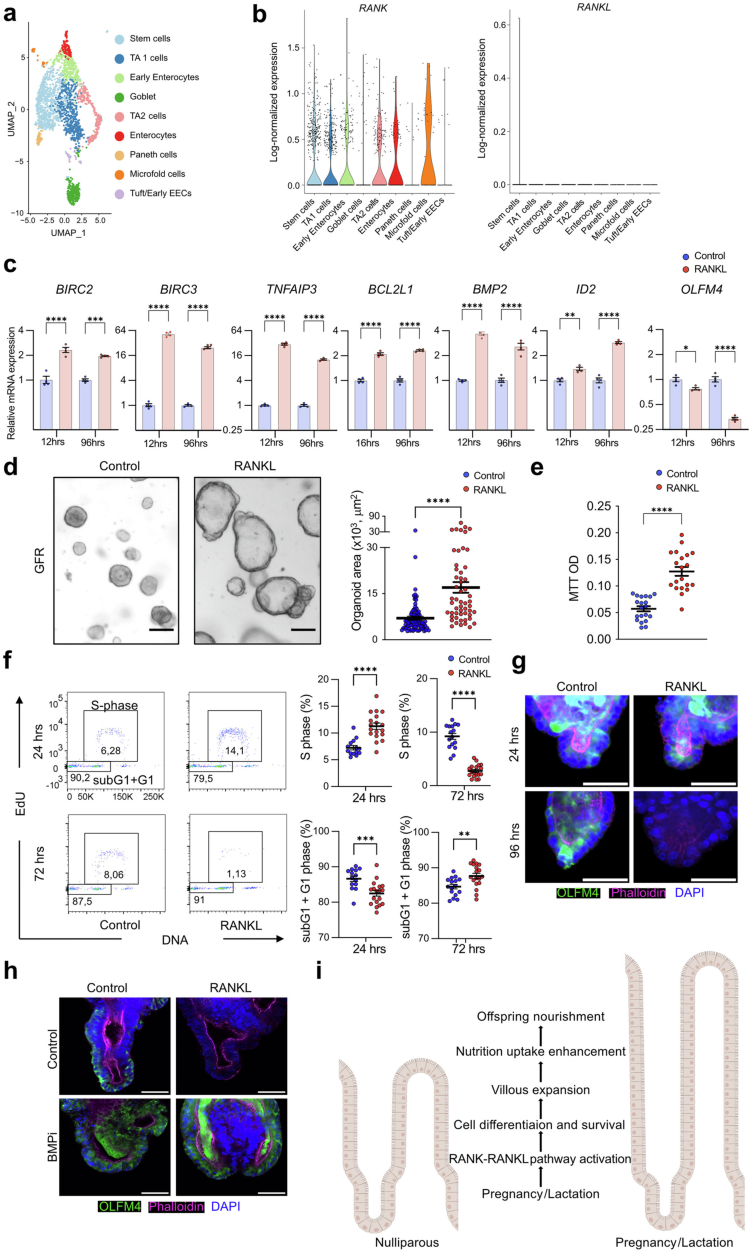
During reproduction, multiple species such as insects and all mammals undergo extensive physiological and morphological adaptions to ensure health and survival of the mother and optimal development of the offspring. Here we report that the intestinal epithelium undergoes expansion during pregnancy and lactation in mammals. This enlargement of the intestinal surface area results in a novel geometry of expanded villi. Receptor activator of nuclear factor-κΒ (RANK, encoded by TNFRSF11A) and its ligand RANKL were identified as a molecular pathway involved in this villous expansion of the small intestine in vivo in mice and in intestinal mouse and human organoids. Mechanistically, RANK-RANKL protects gut epithelial cells from cell death and controls the intestinal stem cell niche through BMP receptor signalling, resulting in the elongation of villi and a prominent increase in the intestinal surface. As a transgenerational consequence, babies born to female mice that lack Rank in the intestinal epithelium show reduced weight and develop glucose intolerance after metabolic stress. Whereas gut epithelial remodelling in pregnancy/lactation is reversible, constitutive expression of an active form of RANK is sufficient to drive intestinal expansion followed by loss of villi and stem cells, and prevents the formation of Apcmin-driven small intestinal stem cell tumours. These data identify RANK-RANKL as a pathway that drives intestinal epithelial expansion in pregnancy/lactation, one of the most elusive and fundamental tissue remodelling events in mammalian life history and evolution.


Conflict of interest statement

Competing interests: The authors declare no competing interests.

Figures

Fig. 1
Fig. 1. RANK–RANKL drives growth and stem cell exhaustion in mouse intestinal organoids.
a, RANK and EPCAM intestinal staining in RankWT and RankΔvil mice. Scale bars, 25 μm. b, Left, representative images of jejunal organoids cultured without (control) and with recombinant mouse RANKL (rmRANKL; 50 ng ml−1) for 3 days. Scale bars, 100 μm. Right, quantification of organoid areas after culture with or without rmRANKL for 3 days. n = 185 (control) and n = 222 (rmRANKL) from three independent experiments. c, Representative 3D images of Lgr5-eGFP;Ires-creER/+ organoids. Scale bars, 50 μm. d, Representative images of OLFM4 staining of control and rmRANKL-treated organoids. Scale bars, 50 μm. e, Single-cell log-normalized expression of the indicated anti-apoptotic genes (y axis) in each cell type (x axis) (control jejunal organoids versus organoids cultured with 50 ng ml−1 rmRANKL for 12 h). f, Organoids treated with or without rmRANKL (50 ng ml−1) were irradiated and cultured in WENR medium with a ROCK inhibitor (Y-27632; 10 μM) (see Methods) for 7 days. The numbers of surviving organoids from three independent experiments are shown. n = 22 (control and rmRANKL). g, Single-cell log-normalized expression of Bmp2 and the BMP targeted genes Id2 and Id3 (y axis) in each cell type (x axis). h, The ratio of organoid numbers cultured in the presence of rmRANKL (50 ng ml−1), DMSO (control) or with the BMP inhibitor (BMPi) LDN193189 (0.5 μM). The ratio of organoid numbers in the control + RANKL group was normalized to the control group, whereas the ratio of organoid numbers in the iBMP + RANKL group was normalized to the iBMP group. Data are combined from two experiments. n = 10 for each group shown. i, Representative images of rmRANKL-treated Lgr5-eGFP;Ires-creER/+ organoids that were cultured with recombinant mouse NOGGIN. Scale bars, 50 μm. In the indicated images, phalloidin stains actin filaments and DAPI stains nuclei. Data are mean ± s.e.m. Statistical analysis was performed using two-tailed Student’s t-tests (b and f), two-sided Wilcoxon rank-sum tests between samples, adjusted using Benjamini–Hochberg correction (e and g) and one-way analysis of variance (ANOVA) with Tukey’s post hoc test (h); ****P< 0.0001. Further details on statistics and reproducibility are provided in the Methods. Source Data
Fig. 2
Fig. 2. Constitutive activation of RANK in vivo modulates the intestinal stem cell niche.
a, Representative 3D reconstruction of small intestine from 3-week-old control and caRANKvil-Tg mice (top). Grid spacing is 200 μm. Bottom, villus length, volume and surface areas of control (n = 6 mice, n = 126 villi) and caRANKvil-Tg mice (n = 7 mice, n = 145 villi analysed). b, Representative OLFM4 immunostaining in the small intestines of 3- and 5–8-week-old control and caRANKvil-Tg mice (top). Scale bars, 20 μm. Bottom, the numbers of OLFM4+ cells per crypt in control and caRANKvil-Tg mice were quantified at 3 weeks (n = 3 mice, n = 234 crypts (control); n = 3 mice, n = 205 crypts (caRANKvil-Tg)), 4 weeks (n = 6 mice, n = 162 crypts (control); n = 4 mice and n = 110 crypts (caRANKvil-Tg)) and at 5–8 weeks (n = 4 mice, n = 203 crypts (control); n = 4 mice, n = 178 crypts (caRANKvil-Tg)) of age. c, Representative 3D reconstruction of the small intestines of 5–8-week-old control and caRANKvil-Tg mice (top). Grid spacing is 200 μm. Bottom, the villus length, volume and surface areas of control (n = 4 mice, n = 47 villi) and caRANKvil-Tg mice (n = 5 mice, n = 65 villi). d, Representative OLFM4 immunostaining in the small intestines of 8-week-old caRANKvil-Tg;Traf6fl/+ (n = 3) and caRANKvil-Tg;Traf6fl/fl (n = 5) mice. Scale bars, 100 μm. e, The numbers of OLFM4+ cells per crypt and the villus length in caRANKvil-Tg;Traf6fl/+ (n = 3 mice, 172 crypts, 40 villi) and caRANKvil-Tg; Traf6fl/fl (n = 5 mice, 299 crypts, 167 villi) mice. f, Representative macroscopic images of the small intestines of Apcmin/+ and caRANKvil-Tg;Apcmin/+ mice. Scale bars, 7.5 mm. g, The ratio of tumoroid numbers cultured without (control) or with rmRANKL (50 ng ml−1) (top). The ratio of organoid numbers in the RANKL-treated group was normalized to the control group. Data were combined from two independent experiments. n = 4 (control) and n = 4 (rmRANKL). Bottom, representative images of tumoroids established from Apcmin/+ mice at passage 0, 1 and 2, cultured in the absence (control) or presence of rmRANKL (50 ng ml−1). Scale bars, 100 μm. Each point represents the measurement of length, volume and surface area (a (bottom), c (bottom) and e (top)), and the number of OLFM4+ cells per crypt (b (bottom) and e (bottom)). Data are mean ± s.e.m. *P < 0.05; NS, not significant. Statistical analysis was performed using two-tailed Student’s t-tests (a, c, e and g) and one-way ANOVA with Tukey’s post hoc test (b). Further details on statistics and reproducibility are provided in the Methods. Source Data
Fig. 3
Fig. 3. RANK–RANKL controls intestinal villus expansion in pregnancy and lactation.
a, Representative 3D reconstruction of the upper small intestine from nulliparous and lactating (5 days after delivery, L5) RankWT and RankΔvil female mice (top). Grid spacing is 200 μm. Bottom, the small intestinal villus length, volume and surface areas in nulliparous RankWT (n = 5 mice, n = 88 villi), nulliparous RankΔvil (n = 5 mice, n = 97 villi), P18.5 RankWT (n = 6 mice, n = 89 villi), P18.5 RankΔvil (n = 6 mice, n = 93 villi), L5 RankWT (n = 5 mice, n = 91 villi) and L5 RankΔvil (n = 6 mice, n = 141 villi) mice. b, Representative OLFM4 immunostaining in the small intestines of the indicated mice (top). Scale bars, 20 μm. Bottom, quantification of OLFM4+ cells per crypt in nulliparous RankWT (n = 3 mice, n = 87 crypts), nulliparous RankΔvil (n = 4 mice, n = 130 crypts), L5 RankWT (n = 6 mice, n = 160 crypts) and L5 RankΔvil (n = 7 mice, n = 181 crypts) mice, and RankWT (n = 4 mice, n = 59 crypts) and RankΔvil (n = 5 mice, n = 44 crypts) mice 6 weeks after weaning of the offspring. c, Representative 3D images (left) and villi lengths of small intestines from age-matched nulliparous (n = 3 mice, n = 70 villi analysed) and lactating (n = 5 mice, n = 94 villi) germ-free C57BL6 mice (right). Grid spacing is 200 μm. d, Left, representative small intestinal sections (haematoxylin and eosin (H&E) staining) of L5 wild-type mice and wild-type mice whose offspring were removed on 1 day after delivery (no lactation). Scale bars, 100 μm. Right, quantification of villus length in L5 dams (with offspring) (n = 7 mice, n = 170 villi) and female mice with their offspring removed (without offspring) (n = 5 mice, n = 158 villi). e, Representative small intestinal sections (H&E staining) (left) and quantification of villi lengths (right) of L5 wild-type mice treated with DMSO or cabergoline (5 mg per kg) for 5 consecutive days starting on the day of delivery. Villi were assessed on day 5 after delivery. Scale bars, 100 μm. Right, quantification of villus length in mice treated with DMSO (n = 4 mice, n = 148 villi) and mice treated with cabergoline (n = 4 mice, n = 179 villi). f, Representative H&E-stained intestinal sections from nulliparous Traf6WT and Traf6Δvil mice, and L5 lactating Traf6WT and Traf6Δvil mice (left). Scale bars, 100 μm. Right, quantification of villous length in nulliparous Traf6WT (n = 4 mice, n = 76 villi) and Traf6Δvil (n = 5 mice, n = 73 villi) mice, and L5 Traf6WT (n = 6 mice, n = 198 villi) and Traf6Δvil (n = 5 mice, n = 226 villi) mice. Data are mean ± s.e.m. Each point represents the measurement of length, volume and surface area (a (bottom) and cf (right)), and the number of OLFM4+ cells per crypt (b, bottom). Statistical analysis was performed using one-way ANOVA with Tukey’s post hoc test (a, b and f) and two-tailed Student’s t-tests (ce); **P < 0.01, ***P < 0.001. Source Data
Fig. 4
Fig. 4. Transgenerational effects in the offspring of RankΔvil dams.
a, The levels of free fatty acids, triglycerides and vitamin A in the milk of lactating (L8) RankWT and RankΔvil dams (n = 6 for each group) were measured using mass spectrometry. b, IgA and IgG concentrations were measured using an enzyme-linked immunosorbent assay (ELISA) analysis of the milk collected at L8 from RankWT and RankΔvil dams (n = 14 and 10 mice, respectively). c, The body weights of each offspring (n = 20) from RankΔvil mothers were normalized to the average body weight of the offspring (n = 23) born to control RankWT mothers (set at 1) at all of the indicated ages. dh, Glucose tolerance analysis and insulin levels in male (n = 10 and 13 mice, respectively) offspring of RankWT and RankΔvil dams that were fed a HFD for 21 weeks. The oral glucose-tolerance test (d), the corresponding area under the curve (AUC) (e), the fasting glucose plasma levels (f), the fasting insulin plasma levels (g) and the homeostasis model assessment of insulin resistance (HOMA-IR) index (h) are shown. Data in eh are shown as box and whisker plots; the plots show the median (middle line), interquartile range (box) and minimum to maximum values (whiskers) throughout. For ad, data are mean ± s.e.m. Statistical analysis was performed using two-tailed Student’s t-tests (a, b and eh) and two-way ANOVA with Šidák’s multiple-comparison correction (c). Source Data
Fig. 5
Fig. 5. RANK–RANKL controls stem cells in human intestinal organoids.
a, Human duodenal organoids were cultured without (control) and with recombinant human RANKL (rhRANKL; 500 ng ml−1) for 2 days. Left, representative images. Scale bars, 100 μm. Right, quantification of organoid sizes. n = 83 (control) and n = 83 (rhRANKL). Data were combined from three independent experiments. b, Organoids were cultured with or without rhRANKL (500 ng ml−1) for 2 days and then irradiated and cultured for additional 7 days. Data show the number of surviving organoids combined from three independent experiments. n = 12 (control) and n = 12 (rhRANKL). c, Cell cycle analyses of RANK-stimulated human duodenal organoids. Left, representative fluorescence-activated cell sorting (FACS) plots of the EdU cell cycle analysis assessed at 24 h and 72 h of rhRANKL stimulation. Right, quantification of S phase and subG1 + G1 entry. Data were combined from two independent experiments. n = 12 for each condition. d, The ratio of the numbers of wild-type (WT) and BMPR1A-knockout (BMPR1A-KO) human small intestinal organoids in the absence or presence of rhRANKL (500 ng ml−1). The ratio of organoid numbers in the WT + RANKL group was normalized to untreated WT organoids; and the ratio of organoid numbers in the BMPR1A-KO + RANKL organoids was normalized to the untreated BMPR1A-KO organoids. n = 3 for each condition. e, Cell cycle analyses of RANK-stimulated duodenal organoids in the absence (control) and presence of the BMPi LDN193189 (1.6 μM). Left, representative FACS plots depicting EdU cell cycle analysis after 72 h rhRANKL stimulation with or without BMPi. Right, quantification of S phase and sbG1 + G1 entry. n = 11 (control), n = 12 (control + RANKL), n = 12 (BMPi) and n = 12 (BMPi + RANKL). Data were combined from two independent experiments. f, Representative images of OLFM4+ stem cells in WT and BMPR1A-KO human small intestinal organoids with or without rhRANKL (500 ng ml−1). Scale bars, 50 μm. Dots represent individual datapoints. Data are mean ± s.e.m. Statistical analysis was performed using two-tailed Student’s t-tests (ac) and one-way ANOVA with Tukey’s post hoc test (d and e). Further details on statistics and reproducibility are provided in the Methods. Source Data
Extended Data Fig. 1
Extended Data Fig. 1. Characterization of stem cells in RANK–RANKL-stimulated mouse intestinal organoids.
a, Representative images of anti-RANK immunostaining in mouse jejunal intestinal organoids from RankWT and RankΔVil mice. DAPI is shown to visualize nuclei. Scale bars, 50 μm. b, Proliferation assay in organoids without (control) or in the presence of recombinant mouse RANKL (rmRANKL; 50 ng/ml) as determined by an MTT assay at the indicated time points. Each plot represents MTT OD, pooled from at least two independent experiments. Group numbers at 2 days: n = 56 (control), n = 56 (rmRANKL); 3 days: n = 50 (control), n = 50 (rmRANKL); 5 days: n = 31 (control), n = 31 (rmRANKL) and 7 days: n = 32 (control), n = 31 (rmRANKL). c, Numbers of buds per intestinal organoid cultured in ENR medium with/without rmRANKL. Data were combined from three independent experiments. Group numbers at 3 days: n = 22 (control), n = 59 (rmRANKL); 4 days: n = 57 (control), n = 102 (rmRANKL) and 5 days: n = 32 (control), n = 66 (rmRANKL) per group. d, Representative images of jejunal organoids at passage 0 and passage 1 cultured in the absence (control) or presence of the indicated concentrations of rmRANKL. Scale bars, 100 μm. e, Ratios of organoid numbers after prolonged passaging in the absence (control) and presence of rmRANKL. Numbers of organoids were counted at each passage. Data from two independent experiments are shown. n = 8 (control), n = 8 (10 ng/ml RANKL), n = 8 (50 ng/ml RANKL), n = 8 (500 ng/ml RANKL). f, Total cell numbers, OLFM4 positive cells per organoid and ratios of OLFM4 positive cell in relation to the total cell number per each jejunal organoid cultured in ENR medium with/without rmRANKL. Data were combined from two independent experiments. 2 days: n = 31 (control), n = 37 (rmRANKL); 5 days: n = 29 (control), n = 29 (rmRANKL) per group. g, Gating strategy for detecting Lgr5-eGFP+ cells using fluorescence-activated cell sorting (FACS). Viability was determined using the viability-dye described in the Methods. FSC, forward scatter; SSC, side scatter. h, Representative FACS histograms of Lgr5high cells and CD44+ cells isolated from Lgr5-eGFPiresCreER/+ jejunal organoids cultured without (control) and with rmRANKL (50 ng/ml) for the indicated times. Numbers of Lgr5high cells and CD44+ cells among total viable organoid cells are indicated for each group. Data are representative of at least two independent experiments. i, Quantification of Lgr5high, Lgr5highCD44+, and CD44+ cells per well in Lgr5-eGFPiresCreER/+ jejunal organoids cultured without (control) or with rmRANKL (50 ng/ml) for the indicated times. n = 36 (Control, 24hrs), n = 36 (RANKL, 24hrs), n = 21 (Control, 48hrs), n = 24 (RANKL, 48hrs). Data are mean ± s.e.m. *P < 0.05; **P < 0.01; ***P < 0.001; ****P < 0.0001; ns, not significant. One-way analysis of variance (ANOVA) with Tukey’s post hoc test (b,c,f); Two-tailed Student’s t-test (i). More details on statistics and reproducibility can be found in the Methods. Source Data
Extended Data Fig. 2
Extended Data Fig. 2. Bulk RNA-seq profiling of RANK–RANKL-stimulated mouse intestinal organoids.
a-e, RANK–RANKL-induced gene expression changes in jejunal organoids without (control, n = 4) and with rmRANKL (n = 4) stimulation. Total RNA was isolated 12 hrs after addition of rmRANKL (50 ng/ml) and processed for bulk RNA-seq. a, RANK–RANKL-triggered expression changes in NF-κB signalling as assessed by Ingenuity Pathway Analysis. The node colours indicate changes in expression levels of the indicated genes, determined by DESeq2 (p < 0,05). Red, up-regulated gene expression in RANKL treated samples; green, down-regulated gene expression; white, no expression changes; orange, Ingenuity predicted activation. Orange arrows indicate activation of the specified downstream signalling pathways; grey arrows indicate previously reported connections, albeit these pathways were not identified in our data set using Ingenuity. The Ingenuity enrichment statistics for this pathway were determined using Fischer’s Exact Test p-value with Benjamin–Hochberg correction, 4.93E-08; Z score, 2,722. b-e, RANK–RANKL-induced changes of the NF-κB, anti-apoptotic, BMP, and ERK/MAPK pathways as assessed by Gene set enrichment analysis (GSEA) enrichment plots (top panels). Bottom panels show heatmaps of the top 15 genes upregulated in response to RANKL stimulation. Expression profiles of RANKL-stimulated jejunal organoids were compared to non-stimulated (control) jejunal organoids cultured for the same time periods. f, Differential gene expression analysis of RNAseq data from mouse jejunal organoids without (control) and with rmRANKL stimulation. RNA was isolated 12 h after addition of rmRANKL (50 ng/ml). Normalized CPM values of selected anti-apoptotic genes, stem cell signature genes and BMP signalling genes are shown. Individual data points are shown (n = 4/4). g, Quantitative RT–PCR analyses to compare expression levels of anti-apoptotic genes, stem cell signature genes and BMP signalling genes in mouse jejunal organoids. Data represent the relative expression of the indicated genes in jejunal organoids cultured in the presence of rmRANKL (50 ng/ml) without (control, DMSO solvent) or with the NFκB inhibitor (NFκBi) sc-514 (100 mM). Gene expression was compared to control (no RANKL treatment) organoids (set at 1). n = 6 independent jejunal organoids were analysed for each group. rmRANKL stimulation was done for 12 h. Data are mean ± s.e.m. *P < 0.05; **P < 0.01; ***P < 0.001; ****P < 0.0001; ns, not significant. Enrichment-adjusted p-values (P value), False Discovery Rates (FDR), and Normalized Enrichment Scores (NES) were calculated using two-sided fast pre-ranked gene set enrichment analysis (fGSEA) (b-e). Two-sided DESeq2 Wald tests, adjusted with the Benjamini–Hochberg procedure (f); Repeated measure One-way analysis of variance (ANOVA) with Tukey’s post hoc test (g). Source Data
Extended Data Fig. 3
Extended Data Fig. 3. Single-cell RNA-seq profiling of RANK–RANKL-stimulated mouse jejunal organoids.
a, Uniform manifold approximation and projection (UMAP) of 3,143 cells from both control intestinal organoids (2,299 cells) and organoids cultured in the presence of rmRANKL (50 ng/ml) for 12 hrs (844 cells). Cells are colour coded according to their cell-type annotation using unsupervised clustering. b, Heatmap representing scaled single cell log-normalized gene expression of markers for epithelial cell-types taken from published cell-type signatures (Yum et al., Haber et al. and Biton et al.). Columns are ordered by the indicated cell-type annotations and sample of origin (control mouse jejunal organoids versus jejunal organoids cultured with 50 ng/ml rmRANKL for 12 hrs). The marker genes (rows) are grouped by cell-type. c, Rank mRNA expression in jejunal organoid subpopulations. Violin plots show single cell log-normalized expression of Rank mRNA in each of the indicated cell-types for control (not stimulated with rmRANKL) organoids. Each dot represents an individual cell. d, RANK/RANKL stimulation induces anti-apoptotic genes. Violin plots show single cell RNAseq UCell scores for apoptotic gene sets (GO:0043066) in the indicated organoid cell-types. e, Violin plots showing single cell RNAseq UCell scores for the BMP signalling pathway gene set in the indicted organoid cell subsets. f, Induction of the NF-κB pathway in response to rmRANKL (50 ng/ml, 12 hrs) as compared to non-treated jejunal organoids (control). Violin plots show UCell scores for the NF-κB pathway gene set (GO:0038061) in each cell-type. g, Induction of ERK/MAPK target genes in control and rmRANKL-stimulated (50 ng/ml, 12 hrs) jejunal organoids. Violin plots show UCell scores for the ERK/MAPK target gene set obtained from Reactome (Reactome_M13408) in each organoid cell-type. *P < 0.05; ***P < 0.001; ****P < 0.0001; ns, not significant. Two-sided Wilcoxon Rank Sum test between samples, adjusted with the Benjamini–Hochberg procedure (d-g).
Extended Data Fig. 4
Extended Data Fig. 4. The key pathways for RANK–RANKL-driven stem cell exhaustion in mouse intestinal organoids.
a, Left panels, representative images of rmRANKL-treated (50 ng/ml) Lgr5-eGFPiresCreER/+ organoids cultured without (control, DMSO solvent) or with the BMPi LDN193189 (0,5μM). Phalloidin indicates actin filaments, and DAPI shows nuclei. Scale bars, 50 μm. b, Quantification of the ratio of Lgr5+ cells per well in Lgr5-eGFPiresCreER/+ jejunal organoids cultured in the presence of rmRANKL (50 ng/ml) without (control, DMSO solvent) or with the BMP inhibitor (BMPi) LDN193189 (0,5μM) using FACS. Data points represent individual wells from at least 2 independent experiments. n = 6 (Control), n = 6 (Control+RANKL), n = 6 (BMPi), n = 6 (BMPi+RANKL). c, Quantification of the ratio of Lgr5+ cells per well in Lgr5-eGFPiresCreER/+ jejunal organoids cultured in the presence of rmRANKL (50 ng/ml) together with 1, 100, or 500 ng/ml of rmNOGGIN, determined using FACS. Data points represent individual wells pooled from at least 2 independent experiments. n = 6 (1 ng/ml NOGGIN), n = 6 (1 ng/ml NOGGIN + RANKL), n = 5 (100 ng/ml NOGGIN), n = 5 (100 ng/ml NOGGIN + RANKL), n = 5 (500 ng/ml NOGGIN), n = 5 (500 ng/ml NOGGIN + RANKL). d, Ratios of mouse jejunal organoid numbers cultured in the presence of rmRANKL (50 ng/ml) without (control, DMSO solvent) or with the GSK3 inhibitor CHIR 99021 (20μM). The numbers of organoids were counted at each passage. The ratio of organoid numbers in the Control + RANKL group was normalized to control organoids, whereas the ratio of organoid numbers in the CHIR + RANKL treated group was normalized to CHIR only treated organoids. Data are combined from 2 independent experiments. n = 11 for each group shown. e, Ratios of numbers of jejunal organoids from Rnf43WTZnrf3WT and Rnf43ΔVilZnrf3ΔVil mice after prolonged culture in the presence of rmRANKL (50 ng/ml). The numbers of organoids were counted at each passage. The ratio of organoid numbers in the RANKL treated Rnf43WTZnrf3WT organoids was normalized to untreated control Rnf43WTZnrf3WT organoids, whereas the ratio of organoid numbers in the RANKL treated Rnf43ΔVilZnrf3ΔVil group was normalized to control Rnf43ΔVilZnrf3ΔVil organoids. Data are from 2 independent experiments. n = 11 for each group shown. f, Sizes of mouse intestinal organoids generated from the lower small intestine (ileum) cultured in ENR medium (50 ng/ml EGF) with/without rmRANKL (50 ng/ml) for 3 days; n = 63 (control), n = 58 (rmRANKL) per group. Data are from 3 independent experiments. g,h, Sizes of intestinal organoids generated from the ileum cultured in EGF-reduced ElowNR medium (50 pg/ml EGF) with/without rmRANKL (50 ng/ml) for 3 days (n = 99 (control), n = 104 (rmRANKL)) and 5 days (n = 89 (control), n = 78 (rmRANKL)). Data are from 3 independent experiments. i, Representative images of intestinal organoids generated from the ileum cultured in ElowNR medium with/without rmRANKL for 5 days. Scale bars, 100 μm. j, Sizes of intestinal organoids generated from upper small intestine (jejunum) cultured in ENR medium (50 ng/ml EGF) with/without rmRANKL (50 ng/ml) for 3 days; n = 185 (control), n = 222 (rmRANKL). Data are combined from 3 independent experiments. Of note, these are the same data as shown in Fig. 1b, for better comparison. k,l, Sizes of intestinal organoids generated from the jejunum cultured in ElowNR medium (50 pg/ml EGF) with/without rmRANKL (50 ng/ml) for 3 days (n = 74 (control), n = 76 (rmRANKL) per group) and 5 days (n = 113 (control), n = 105 (rmRANKL) per group). Data are combined from 3 independent experiments. m, Representative images of jejunal organoids cultured in ElowNR medium with/without rmRANK for 5 days. Scale bars, 100 μm. n, Representative images of Lgr5eGFPiresCreER/+ jejunal organoids cultured in ElowNR medium with/without rmRANK for 5 days. Lgr5 positive stem cells are shown in green. Phalloidin (magenta) and DAPI (blue) are shown to visualize F-actin and nuclei, respectively. Scale bars, 25 μm. o, Representative images of OLFM4 immunostaining of jejunal organoids cultured in ElowNR medium with/without rmRANK for 5 days. Phalloidin and DAPI are shown to visualize F-actin and nuclei, respectively. Note secreted OLFM4 in the lumen of the organoids as reported previously. Scale bars, 50 μm. p, Total cell numbers, numbers of OLFM4+ cells and ratios of OLFM4+ cells to total cell numbers per jejunal organoid cultured in ElowNR medium with/without rmRANKL for 2 days (n = 43 (control), n = 44 (rmRANKL)) and 5 days (n = 44 (control), n = 30 (rmRANKL)). Data were combined from at least 2 independent experiments. q, Proposed mechanism for RANKL-induced cell survival of intestinal epithelial cells via induction of anti-apoptotic genes and NF-κB signalling and intestinal stem cell exhaustion via induction of BMP2. Data are mean ± s.e.m. **P < 0.01; ***P < 0.001; ****P < 0.0001; ns, not significant. One-way analysis of variance (ANOVA) with Tukey’s post hoc test (b,c, d,e,p); Two-tailed Student’s t-test (f-h, j-l). More details on statistics and reproducibility can be found in the Methods. Source Data
Extended Data Fig. 5
Extended Data Fig. 5. The in vivo effects of constitutive activation of RANK in intestinal epithelium.
a, Schematic outline of transgenic mice that conditionally express a constitutively active RANK mutant in the ROSA26 locus using gene targeting, termed LSL-caRANK mice. Crossing this line with Villin1Cre mice removes the stop cassette and thereby drives specific expression of the RANK transgene in the intestinal epithelium; these mice are termed caRANKvil-Tg. LSL, LoxP-STOP-LoxP; NeoR, neomycin resistance cassette; eGFP, enhanced green fluorescence protein. b, Representative images of eGFP expression in intestinal epithelial cells of caRANKvil-Tg mice and control mice, using cryo-sections. Phalloidin and DAPI are shown to visualize F-actin and nuclei, respectively. Scale bars, 50 μm. c, Small intestinal villi length, volume and surface areas of 3-week-old control (n = 6 mice, n = 126 villi analysed) and caRANKvil-Tg mice (n = 7/145). Each data point represents the average length, volume, and surface area of villi per mouse. The original data is the same as Fig. 2a. d,e, Reduced cell death of small intestinal epithelial cells in caRANKvil-Tg mice. Representative images (left in d) and quantification (right in d, e) of cleaved caspase-3 (CLC3) immunostaining (arrows) in the small intestine are shown for three wks old control mice (n = 7 mice, n = 93 regions analysed) and caRANKvil-Tg mice (n = 8/126). Each data point represents the number of CLC3 positive cells in villi per 2 mm of the intestine (d) and the average number per mouse (e). Scale bars, 100 μm. f,g, Representative images (left in f) and quantification of phosphor-Histone H3 (pHH3) immunostaining in the crypts of the upper small intestines from control and caRANKvil-Tg mice (right in f, g). 3 wks old control mice (n = 3 mice, n = 254 crypts analysed) and caRANKvil-Tg mice (n = 4/395); 4 wks old control (n = 6/379) and caRANKvil-Tg mice (n = 4/351); and 5–8 wks old control (n = 4/556) and caRANKvil-Tg littermates (n = 4/487). Each data point represents the number of pHH3 positive cells per individual crypts (f) and average number per mouse (g). Scale bars, 20 μm. h, Kaplan–Meier survival curve of control (n = 31) and caRANKvil-Tg (n = 37) littermates. i, Numbers of OLFM4+ cells/ crypt in the indicated mice. Each data point represents the average length, volume, and surface area of villi per mouse in the indicated mice described in Fig. 2b. j, Small intestinal villi length, volume and surface areas the indicated mice. Each data point represents the averaged length, volume, and surface area of villi per mouse. The original data is the same as Fig. 2c. k,l, Numbers of villi (left) and crypts (right) per 2 mm were quantified in histological H&E sections of the upper small intestine from control (n = 4 mice, n = 48 regions) and caRANKvil-Tg (n = 4/46) mice at 3 and control (n = 5 mice, n = 63 regions) and caRANKvil-Tg (n = 5/56) mice at 3 and 5–8 wks of age. Each data point represents the number of Numbers of villi (left) and crypts (right) per 2 mm of the intestine (k) and the average number per mouse (l). m, Representative images of mouse jejunal organoids from 2 weeks old control caRANKvil-Tg mice, cultured in ElowNR (50 pg/ml EGF) or ENR (50 ng/ml EGF) media for 3 days after the first passage. Scale bars, 100 μm. n, Representative images (left) of EdU+ proliferating cells in control small intestinal organoids (n = 7) and caRANKvil-Tg mice-derived organoids (n = 6). Scale bars, 50 μm. Right; ratios of EdU labelled proliferating cells to all cells presents in each bud. The analysed bud number is n = 27 (control) and n = 24 (caRANKvil-Tg). o, Ratios of organoid numbers after prolonged culture of control- and caRANKvil-Tg mice-derived jejunal organoids. Numbers of organoids were counted at each passage. The ratio of organoid numbers in the caRANKvil-Tg mice-derived jejunal organoids was normalized to untreated control jejunal organoids. Data were combined from two independent experiments. n = 6 (control), n = 6 (caRANKvil-Tg). p, Representative images of control and caRANKvil-Tg mice-derived small intestinal organoids cultured with/without recombinant human RANKL (rhRANKL; 100, 500 ng/ml) for 4 days. Scale bars, 100 μm. q, Percentages of surviving control and caRANKvil-Tg jejunal organoids after irradiation, as compared to non-irradiated organoids of the same genotypes. Organoids were cultured in ENR medium and irradiated with 4 Gy, followed by subsequent culture for 7 days. Data are from two independent experiments. n = 5 (control), n = 5 (caRANKvil-Tg). AVG, average. Data are mean ± s.e.m. *P < 0.05; **P < 0.01; ****P < 0.0001; ns, not significant. Two-tailed Mann–Whitney U-test (c,e,g,i,j,l,o,q); Kaplan–Meier survival curve with a log-rank test (h); Two-tailed Student’s t-test (d,f,k,n). Source Data
Extended Data Fig. 6
Extended Data Fig. 6. The key pathways for RANK-induced stem cell exhaustion in vivo.
a-c, Alterations in the NF-κB, anti-apoptotic, and BMP pathways in jejunal organoids from caRANKvil-Tg mice (n = 4) compared to organoids from control mice (n = 4). Upper panels show GSEA enrichment plots. Bottom panels show heatmaps of the top 15 genes upregulated in caRANKvil-Tg organoids. Expression profiles of RANKL stimulated jejunal organoids were compared to non-stimulated (control) jejunal organoids cultured for the same time period. Total RNA was isolated from small intestinal organoids generated from two weeks old control and caRANKvil-Tg littermate (n = 4 for each group) and processed for RNA-seq. d, Differential gene expression analysis of RNA-seq data from mouse jejunal organoids derived from caRANKvil-Tg (n = 4) and control (n = 4) mice. Normalized CPM values of selected transcripts of anti-apoptotic genes, stem cell signature genes and BMP signalling genes are shown. e, Western blotting of phosphorylated IκB-α and total IκB-α in isolated intestinal epithelial cells from 3 wks old control (n = 3) and caRANKvil-Tg (n = 3) mice. β-Actin is shown as a loading control. For gel resource data, see Supplementary Fig. 1. f, Schematic outline of the proposed role of RANK/RANKL-induced stem cell proliferation and exhaustion. The figure was created with BioRender.com. g, Ratios of the numbers of organoids derived from Traf6WT and Traf6ΔVil mice after prolonged culture in the presence of rmRANKL (50 ng/ml). Numbers of organoids were counted at each passage. The ratio of organoid numbers in the RANKL Traf6WT group was normalized to control Traf6WT organoids, whereas the ratio of organoid numbers in the RANKL treated Traf6ΔVil group was normalized to untreated control Traf6ΔVil organoids. Data were combined from two independent experiments. n = 11 (Traf6WT), n = 11 (Traf6WT + RANKL), n = 11 (Traf6ΔVil), n = 11 (Traf6ΔVil + RANKL). h, Average length of villi and average number of OLFM4+ cells in each crypt per mouse from the indicated mice in the indicated mice described in Fig. 2d,e. i, Kaplan–Meier survival curve of control (n = 14), caRANKvil-Tg (n = 8), Apcmin/+ (n = 13), and caRANKvil-Tg, Apcmin/+ (n = 11) mice. j, Numbers of macroscopic adenomas and k,l, tumour diameters in the small intestine and colon of 4 months old control Apcmin/+ (n = 5 mice) and caRANKvil-Tg, Apcmin/+ (n = 5) mice. Small intestines were divided equally into 4 parts from the proximal (duodenum, labelled 1) to the distal (ileum, labelled 4) and adenomas assessed for each region. Total tumour numbers in Apcmin/+ mice; n = 29 in region 1, n = 53 in region 2, n = 156 in region 3, n = 231 in region 4, n = 469 in total, n = 14 in colon, and in caRANKvil-Tg, Apcmin/+ mice (n = 29/24/29/37/119/23). Each data point in k represents the measurements of the tumour diameter in individual tumours and in l represents the average measurement of the tumour diameters per mouse. Data are mean ± s.e.m. *P < 0.05; **P < 0.01; ***P < 0.001; ****P < 0.0001; ns, not significant. Enrichment-adjusted p-values (p-value), False Discovery Rates (FDR) and Normalized Enrichment Scores (NES) were calculated using two sided-fGSEA (a-c). Two-sided DESeq2 Wald tests, adjusted with the Benjamini–Hochberg procedure (d). One-way analysis of variance (ANOVA) with Tukey’s post hoc test (g); Two-tailed Mann–Whitney U-test (h,j,l); Kaplan–Meier survival curve with a log-rank test (i); Two-tailed Student’s t-test (k). Source Data
Extended Data Fig. 7
Extended Data Fig. 7. Cellular characterization of intestinal villi expansion in pregnancy and lactation.
a, Mating strategy to generate intestinal epithelial cell specific Rank deleted mice (left) and anti-RANK immunostaining on intestinal cryo-sections from nulliparous control RankWT and RankΔVil mice (right). Scale bars, 50 μm. b, Quantitative RT–PCR analysis of Rank mRNA expression in isolated small intestinal epithelial cells from nulliparous control RankWT (n = 3) and RankΔVil (n = 5) littermates. c, Representative immunostaining to detect CRE expression (blue) in the small intestine (left panel) and mammary gland (right panel) of Villin1-Cre mice. Paraffin sections were counterstained with hematoxylin. Scale bars, 50 μm. d, Representative whole mount images (hematoxylin staining) of mammary glands from nulliparous RankWT, nulliparous RankΔVil, pregnant RankWT (day 18.5 of pregnancy, P18.5), pregnant RankΔVil females, lactating RankWT (5 days after delivery, L5) and lactating L5 RankΔVil females. Scale bars, 500 μm. e, Small intestinal villi length, volume and surface areas in indicated mice. Each data point represents average villi length, volume and surface area per mouse in the indicated mice described in Fig. 3a. f, Quantification of the average number of OLFM4+ cells in each crypt per mouse in the indicated mice described in Fig.  3b. g,h, Cell death of villous epithelial cells from nulliparous RankWT and RankΔVil females and age-matched lactating (L5) RankWT and RankΔVil dams, as determined by immunostaining of cleaved caspase 3 (CLC3). Representative immunostaining. Scale bars, 100 μm (left in g). Quantification of CLC3 positive cells in villi per 2 mm of the intestine in nulliparous RankWT (n = 4 mice, n = 49 regions analysed) and RankΔVil females (n = 5/59) and age-matched lactating (L5) RankWT (n = 8/162) and RankΔVil dams (n = 8/135) (right in g and h). Each data point represents the numbers of CLC3 positive cells in villi per each 2 mm of the intestine (g) and average number per mouse (h). i,j, Quantification of the EdU-labelled intestinal epithelial cell migration along the crypt-villus axis in nulliparous RankWT (n = 3 mice, n = 29 crypt-villus axis analysed) and RankΔVil females (n = 3/37) and age-matched lactating (L5) RankWT (n = 4/52) and RankΔVil dams (n = 4/62). Tissues were harvested 24 h after EdU administration. Each data point represents the measurements of the migration distance in individual crypt-villus axis (i) and the average distance per mouse (j). k, Representative images of jejunal organoids generated from RankWT and RankΔVil mice. Scale bars, 100 μm. l, Ratios of the number of jejunal organoids derived from RankWT and RankΔVil mice after prolonged culture in the presence of rmRANKL (50 ng/ml). The number of organoids was counted at each passage. The ratio of organoid numbers in the RankWT + RANKL group was normalized to control RankWT organoids, whereas the ratio of organoid numbers in the RankΔVil + RANKL group was normalized to untreated RankΔVil organoids. Data are from two independent experiments. n = 6 (RankWT), n = 6 (RankWT + RANKL), n = 6 (RankΔVil), n = 6 (RankΔVil + RANKL). m,n, Representative hematoxylin and eosin (H&E) stained images of the upper small intestine (left in m) and quantification of upper small intestinal villus lengths (right in m, n) in age matched wild type nulliparous females (n = 4 mice, n = 310 villi analysed), pregnant females (P18.5) (n = 4/272), lactating dams (L5, 5 days after delivery) (n = 4/212) and females 6 weeks after weaning of the offspring (n = 4/49). Scale bars, 100 μm. Each data point represents the length of individual villi (m) and average length per mouse (n). Data are mean ± s.e.m. *P < 0.05; **P < 0.01; ***P < 0.001; ****P < 0.0001; ns, not significant. Two-tailed Mann–Whitney U-test (e,f,h,j,n); One-way analysis of variance (ANOVA) with Tukey’s post hoc test (g,i,l,m). Source Data
Extended Data Fig. 8
Extended Data Fig. 8. The detailed characterization of the intestine in reproduction.
a, Daily food intake in wild type mice during pregnancy and lactation (n = 4). b, Body weights of wild type mice during pregnancy and lactation (n = 4). c,d, Crypt lengths (left) and villus height-to-crypt depth ratios (right) in nulliparous RankWT (n = 5 mice, n = 87 crypts, n = 88 villi analysed), nulliparous RankΔVil (n = 5/87/97), L5 RankWT (n = 4/88/79) and L5 RankΔVil (n = 5/116/134) females. Each data point represents the measurement of the crypt length and villus height/crypt depth ratio from individual villi (c) and the average value per mouse (d). These data were determined on images of the upper small intestine obtained by confocal microscopy. e, Average villus length per mouse from nulliparous and lactating germ-free C57BL6 mice in the indicated mice described in Fig. 3c. f, Quantification of small intestinal lengths (left) and small intestinal villus lengths (right) in age-matched wild-type nulliparous females in specific-pathogen free condition (SPF) (n = 11), females at weaning date mated with C57BL6/J (syngenic mating) in SPF (n = 10), females at weaning date mated with Balb/c (semiallogenic mating) in SPF (n = 9), nulliparous females in Germ-free condition (GF) (n = 9), females at weaning date mated with C57BL6/J (syngenic mating) in GF (n = 8), and females at weaning date mated with Balb/c (semiallogenic mating) in GF (n = 6). Each data point represents the measurement of the small intestinal length and villus length, and data are pooled from the indicated number of mice in each group. The number of measured villi; n = 240 (nulliparous mice, SPF), n = 200 (synergic mating, at weaning, SPF), n = 160 (semiallogenic mating, at weaning, SPF), n = 20 (nulliparous mice, Germ-free), n = 160 (synergic mating, at weaning, Germ-free), n = 80 (semiallogenic mating, at weaning, Germ-free). g, Average villus length per mouse in the indicated mice described in Fig. 3d. h, Average villus length per mouse from the indicated mice described in Fig. 3e. i, Representative whole mount images (hematoxylin staining) of mammary glands from lactating L5 females treated with DMSO or Cabergoline (5 mg/kg). Scale bars, 500 μm. j, Representative 3D images of upper small intestine in age matched nulliparous and lactating (L5) wild type females. DiD was used to reveal the morphology of the villus and crypt by labelling the cell membrane. Scale bars, 100 μm. k,l, Lengths, volumes and surface areas of villi measured in L5 RankWT (n = 5 mice, n = 91 villi analysed), L5 RankΔVil-Het (n = 3/97) and L5 RanklΔVil (n = 6/141) littermates. Each data point represents the length, volume, and surface area of individual villi (k) and average length per mouse. (l). m,n, Numbers of GP-2+ microfold (M) cells per Peyer’s patch from nulliparous RankWT (n = 5 mice, n = 26 Peyer’s patches analysed), nulliparous RankΔVil (n = 2/9), L5 RankWT (n = 5/33) and L5 RankΔVil (n = 5/18) females. GP-2+ M cells were determined on small intestinal sections using immunohistochemistry. Each data point represents the number of M cells per individual peyer patches (m) and average numer per mouse (n). o, Representative immunostaining of GP-2 in Peyer’s patch in the small intestine from nulliparous RankWT and RankΔVil females and age-matched L5 RankWT and RankΔVil. Scale bars, 50 μm. p, Representative immunostaining of GP-2 in the small intestinal villi from nulliparous females and lactating (L5) females. Paraffin sections were counterstained with hematoxylin. Scale bars, 50 μm. q, Representative immunostaining to detect RANKL-expressing cells in the subepithelial dome in Peyer’s patch in nulliparous females and lactating (L5) females. DAPI (blue) was used to image nuclei. Scale bars, 100 μm. r, Average villus length per mouse in the indicated mice described in Fig. 3f. Data are shown as mean ± s.e.m. *P < 0.05; **P < 0.01; ***P < 0.001; ****P < 0.0001; ns, not significant. One-way analysis of variance (ANOVA) with Tukey’s post hoc test (c,f,k,m); Two-tailed Mann–Whitney U-test (d,e,g,h,l,n,r). Source Data
Extended Data Fig. 9
Extended Data Fig. 9. Bulk RNA-seq profiling of the intestine from lactating mice.
a, Differential gene expression analysis of bulk RNA-seq data from intestinal epithelial cells isolated from L5 RankWT and L5 RankΔVil mice (n = 4 for each group). Normalized CPM values of selected anti-apoptotic, stem cell signature and BMP signalling genes are shown. b, Heat maps of differentially expressed genes (left) and KEGG pathway analysis of differentially expressed genes (right) comparing intestinal epithelial cells from L5 RankWT and L5 RankΔVil dams. The colour scale shows relative expression profiles. KEGG pathways overrepresented among up- and down-regulated differentially expressed genes (padj 0.05) are shown. c, KEGG pathway analysis for fat digestion and lipid absorption (mmu04975). The significantly upregulated genes in L5 lactating RankWT versus L5 RankΔVil dams are highlighted in red. Genes that were not differentialy expressed between the groups are highlighted in green. Permission to use this figure was obtained from KEGG. Data are mean ± s.e.m. *P < 0.05; **P < 0.01; ****P < 0.0001; ns, not significant. Two-sided DESeq2 Wald tests, adjusted with the Benjamini–Hochberg procedure (a). Source Data
Extended Data Fig. 10
Extended Data Fig. 10. Parenchymal RANKL drives intestinal villous expansion.
a,b, Representative immunostaining to detect RANKL expressing cells (arrows) in small intestinal cross-sections (Left in a). Sections were also stained for EpCAM to detect intestinal epithelial cells and PDGFRα to visualize subepithelial cells in villi. Scale bars, 25 μm. Quantification of RANKL positive cells per villus and 200 μm of crypt area from nulliparous RanklWT (n = 5 mice, n = 47 villi, n = 26 regions analysed) and RanklΔTwist2 (n = 3/9/23) mice and lactating (L5) RanklWT (n = 4/15/20) and RanklΔTwist2 (n = 3/11/12) mice (right in a, b). Each data point represents the measurements of numbers of RANKL+ cells per villi or 2 mm of crypt area (a) and the average number per mouse (b). c, Quantitative RT–PCR analyses to compare expression levels of Rankl in mesenchymal cultures derived from lamina propria. Data represent the relative expression of Rankl in recombinant mouse Prolactin (rmProlactin)-stimulated mesenchymal cells to control (no rmProlactin) mesenchymal cells (set at 1). rmProlactin stimulation was for 48 h. n = 3 (control), n = 3 (rmProlactin). d, Left panels, 3D reconstruction of small intestinal tissue from Twist2-Cre-tdTomato mice using confocal microscopy. Scale bars, 300 μm. Right panels, gating strategy to determine tdTomato-expression in mesenchymal cells from Twist2-Cre-tdTomato mice using FACS. e,f, Representative 3D reconstructions of small intestine from age-matched nulliparous RanklWT and RanklΔTwist2 and lactating (L5) RanklWT and RanklΔTwist2 dams. Grid spacing is 200 μm (upper in e). Villous length, volume and surface areas in nulliparous RanklWT (n = 4 mice, n = 49 villi analysed); nulliparous RanklΔTwist2 (n = 4/63); L5 RanklWT (n = 3/53); RanklΔTwist2 (n = 5/82) mice(lower in e, f). Each data point represents the measurements of length, volume and surface area of individual villi (e) and the average value per mouse. g,h, Lengths, volumes and surface areas of villi were measured in age matched L5 RanklWT (n = 3 mice, n = 53 villi analysed), L5 RanklΔTwist2-Het (n = 4/50) and L5 RanklΔTwist2 (n = 5/82) littermates, using confocal microscopy and 3D tissue reconstructions. Each data point represents the measurements of length, volume and surface area of individual villi (g) and the average value per mouse(h). i,j, Small intestinal images from age-matched nulliparous and lactating (L5) RanklWT and RanklΔCd4 littermates. Left: Representative H&E stained intestinal sections. Scale bars, 100 μm (left in i). Quantification of villus length in nulliparous RanklWT (n = 5 mice, n = 89 villi analysed) and RanklΔCd4 (n = 5/135) mice and L5 RanklWT (n = 3/106) and RanklΔCd4 (n = 7/403) mice (right in i, j). Each data point represents the measurements of length of individual villi (i) and the average value per mouse(j). k,l, Quantification of villus length in age-matched L5 RanklWT (n = 3 mice, n = 149 villi analysed) and RanklΔRorc (n = 2/148) mice, quantified from H&E cross sections. Each data point represents the measurements of length, volume and surface area of individual villi (k) and the average value per mouse(l). Data are mean ± s.e.m. *P < 0.05; ns, not significant. One-way analysis of variance (ANOVA) with Tukey’s post hoc test (a,e,g,i); Two-tailed Paired t-test (c); Two-tailed Mann–Whitney U-test (b,f,h,j); Two-tailed Student’s t-test (k). Source Data
Extended Data Fig. 11
Extended Data Fig. 11. Single-cell RNA-seq profiling of lamina propria cells in nulliparous and lactating mice.
a, Uniform manifold approximation and projection (UMAP) of 16,218 cells from nulliparous mice (6,822 cells) and lactating wild type mice (9,396 cells). Cells are colour-coded according to their cell-type annotation using unsupervised clustering. b, Heatmap representing scaled single-cell log-normalized expression of the top 300 differentially expressed genes for immune (left panel) and mesenchymal cell-types (right panel). Column annotation corresponds to cell-types (shown in the colour code as in panel a) and study conditions (nulliparous vs lactation L5). 200 cells per cell-type are represented after random downsampling. Genes of interest for each cell-type are indicated c, UMAP of Rankl-positive cells from age-matched nulliparous and L5 lactating littermate. Cell types are colour-coded as in a. d, Numbers of Rankl-positive and ratios of Rankl-positive CD4 T cells, CD8 T cells, ILC3 cells, and mesenchymal cells per total cell numbers from age-matched nulliparous and L5 lactating mice. Source Data
Extended Data Fig. 12
Extended Data Fig. 12. Metabolomic profiling of serum from nulliparous and lactating mice.
a,c, Levels of the indicated free fatty acids, triglycerides, and Vitamins (a) and free amino acids (c) in the serum from nulliparous RankWT (n = 7) and RankΔVil (n = 6) females and lactating (L8) RankWT (n = 6) and RankΔVil (n = 7) dams, measured by mass spectrometry. b, Levels of the indicated iron in the serum from nulliparous RankWT (n = 8) and RankΔVil (n = 8) females and lactating (L8) RankWT (n = 10) and RankΔVil (n = 8) dams, measured by a photometric colour test. Dots represent relative levels of individual data points normalized to nulliparous control females. Data are shown as mean ± s.e.m. *P < 0.05; **P < 0.01; ns, not significant. One-way analysis of variance (ANOVA) with Tukey’s post hoc test (a,b,c). Source Data
Extended Data Fig. 13
Extended Data Fig. 13. Metabolomic profiling of milk from nulliparous and lactating mice.
a-c, Levels of free fatty acids and triglycerides (a), Vitamins (b) and free amino acids (c) in the milk from lactating (L8) RankWT and RankΔVil dams (n = 6 for each group), measured by mass spectrometry. Collection of milk is described in Methods. Of note, some of the data are the same as shown in Fig. 5a. Dots represent relative levels of individual data points normalized to RankWT control females. Data are mean ± s.e.m. *P < 0.05; ns, not significant. Two-tailed Student’s t-test. Source Data
Extended Data Fig. 14
Extended Data Fig. 14. Transgenerational effects in the offspring of RankΔvil mothers.
a, Body weights of E18.5 male embryos of RankWT (n = 18) and RankΔVil (n = 13) females fed normal chow. b, Body weights of male offspring born to RankWT (n = 20) and RankΔVil (n = 23) dams fed normal chow. Mice were monitored from wk 1 to wk 24th after birth. Each data point represents one offspring mouse. c, Body weights of 3 wks old RankWT and RankHET offspring born to RankWT and RankΔVil dams. All pregnancies were syngeneic crosses with C57BL/6J males, thus the offspring of RankΔVil dams were either RankWT (Rankflox/WTVilcre−) (n = 8) or RankHet (Rankflox/WTVilcre+) (n = 6); both of these groups exhibit reduced body weights as compared to RankWT(Rankflox/WTVilcre−) offspring (n = 17) born to RankWT dams. Dots represent individual mice. d, Numbers of offspring from RankWT (n = 48) and RankΔVil (n = 54) dams. e, Body weights of male offspring born to RankWT (n = 18) and RankΔVil (n = 16) dams fed high fat diet (HFD). f,g, Oral glucose-tolerance test (f) and corresponding area under the curve (AUC) (g) in male (n = 10/8) offspring of RankWT and RankΔVil dams, fed normal chow for 25 wks. Box-and-whisker plots in g show the median (middle lines), interquartile range (boxes), and minimum to maximum values (whiskers) throughout. Data are mean ± s.e.m. *P < 0.05; **P < 0.01; ***P < 0.001; ****P < 0.0001; ns, not significant. Two-tailed Student’s t-test (a,d,g); Two-way ANOVA with Sidak’s multiple comparison (b); One-way analysis of variance (ANOVA) with Tukey’s post hoc test (c). Source Data
Extended Data Fig. 15
Extended Data Fig. 15. Characterization of stem cells in RANK–RANKL-stimulated human intestinal organoids.
a, Uniform manifold approximation and projection (UMAP) of 2,265 human intestinal epithelial cells. Data were taken from Fujii et al. . Cells are colour coded according to epithelial cell-type annotation based on unsupervised clustering. b, Violin plots show single cell log-normalized expression of RANK and RANKL in each intestinal cell-type. Each dot represents an individual cell. c, Quantitative RT–PCR analyses to compare expression levels of anti-apoptotic genes, stem cell signature genes, and BMP signalling genes in human duodenal organoids. Data represent the relative expression of the indicated genes in rhRANKL (500 ng/ml) stimulated duodenal organoids compared to control (no RANKL) organoids (set at 1). rhRANKL stimulation was for 12 and 96 h. n = 4 (control), n = 4 (RANKL). d, Representative images (left) and quantified areas (right) of human duodenal organoids cultured for 2 days without (control; n = 83) and with recombinant human RANKL (rhRANKL; 500 ng/ml; n = 54) in growth-factor-reduced medium (GFR medium) lacking EGF, IGF-1, and FGF-2. Scale bars, 100 μm. Each dot represents an organoid, assessed in three independent experiments. e, RANKL-induced proliferation of duodenal organoids. Organoids were left untreated (control) or treated with rhRANKL (500 ng/ml) and proliferation determined using the MTT assay. Each plot represents an MTT OD, pooled from two independent experiments. n = 20 (control), n = 20 (RANKL). f, Representative cell cycle FACS plots (left) and quantification of S-phase and subG1 + G1 entry (right) assessing EdU labelled human duodenal organoids cultured in GFR medium and stimulated with rhRANKL for 24 and 72 h. Dots represent individual organoids, assessed in three independent experiments. n = 14 (control, 24hrs), n = 16 (control, 72hrs), n = 18 (rmRANKL, 24hrs), n = 18 (rmRANKL, 72hrs). g, Representative images of anti-OLFM4 immunostaining (green) of human duodenal organoids cultured in GFR medium in the absence (control) and presence of rhRANKL (500 ng/ml) for 24 and 96 h. Organoids were counterstained with DAPI (blue) to detect nuclei and Phalloidin (magenta) to detect filamentous actin. Scale bars, 50 μm. h, Representative images of OLFM4+ stem cells in human intestinal organoids cultured in the presence of rhRANKL (500 ng/ml) without (control, DMSO solvent) or with the BMP inhibitor (BMPi) LDN193189 (1.6μM) for 96 hrs. Organoids were stained with DAPI (blue) to detect nuclei and Phalloidin to detect filamentous actin. Scale bars, 50 μm. i, Proposed function of RANK–RANKL in the small intestine during pregnancy and lactation. During pregnancy and lactation, RANK–RANKL signalling promotes intestinal stem cell proliferation and differentiation as well as intestinal cell survival, ultimately resulting in massive villous expansion. Villous expansion facilitates nutritional uptake, which is important for nourishment of offspring as well as their transgenerational metabolic health. The figure was created with BioRender.com. Data are mean ± s.e.m. **P < 0.01; ***P < 0.001; ****P < 0.0001; ns, not significant. Two-tailed Student’s t-test (c-f). More details on statistics and reproducibility can be found in the Methods. Source Data

References

    1. Arck, P. C. & Hecher, K. Fetomaternal immune cross-talk and its consequences for maternal and offspring’s health. Nat. Med.19, 548–556 (2013). - PubMed
    1. Napso, T., Yong, H. E. J., Lopez-Tello, J. & Sferruzzi-Perri, A. N. The role of placental hormones in mediating maternal adaptations to support pregnancy and lactation. Front. Physiol.9, 1091 (2018). - PMC - PubMed
    1. Costantine, M. M. Physiologic and pharmacokinetic changes in pregnancy. Front. Pharmacol.5, 65 (2014). - PMC - PubMed
    1. Reiff, T. et al. Endocrine remodelling of the adult intestine sustains reproduction in Drosophila. eLife4, e06930 (2015). - PMC - PubMed
    1. Ahmed, S. M. H. et al. Fitness trade-offs incurred by ovary-to-gut steroid signalling in Drosophila. Nature584, 415–419 (2020). - PMC - PubMed

MeSH terms

Substances

LinkOut - more resources