. 2025 Jan;637(8048):1207-1217.
doi: 10.1038/s41586-024-08290-3. Epub 2024 Dec 4.

Evolution of myeloid-mediated immunotherapy resistance in prostate cancer

Affiliations

Evolution of myeloid-mediated immunotherapy resistance in prostate cancer

Aram Lyu et al. Nature. 2025 Jan.

Abstract

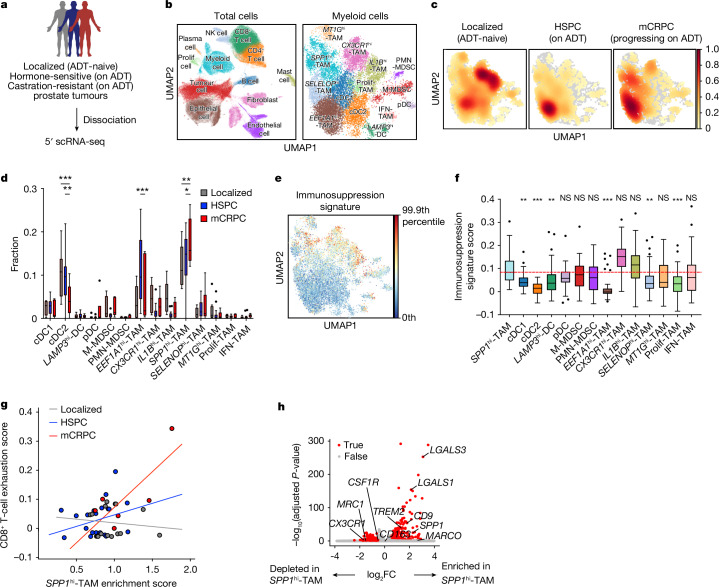
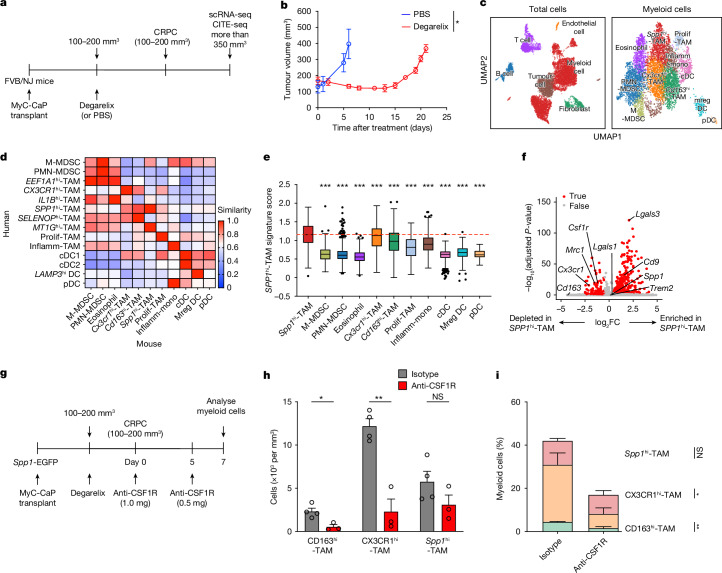
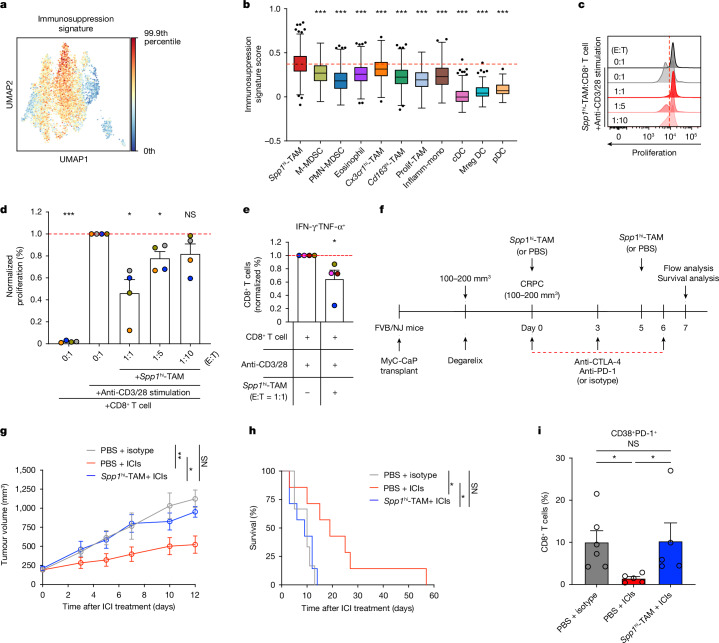
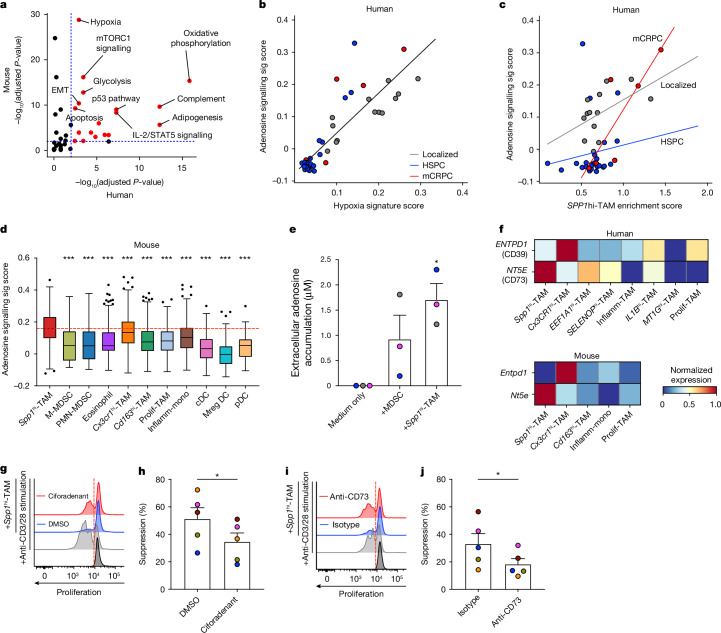
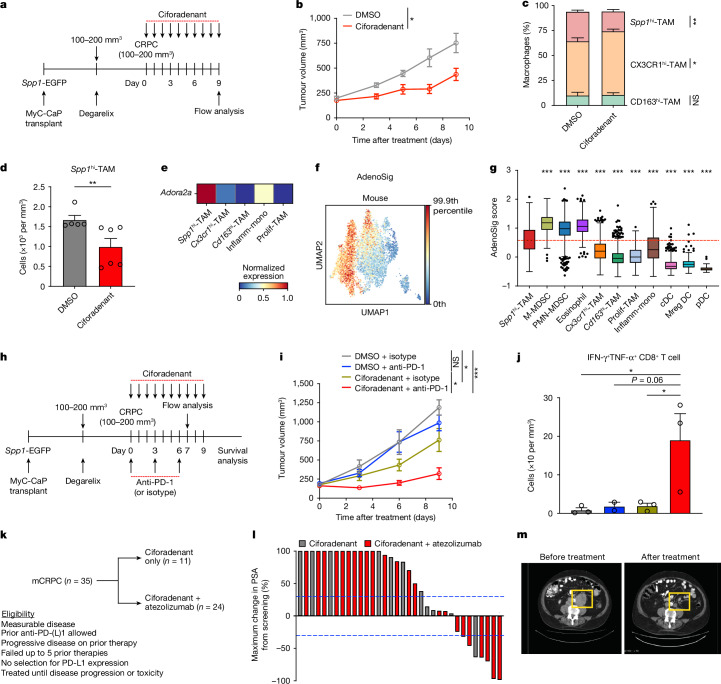
Patients with advanced metastatic castration-resistant prostate cancer (mCRPC) are refractory to immune checkpoint inhibitors (ICIs)1,2, partly because there are immunosuppressive myeloid cells in tumours3,4. However, the heterogeneity of myeloid cells has made them difficult to target, making blockade of the colony stimulating factor-1 receptor (CSF1R) clinically ineffective. Here we use single-cell profiling on patient biopsies across the disease continuum and find that a distinct population of tumour-associated macrophages with elevated levels of SPP1 transcripts (SPP1hi-TAMs) becomes enriched with the progression of prostate cancer to mCRPC. In syngeneic mouse modelling, an analogous macrophage population suppresses CD8+ T cell activity in vitro and promotes ICI resistance in vivo. Furthermore, Spp1hi-TAMs are not responsive to anti-CSF1R antibody treatment. Pathway analysis identifies adenosine signalling as a potential mechanism for SPP1hi-TAM-mediated immunotherapeutic resistance. Indeed, pharmacological inhibition of adenosine A2A receptors (A2ARs) significantly reverses Spp1hi-TAM-mediated immunosuppression in CD8+ T cells in vitro and enhances CRPC responsiveness to programmed cell death protein 1 (PD-1) blockade in vivo. Consistent with preclinical results, inhibition of A2ARs using ciforadenant in combination with programmed death 1 ligand 1 (PD-L1) blockade using atezolizumab induces clinical responses in patients with mCRPC. Moreover, inhibiting A2ARs results in a significant decrease in SPP1hi-TAM abundance in CRPC, indicating that this pathway is involved in both induction and downstream immunosuppression. Collectively, these findings establish SPP1hi-TAMs as key mediators of ICI resistance in mCRPC through adenosine signalling, emphasizing their importance as both a therapeutic target and a potential biomarker for predicting treatment efficacy.


Conflict of interest statement

Competing interests: L.F. has received research support from Roche/Genentech, Abbvie, Bavarian Nordic, Bristol Myers Squibb, Dendreon, Janssen and Merck; has served on the scientific advisory boards of Actym, Astra Zeneca, Bioatla, Bristol Myers Squibb, Daiichi Sankyo, Immunogenesis, Innovent, Merck, Merck KGA, Nutcracker, RAPT, Senti, Sutro and Roche/Genentech; and reports ownership interest in Actym, BioAtla, ImmunoGenesis, Nutcracker, RAPT, Senti and Therapaint. R.A.M. is an employee of Corvus Pharmaceuticals. E.M.V.A. has received research support from Novartis, BMS and Sanofi, and served on the scientific advisory boards of Tango Therapeutics, Genome Medical, Genomic Life, Enara Bio, Manifold Bio, Monte Rosa, Novartis Institute for Biomedical Research, Riva Therapeutics and Serinus Bio. The remaining authors declare no competing interests.

Figures

Fig. 1
Fig. 1. Single-cell assessment of biopsies from patients with prostate cancer reveals SPP1hi-TAMs with elevated immunosuppression programs prevalent in advanced disease stages.
a, Schematic illustration of 5′ scRNA-seq (10x Genomics) on tumours from patients with either ADT-naive localized prostate cancer (n = 13), metastatic hormone-sensitive prostate cancer on ADT (HSPC; n = 24) or mCRPC progressing on ADT (n = 6). b, UMAP plots showing cell types (left) and distinct myeloid subsets (right) in human prostate cancer. Prolif, proliferative. c,d, Density (c) and bar plots (d) depicting the quantification of myeloid-subset frequencies across disease progression, with localized disease (grey; n = 13), HSPC (blue; n = 24) and mCRPC (red; n = 6). Significant changes were observed for cDC2 (P < 0.001 for mCRPC versus localized; P = 0.002 for mCRPC versus HSPC), EEF1A1hi-TAM (P < 0.001 for mCRPC versus HSPC) and SPP1hi-TAM (P = 0.002 for mCRPC versus localized; P = 0.04 for mCRPC versus HSPC). e,f, UMAP (e) and bar plots (f) showing immunosuppression gene signature scores among myeloid cells in human prostate cancer (n = 43 samples). In d and f, boxes represent the inter-quartile range (IQR), with bars indicating 25% − 1.5 × IQR and 75% + 1.5 × IQR. Outliers beyond 1.5 × IQR are included. The median score for SPP1hi-TAMs is indicated in red. g, Correlations between SPP1hi-TAM enrichment and CD8+ T cell exhaustion scores across disease stages. The lines represent the best-fit lines; each patient sample is indicated by a circle. HSPC, P = 0.17, R = 0.291; mCRPC, P = 0.07, R = 0.780; localized, P = 0.66, R = −0.134. h, Differentially expressed genes (adjusted P < 0.05, absolute log2 fold change (|log2FC|) > 0.5) in SPP1hi-TAMs compared with other myeloid cells highlighted in red. Statistical significance was determined by ordinary two-way analysis of variance (ANOVA) with Sidak correction (d); Kruskal–Wallis test with Dunn’s correction (f); simple linear regression analyses (g); and Wilcoxon test with Benjamini–Hochberg correction (h).*P < 0.05, **P < 0.01, ***P < 0.001; NS, not significant. The illustration in a was created using BioRender (https://biorender.com).
Fig. 2
Fig. 2. Spp1hi-TAMs in mouse prostate cancer are identified through scRNA-seq and demonstrate resistance to CSF1R blockade.
a, Schematic of 5′ scRNA-seq (10x Genomics) and CITE-seq (cellular indexing of transcriptomes and epitopes by sequencing) on immune (CD45+) and non-immune (CD45) cells from mouse prostate cancer (MyC-CaP), subcutaneously engrafted on mice treated with degarelix or PBS. b, Cumulative MyC-CaP growth in mice, comparing degarelix-treated (red; n = 3) and PBS-treated (blue; n = 3) groups (P = 0.046). Symbols show mean ± s.e.m. c, UMAP plots showing the main cell types (left) and distinct myeloid subsets (right) in mouse prostate cancer. Prolif, proliferative; Inflamm, inflammatory; mono, monocytes. d, Heatmap comparing myeloid subset similarity scores between human (rows) and mouse (columns) prostate cancer. e, SPP1hi-TAM signature scores across myeloid cells (n = 6,397 cells) in mouse prostate cancer (P < 0.001 for comparisons of Spp1hi-TAM versus each subset). Enrichment scores were calculated using gene signatures in the patient dataset shown in Fig. 1. The red dashed line shows the median score for Spp1hi-TAMs for comparison. Boxes denote IQR; bars show 25% − 1.5 × IQR and 75% + 1.5 × IQR, with outliers exceeding 1.5 × IQR. f, Plot of differentially expressed genes (adjusted P-value < 0.05, |log2FC| > 0.5) (red), indicating enrichment or depletion in Spp1hi-TAMs versus other macrophages and monocytes. g, Schematic of anti-CSF1R or isotype-matched control antibody dosing in Spp1-EGFP mice after CRPC development, assessing myeloid composition 2 days after treatment. h,i, Quantification of cell number (h) and frequency (i) for macrophage subsets in CRPC mice treated with anti-CSF1R (n = 3) or isotype-matched control (n = 4) antibodies. Bars show mean + s.e.m. from 3 independent experiments; symbols represent individual mice. Significant changes were observed in CD163hi-TAM and CX3CR1hi-TAM populations (P = 0.02, P = 0.002 (h); P = 0.003, P = 0.03 (i), but not in Spp1hi-TAMs (P = 0.18, P = 0.30). Statistical significance was determined by two-sided unpaired Student’s t-tests (b,h,i), Kruskal–Wallis test with Dunn’s correction (e) and Wilcoxon test with Benjamini–Hochberg correction (f); *P < 0.05, **P < 0.01, ***P < 0.001; NS, not significant. Source Data
Fig. 3
Fig. 3. Spp1hi-TAMs have a critical role in promoting immunotherapeutic resistance by inducing exhaustion in CD8+ T cells in vivo.
a,b, UMAP (a) and bar plots (b) showing immunosuppression scores among myeloid cells in mouse prostate cancer (n = 6,397; P < 0.001 for comparisons of Spp1hi-TAM and other subsets). Boxes represent IQR and bars indicate 25% − 1.5 × IQR and 75% + 1.5 × IQR, with outliers beyond 1.5 × IQR. The red dashed line shows the median score for Spp1hi-TAMs. c, Flow-cytometry plots showing reduced proliferation of activated splenic CD8+ T cells 3 days after co-culturing with Spp1hi-TAMs from CRPC. d,e, Quantification of proliferating (P = 0.02, P = 0.04 and P = 0.14 for effector:target (E:T) ratios of 1:1, 1:5 and 1:10, respectively (d) and polyfunctional (IFN-γ+TNF-α+; P = 0.01) CD8+ T cells with and without Spp1hi-TAMs at various ratios (e). Results are normalized to activated T cells alone; mean + s.e.m. from n = 4 experiments, with different colours for each and symbols for averages of 2–3 replicate wells. Red dashed lines indicate the normalized mean frequency of activated CD8+ T cells. f, Dosing schedule for ICIs (anti-CTLA-4 + anti-PD-1) or isotype-matched controls after adoptive transfer of Spp1hi-TAMs or PBS into CRPC. g, CRPC growth curves for ICI or isotype treatments after Spp1hi-TAM or PBS transfer from n = 3 experiments (P = 0.002, P  =  0.02 and P  =  0.59 for PBS+isotype versus PBS + ICIs, PBS + ICIs versus Spp1hi-TAM + ICIs and PBS + isotype versus Spp1hi-TAM + ICIs, respectively); PBS + isotype, n = 6; PBS + ICIs, n = 7; Spp1hi-TAM + ICIs, n = 7. Symbols represent mean ± s.e.m. h, Survival curves from the same experiment as g (P = 0.023, P  =  0.013 and P  =  0.755). i, Exhausted (CD38+PD-1+) CD8+ T cell frequencies in CRPC after Spp1hi-TAMs or PBS transfer with or without ICIs, assessed 1 day after the final injection (P = 0.02, P  =  0.02, P   > 0.99). Bars show mean + s.e.m. from n = 3 experiments; symbols represent individual mice. Statistical significance was determined by Kruskal–Wallis tests with Dunn’s correction (b,i), two-sided one-sample t-tests (d,e), ordinary one-way ANOVA with Sidak correction (g) and log-rank tests (h); *P < 0.05, **P < 0.01, ***P < 0.001; NS, not significant. Source Data
Fig. 4
Fig. 4. SPP1hi-TAMs are hypoxic and mediate immunosuppression through adenosine signalling.
a, Enriched term clusters using differentially expressed genes (adjusted P-value < 0.05, |log2FC| > 0.5) in SPP1hi-TAMs versus other myeloid cells in humans and mice, using Enrichr with MSigDB Hallmark 2020 gene sets (blue dashed line at adjusted P = 0.05). b,c, Correlations between enrichment scores for hypoxia (P < 0.001, R = 0.858) (b) or SPP1hi-TAMs (c) and the adenosine signalling signature (sig) across patient samples with localized disease (grey, P = 0.08, R = 0.502), HSPC (blue, P = 0.54, R = 0.309) and mCRPC (red, P = 0.04, R = 0.839). Best-fit lines are shown, with symbols representing individual samples. d, Adenosine signalling signature scores in mouse prostate cancer myeloid cells (n = 6,397; P < 0.001 for Spp1hi-TAMs versus other subsets). Boxes denote IQR; bars indicate 25% − 1.5 × IQR and 75% + 1.5 × IQR, with outliers exceeding 1.5 × IQR. The red dashed line shows the median Spp1hi-TAM score. e, Extracellular adenosine accumulation by MDSCs or Spp1hi-TAMs after 1 day of culture, normalized to the background adenosine levels from medium without cells (P = 0.01). Bars show mean + s.e.m. from n = 3 experiments, with different colours for each and symbols for averages of 2 replicate wells. f, Heatmaps of normalized ENTPD1 and NT5E expression in TAMs and monocytes from human (top) and mouse (bottom) prostate cancers. g,h, Flow cytometry (g) and bar plots (h) showing increased CD8+ T cell proliferation with Spp1hi-TAMs and ciforadenant (an A2AR inhibitor; 10 μM) versus DMSO (P = 0.04). i,j, Flow cytometry (i) and bar plots (j) showing increased CD8+ T cell proliferation with Spp1hi-TAMs and anti-CD73 antibody (10 μg ml−1) versus isotype-matched control antibody (P = 0.04). In gj, bars show mean + s.e.m. from n = 5 independent experiments, each indicated by a different colour; symbols represent averages of 2–3 technical replicate wells. Statistical significance was determined by (Fisher’s exact and hypergeometric tests with Benjamini–Hochberg correction (a), simple linear regression analyses (b,c), a Kruskal–Wallis test with Dunn’s correction (d), two-sided one-sample t-tests (e) and two-sided paired Student’s t-tests (h,j); *P < 0.05, ***P < 0.001; NS, not significant. Source Data
Fig. 5
Fig. 5. Inhibition of adenosine signalling diminishes the abundance of Spp1hi-TAMs and enhances the responsiveness of CRPC to PD-1 blockade in vivo.
a, Schematic depicting the dosing schedule for ciforadenant (10 mg kg−1) or DMSO in CRPC mice. b, Cumulative CRPC growth after ciforadenant (n = 6) or DMSO (n = 5) treatment, compiled from n = 2 experiments; symbols show mean ± s.e.m. c,d, Quantification of macrophage subset frequency (c) and Spp1hi-TAM numbers (d) in CRPC treated with ciforadenant or DMSO from the same experiments as b; bars show mean + s.e.m.; symbols represent individual mice. e, Heatmap of normalized Adora2a expression (A2AR encoding) in macrophages and monocytes from mouse prostate cancer. f,g, UMAP (f) and bar plots (g) showing AdenoSig scores among myeloid cells in mouse prostate cancer (n = 6,397 myeloid cells; P < 0.001 for Spp1hi-TAM versus other subsets). Boxes denote IQR, and bars denote 25% − 1.5 × IQR and 75% + 1.5 × IQR, with outliers exceeding 1.5 × IQR. The red dashed line shows the median score for Spp1hi-TAMs. h, Schematic of ciforadenant (10 mg kg−1) treatment with and without anti-PD-1 (400 μg) treatment in CRPC mice. i, Cumulative CRPC growth after the treatments in h, compiled from n = 3 experiments; symbols represent mean ± s.e.m. DMSO + isotype, n = 7; DMSO + anti-PD-1, n = 6; ciforadenant + isotype, n = 7; ciforadenant + anti-PD-1, n = 6. j, Density of polyfunctional (IFN-γ+TNF-α+) CD8+ T cells in CRPC after the treatments in h. Each group is represented using the same colour scheme as in i. Bars show mean + s.e.m. from n = 3 experiments; symbols represent individual mice. k, Schematic showing the dosing schedule for ciforadenant (100 mg twice a day for 28 days) with or without atezolizumab (840 mg, once every two weeks) in patients with mCRPC. l, Waterfall plot of maximum prostate-specific antigen (PSA) change from screening in patients treated with ciforadenant either alone (grey) or with atezolizumab (red). m, Computed-tomography images showing tumour reduction in a clinical responder with measurable disease after the combination treatment. Statistical significance was determined by two-sided unpaired Student’s t-tests (b,c), a two-sided Mann–Whitney test (d), a Kruskal–Wallis test with Dunn’s correction (g) and an ordinary one-way ANOVA with Sidak correction (i,j); *P < 0.05, **P < 0.01, ***P < 0.001; NS, not significant. Source Data
Extended Data Fig. 1
Extended Data Fig. 1. Single-cell analysis of prostate cancer patient biopsies identifies diverse cell types including multiple myeloid subsets.
(a-b) Bubble plots showing the relative expression levels of signature genes for (a) the indicated major cell types and (b) myeloid subsets. (c-d) (c) UMAP plot showing the enrichment scores for published FOLR2+ macrophage signatures and (d) heatmap depicting the normalized expression levels of FOLR2, SELENOP, and SLC40A1 in the indicated myeloid subsets. (e) Representative RNAscope images of HSPC and mCRPC patient biopsy samples. Immunostaining for SPP1hi-TAMs (SPP1; white, CD68; turquoise, and DAPI; blue) is presented. Scale bars, 30 μm. (f) Quantitative comparison of MDSC (P = 0.004) and SPP1hi-TAM (P = 0.34) frequency between scRNA-seq analysis versus tissue imaging. Bars show mean + SEM; symbols represent individual patients. (g) Bubble plot showing the relative expression levels of signature genes associated with immunosuppression. Statistical significance was determined by (f) two-sided paired Student’s t-tests; P-values: **P < 0.01. ns, not significant.
Extended Data Fig. 2
Extended Data Fig. 2. CD8+ T cells exhibit significant exhaustion in mCRPC, coinciding with a notable increase in the abundance of SPP1hi-TAMs.
(a-b) UMAP plots showing (a) distinct T-cell subsets and (b) the relative expression levels of CD4 and CD8 transcripts across T cells in human prostate cancer. (c-d) Bubble plots depicting the relative expression levels of signature genes for (c) the indicated T-cell subsets and (d) exhaustion states in CD4+ or CD8+ T cells across different disease stages, as indicated. (e-f) Quantification of enrichment scores for (e) CD8+ T-cell exhaustion and (f) SPP1hi-TAMs across different disease stages, indicated by localized disease (n = 13), HSPC (n = 24), and mCRPC (n = 6) in gray, blue, and red, respectively. Boxes denote inter-quartile range (IQR), while bars denote 25% - 1.5 x IQR and 75% + 1.5 x IQR, with outliers exceeding 1.5 x the IQR beyond lower and upper quartiles. In (e), P = 0.96, 0.03, and 0.049 for localized vs. HSPC, localized vs. mCRPC, and HSPC vs. mCRPC, respectively. In (f), P = 0.51, 0.16, and 0.01 for localized vs. HSPC, localized vs. mCRPC, and HSPC vs. mCRPC, respectively. (g) UMAP plots showing the relative expression levels of CSF1R and MRC1 transcripts across myeloid cells in human prostate cancer. Statistical significance was determined by (e, f) ordinary one-way ANOVA with the Sidak correction; P-values: *<0.05. ns, not significant.
Extended Data Fig. 3
Extended Data Fig. 3. Single-cell analysis of mouse prostate cancer reveals diverse cell types including multiple myeloid subsets.
(a) Bubble plot showing the relative expression levels of signature genes for the indicated major cell types in mouse prostate cancer. (b) UMAP plots showing the relative expression levels of Cd68, Cd163, Itgax, and Csf3r transcripts (top) and the protein levels of F4/80, CD163, CD11c, and Ly-6G (bottom) across myeloid cells. (c) Bubble plot depicting the relative expression levels of signature genes for the indicated myeloid subsets. (d) UMAP plots showing the relative expression levels of Csf1r and Mrc1 transcripts across myeloid cells.
Extended Data Fig. 4
Extended Data Fig. 4. Flow cytometry analysis of the myeloid composition in MyC-CaP-derived HSPC and CRPC developed in Spp1-EGFP mice, and single-cell assessment of the myeloid landscape in TRAMP-C2.
(a) Experimental schematic depicting the evaluation of the myeloid compartment in CRPC developed in Spp1-EGFP mice following degarelix treatment. (b) Representative sequential gating schemes for evaluation of the indicated myeloid subsets in mice bearing CRPC. The initial plot is pre-gated on live, singlet, myeloid (CD11b+) cells. Sequential gating is indicated by arrows. (c-d) Quantification of the (c) number and (d) frequency of the indicated myeloid subsets from MyC-CaP engrafted into mice treated with degarelix (CRPC; red; n = 10) or PBS control (HSPC; blue; n = 8). In (c), P = 0.70, 0.02, 0.36, 0.02, and 0.84 for eosinophil, MDSC, CD163hi-TAM, CX3CR1hi-TAM, and Spp1hi-TAM, respectively. In (d), P = 0.11, 0.02, 0.70, 0.049, and 0.01 for eosinophil, MDSC, CD163hi-TAM, CX3CR1hi-TAM, and Spp1hi-TAM, respectively. Bars represent the mean + SEM from 4 independent experiments; symbols represent individual mice from each experiment. (e-f) (e) Representative flow cytometry plots and (f) quantification of cell surface CX3CR1 (left) or intracellular Spp1 (right) expression levels of the indicated macrophage subsets from CRPC (n = 11). Isotype control stains are in gray. In (f), P < 0.001 for all comparisons, except for Spp1-EGFP MFI between CD163hi-TAM and Spp1hi-TAM, where P = 0.002. Bars represent the mean + SEM from the same experiments as in (c, d); symbols represent individual mice from each experiment. (g) Bubble plot showing the relative expression levels of signature genes associated with immunosuppression. (h) Experimental schematic depicting 10x Genomics 5’ scRNA-seq on immune (CD45+) and non-immune (CD45-) cells isolated from mice subcutaneously engrafted with mouse prostate cancer, TRAMP-C2, followed by treatment with anti-PD-1 or isotype antibodies. (i) Graph shows the cumulative growth of TRAMP-C2 engrafted into healthy wild-type mice, where blue and gray represent groups treated with anti-PD-1 antibody (n = 6) and isotype antibody (n = 3), respectively. Symbols represent mean +/- SEM from 2 independent experiments. (j) UMAP plots showing major cell types (left) and distinct myeloid subsets (right) in TRAMP-C2. (k-l) Quantification of (k) signature scores for SPP1hi-TAMs across macrophages and monocytes (n = 9,460 cells) and (l) the frequency of Spp1hi-TAMs in TRAMP-C2 engrafted in mice treated with either anti-PD-1 or isotype control antibodies. In (k), P < 0.001 for all comparisons between Spp1hi-TAM vs. each indicated subset. Boxes denote IQR, while bars denote 25% - 1.5 x IQR and 75% + 1.5 x IQR, with outliers exceeding 1.5 x the IQR beyond lower and upper quartiles. In (l), bars show mean + SEM; symbols represent individual mice (P = 0.93). The red line indicates the median score of Spp1hi-TAMs. (m-n) (m) UMAP and (n) bar plots showing the quantification of immunosuppression gene signature scores among macrophages and monocytes in TRAMP-C2 (n = 9,460 cells). In (n), P < 0.001 for all comparisons between Spp1hi-TAM vs. each indicated subset. Boxes denote IQR, while bars denote 25% - 1.5 x IQR and 75% + 1.5 x IQR, with outliers exceeding 1.5 x the IQR beyond lower and upper quartiles. The red line indicates the median score of Spp1hi-TAMs. Statistical significance was determined by (c, d, l) two-sided unpaired Student’s t-tests, (f) repeated measures one-way ANOVA with the Sidak correction, (i) a log-rank test, and (k, n) Kruskal-Wallis tests with the Dunn’s correction; P-values: *<0.05, **P < 0.01, ***<0.001. ns, not significant.
Extended Data Fig. 5
Extended Data Fig. 5. Functional assays demonstrating the immune suppressive activity of myeloid cells in CRPC, and a significant increase in exhausted CD8+ T cells following the transfer of Spp1hi-TAMs combined with CTLA-4 and PD-1 blockade in vivo.
(a) Representative flow cytometry plots showing the purity of each myeloid subset after FACS sorting. Myeloid subsets were gated based on the strategy shown at the top, with sequential gating strategies indicated by arrows. (b) Quantification of the frequency of proliferating CD8+ T cells 3 days after co-culture with either MDSC (P = 0.04) or CX3CR1hi-TAMs (P = 0.03 and 0.14 for E:T = 1:1 and 1:5, respectively) FACS-isolated from CRPC at the indicated ratios. Results were normalized to cultures with activated T cells alone. Bars show the mean + SEM from 4 independent experiments, each indicated by a distinct color; symbols represent averages of 2-3 technical replicate wells. Red lines indicate the normalized mean frequency of activated CD8+ T cells cultured alone. (c) Representative flow cytometry plots showing a decrease in the frequency of polyfunctional (IFN-γ+TNF-α+) CD8+ T cells 3 days after co-culture with Spp1hi-TAMs at a 1:1 ratio from the same experiments as in Fig. 3e. (d) Graph depicting the cumulative growth of CRPC following treatment with anti-CTLA-4 +/- anti-PD-1 antibodies (P = 0.33, 0.49, and 0.04 for isotype vs. anti-CTLA-4, anti-PD-1, and anti-CTLA-4 + anti-PD-1, respectively). (e) Representative flow cytometry plots showing an increased frequency of exhausted (CD38+PD-1+) CD8+ T cells following the transfer of Spp1hi-TAMs in combination with anti-CTLA-4 and anti-PD-1 antibodies, from the same experiments as in Fig. 3i. Statistical significance was determined by (b) one sample t-tests, and (d) log-rank tests; P-values: *<0.05, ***<0.001. ns, not significant.
Extended Data Fig. 6
Extended Data Fig. 6. Evaluation of gene signatures related to adenosine signaling pathways across multiple cell types, including SPP1hi-TAMs, in human and mouse prostate cancers, and functional validation of the role of soluble factors in SPP1hi-TAM-mediated immunosuppression.
(a) UMAP plots showing enrichment scores for the “Hypoxia” gene signatures across myeloid cells in both human and mouse prostate cancers. (b) Heatmaps depicting the normalized expression levels of ADORA2A and ADORA2B transcripts in the indicated CD8+ T cells and NK cells across different disease stages in patients. (c) UMAP plots showing enrichment scores for the “Adenosine Signaling Sig” gene signatures across myeloid cells in both human and mouse prostate cancers. (d) Plots depict the correlations between enrichment scores for the gene signatures “cDC1” (left) or “EEF1A1hi-TAMs” (right) and enrichment scores for “Adenosine Signaling Sig” across different disease stages in patient samples. Localized disease, HSPC, and mCRPC are in gray, blue, and red, respectively. The best-fit lines are displayed, and individual patient samples are represented by circles. (e) Schematic illustration of transwell assays in which CD8+ T cells, with or without α-CD3/28 stimulation, are cultured in the presence or absence of FACS-isolated Spp1hi-TAMs in opposite chambers to determine whether Spp1hi-TAMs suppress T-cell proliferation via soluble factors. (f) Quantification of T-cell proliferation in the red-indicated chamber 3 days after culture initiation (P = 0.02, 0.002, and <0.001 for comparisons between the left vs. middle, middle vs. right, and left vs. right, respectively, as shown in the schematic in (e)). Results were normalized to the proliferation of activated T cells cultured alone in the top chamber of the inserts within each experiment. Bars show the mean + SEM from 3 independent experiments, each indicated by a distinct color; symbols represent averages of 2-3 technical replicate wells. Red lines indicate the normalized mean of activated CD8+ T cells cultured alone. (g) UMAP plot showing enrichment scores for the “Adenosine Signaling Sig” gene signatures across major cell types in patients. (h) Heatmap depicting the normalized expression levels of ENTPD1, NT5E, and CD38 transcripts in the indicated major cell types in patients. (i) Heatmaps depicting the normalized expression levels of CD38 transcripts in the indicated myeloid subsets both in humans and mice. (j) Heatmaps depicting the normalized expression levels of ENTPD1 and NT5E transcripts in the indicated tumor-associated macrophages across different disease stages in patients. Statistical significance was determined by (d) simple linear regression analyses, and (f) a repeated measures one-way ANOVA with the Sidak correction; P-values: *<0.05, **P < 0.01, ***<0.001. ns, not significant.
Extended Data Fig. 7
Extended Data Fig. 7. Assessment of CD39 and CD73 levels in Spp1hi-TAMs in mouse prostate cancer, and investigation of the role of the IL-1R pathway in immunosuppression mediated by SPP1hi-TAMs both in humans and mice.
(a) Heatmap depicting the normalized expression levels of Entpd1 and Nt5e transcripts in the indicated tumor-associated macrophages and monocytes across different disease stages in mice. (b-c) (b) Representative flow cytometry plots and (c) quantification of fold changes in the levels of cell surface CD73 expressed on Spp1hi-TAMs from CRPC relative to HSPC. HSPC, CRPC, and isotype control stains are shaded in blue, red, and gray, respectively in (b). In (c), P = 0.35, 0.01, and 0.01 for CD163hi-TAM, CX3CR1hi-TAM, and Spp1hi-TAM, respectively. Bars represent the mean + SEM from 4 independent experiments, each indicated by a distinct color; symbols represent individual mice from each experiment. The red line indicates a fold change of 1. (d) Pathways associated with inflammation, significantly enriched in SPP1hi-TAMs compared to other myeloid cells in both human (red) and mouse (gray) prostate cancers, were identified using the Enrichr bioinformatics tool with GO Biological Process 2023 gene sets. (e) UMAP plots showing enrichment scores for the “Tumor-promoting Inflammation” gene signatures across myeloid cells in both human and mouse prostate cancers. (f) Plot depicting the correlation between enrichment scores for the gene signatures “SPP1hi-TAMs” and enrichment scores for “Tumor-promoting Inflammation Sig” across different disease stages in patient samples. Localized disease, HSPC, and mCRPC are in gray, blue, and red, respectively. The best-fit line is displayed, and individual patient samples are represented by circles. (g) Bar plots showing decreased suppression of activated splenic CD8+ T cells when co-cultured with Spp1hi-TAMs in the presence of an anti-IL-1R antibody (10 μg/ml) compared to isotype-treated cultures (P = 0.01). Bars show mean + SEM from 3 independent experiments, each indicated by a distinct color; symbols represent averages of 2-3 technical replicate wells. (h) Bar plots showing the percentage change in suppression of activated splenic CD8+ T cells mediated by Spp1hi-TAMs in the presence of either ciforadenant (a A2AR inhibitor; 10 μM), anti-IL-1R antibody, or a combination of both. Bars show mean - SEM from 3 independent experiments, each indicated by a distinct color; symbols represent averages of 2-3 technical replicate wells. Statistical significance was determined by (c, g) two-sided one sample t-tests, (d) Fisher’s exact tests or the hypergeometric tests with the Benjamini-Hochberg correction, and (f) simple linear regression analysis; P-values: *<0.05. ns, not significant.
Extended Data Fig. 8
Extended Data Fig. 8. Evaluation of the lymphoid and myeloid compartments in CRPC treated with ciforadenant or DMSO control.
(a) Quantification of the frequency (left) or number (right) of CD8+ T cells in CRPC developed in mice treated with ciforadenant (10 mg/kg; n = 6) or DMSO vehicle control (n = 5) from the same experiments as in Fig. 5b. (b-c) (b) Representative flow cytometry plots and (c) quantification of the frequency of CD8+ T cells exhibiting exhaustion states (CD38+PD-1+) from the same experiments as in Fig. 5b (P = 0.01). (d) Quantification of the number of the indicated major myeloid subsets from the same experiments as in Fig. 5b. (e) Representative immunofluorescent images of Spp1hi-TAMs in CRPC developed in either Spp1-EGFP negative (left) or positive mice treated with either DMSO (middle) or ciforadenant (right). Immunostaining for F4/80 (turquoise), Spp1 (magenta), and DAPI (blue) is shown. Scale bars, 10 μm. White arrows indicate Spp1hi-TAMs. (f) Quantification of the frequency of Spp1hi-TAMs in CRPC developed in mice treated with ciforadenant or DMSO vehicle control (P < 0.001). (g) Quantification of the number of the indicated macrophage subsets in CRPC developed in mice treated with ciforadenant or DMSO vehicle control from the same experiments as in Fig. 5b. (h) UMAP plot showing enrichment scores for the “AdenoSig” gene signatures across myeloid cells in human prostate cancer. (i) Plot depicts the correlations between enrichment scores for the gene signatures “SPP1hi-TAMs” and “AdenoSig” in patient samples. Localized disease, HSPC, and mCRPC are in gray, blue, and red, respectively. The best-fit line is displayed, and individual patient samples are represented by circles. Bars represent the mean + SEM throughout this figure; symbols represent individual mice. Statistical significance was determined by (a, c, d, f, g) two-sided unpaired Student’s t-tests, and (i) a simple linear regression analysis; P-values: *<0.05, ***<0.001. ns, not significant.
Extended Data Fig. 9
Extended Data Fig. 9. Assessment of lymphoid and myeloid compartments in CRPC following treatment with ciforadenant +/− anti-PD-1 antibody.
(a-b) (a) Representative flow cytometry plots and (b) quantification showing an increase in the frequency of polyfunctional (IFN-γ+TNF-α+) CD8+ T cells following ciforadenant treatment with or without anti-PD-1 antibody, from the same experiments as in Fig. 5j. (c-d) Quantification of the frequency of (c) CD4+ T cells, CD8+ T cells, NK cells, and (d) Spp1hi-TAMs in CRPC developed in Spp1-EGFP mice treated with ciforadenant +/− anti-PD-1 antibody. Treatment groups are indicated as follows: DMSO + isotype antibody (gray; n = 3), DMSO + anti-PD-1 antibody (blue; n = 2), ciforadenant + isotype antibody (olive green; n = 3), and ciforadenant + anti-PD-1 antibody (red; n = 3) (P = 0.049, 0.03, and 0.99 for comparisons between DMSO + isotype vs. ciforadenant + isotype, DMSO + isotype vs. ciforadenant + anti-PD-1, and ciforadenant + isotype vs. ciforadenant + anti-PD-1, respectively). Bars represent the mean + SEM throughout this figure; symbols represent individual mice. Statistical significance was determined by (d) ordinary one-way ANOVA with the Sidak correction; P-values: *<0.05. ns, not significant.
Extended Data Fig. 10
Extended Data Fig. 10. Clinical characteristics of the trial evaluating adenosine receptor blockade with ciforadenant +/− PD-L1 blockade using atezolizumab in mCRPC patients, and assessment of biopsies from responders and non-responders.
(a) Patient characteristics from the clinical trial as shown in Fig. 5k. (b) Treatment emergent adverse effects observed in the patients. (c) Representative immunofluorescent images of baseline biopsy samples from responders and non-responders in the clinical trial. Immunostaining for EpCAM (green), PD-L1 (magenta), CD68 (yellow), and DAPI (blue) is presented. Scale bars, 200 μm. (d) Representative images of SPP1hi-TAMs in the same samples as in (c). Immunostaining for CD4 (red), CD8 (light green), SPP1 transcripts (white), CD68 transcripts (turquoise), and DAPI (blue) is presented. Scale bars, 30 μm. (c) and (d) represent data from one responder and two non-responders, which were the only samples available from this trial.

Comment in

References

    1. Beer, T. M. et al. Randomized, double-blind, phase III trial of ipilimumab versus placebo in asymptomatic or minimally symptomatic patients with metastatic chemotherapy-naive castration-resistant prostate cancer. J. Clin. Oncol.35, 40–47 (2017). - PubMed
    1. Powles, T. et al. Atezolizumab with enzalutamide versus enzalutamide alone in metastatic castration-resistant prostate cancer: a randomized phase 3 trial. Nat. Med.28, 144–153 (2022). - PMC - PubMed
    1. Martori, C. et al. Macrophages as a therapeutic target in metastatic prostate cancer: a way to overcome immunotherapy resistance? Cancers14, 440 (2022). - PMC - PubMed
    1. Koinis, F. et al. Myeloid-derived suppressor cells in prostate cancer: present knowledge and future perspectives. Cells11, 20 (2021). - PMC - PubMed
    1. Siegel, R. L., Miller, K. D., Wagle, N. S. & Jemal, A. Cancer statistics, 2023. CA Cancer J. Clin.73, 17–48 (2023). - PubMed

MeSH terms

Substances