. 2025 Jan;637(8045):402-411.
doi: 10.1038/s41586-024-08307-x. Epub 2024 Dec 4.

Fetal hepatocytes protect the HSPC genome via fetuin-A

Affiliations

Fetal hepatocytes protect the HSPC genome via fetuin-A

Xiao-Lin Guo et al. Nature. 2025 Jan.

Erratum in

  • Author Correction: Fetal hepatocytes protect the HSPC genome via fetuin-A.
    Guo XL, Wang YD, Liu YJ, Chu L, Zhu H, Hu Y, Wu RY, Xie HY, Yu J, Li SP, Xiong CY, Li RY, Ke F, Chen L, Chen GQ, Chen L, Bai F, Enver T, Li GH, Li HF, Hong DL. Guo XL, et al. Nature. 2025 Mar;639(8053):E3. doi: 10.1038/s41586-025-08714-8. Nature. 2025. PMID: 39966683 Free PMC article. No abstract available.

Abstract

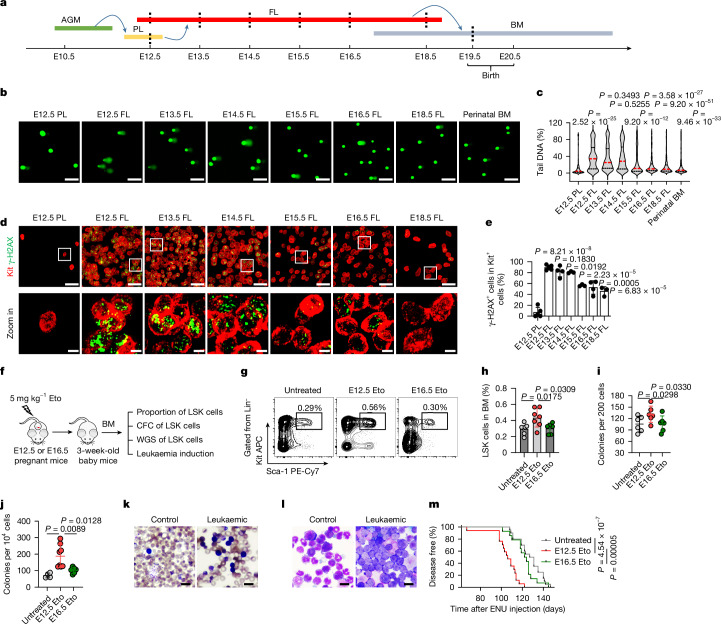
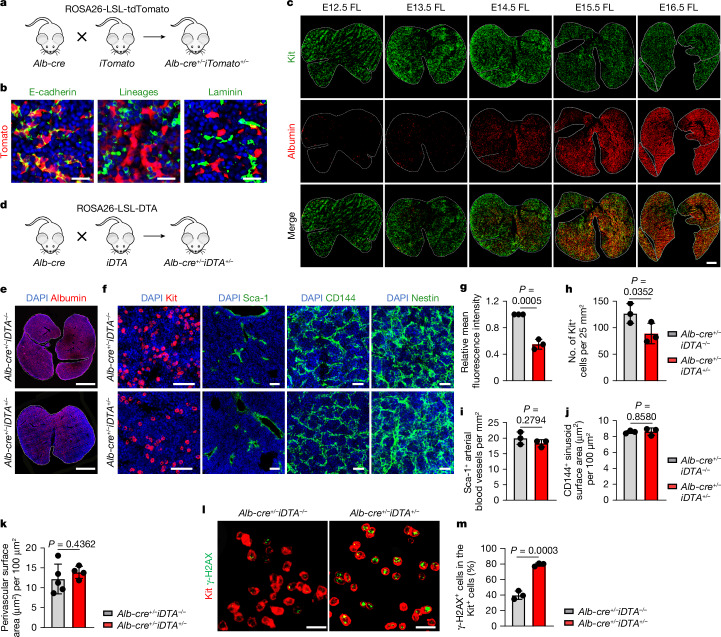
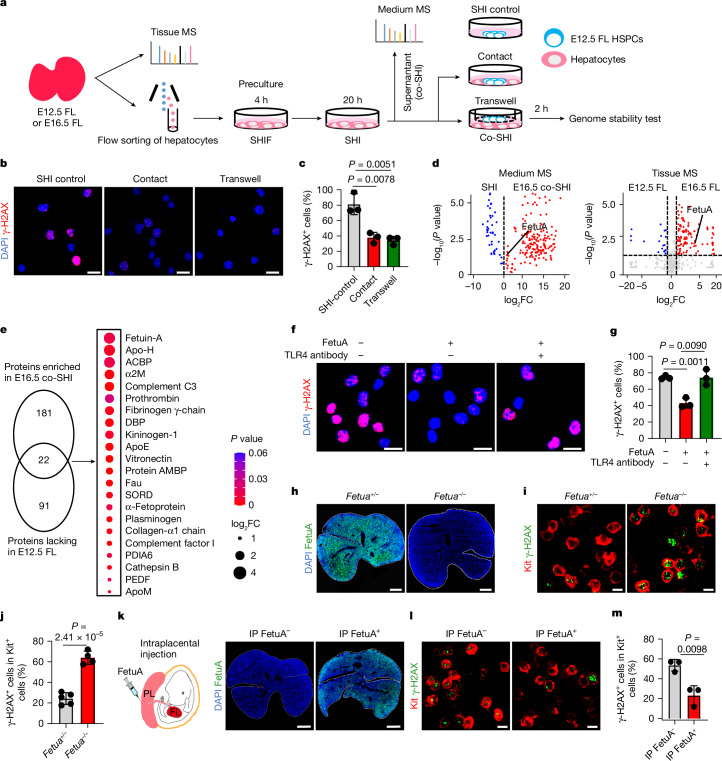
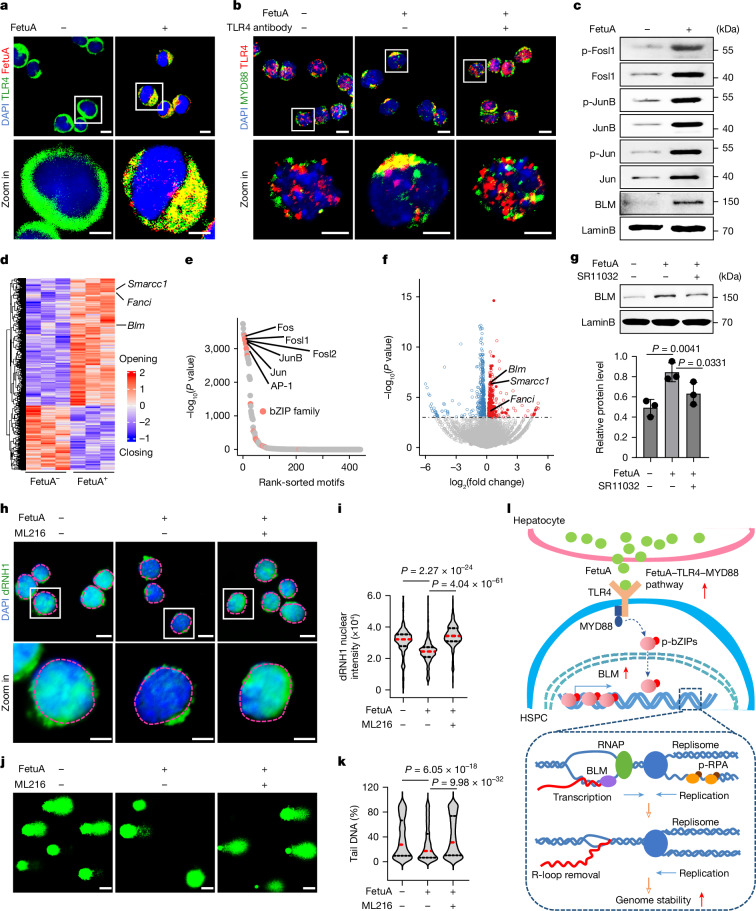
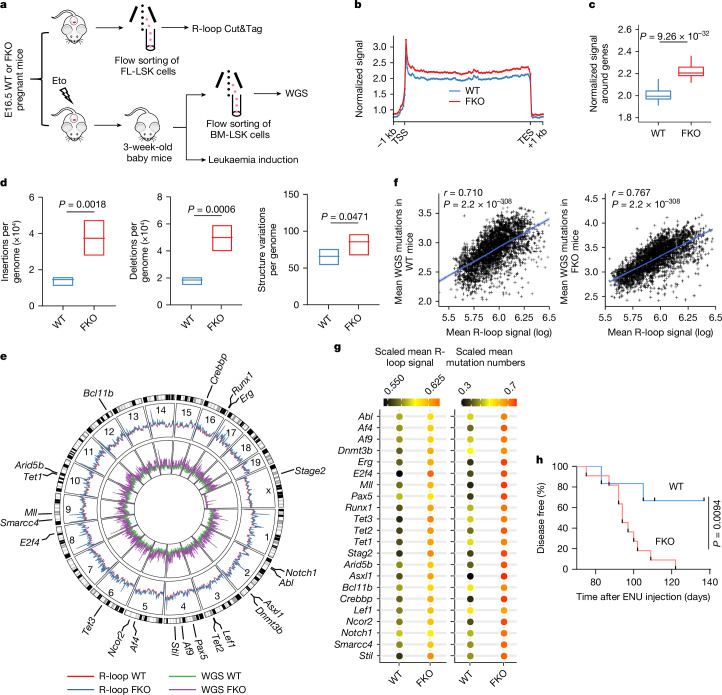
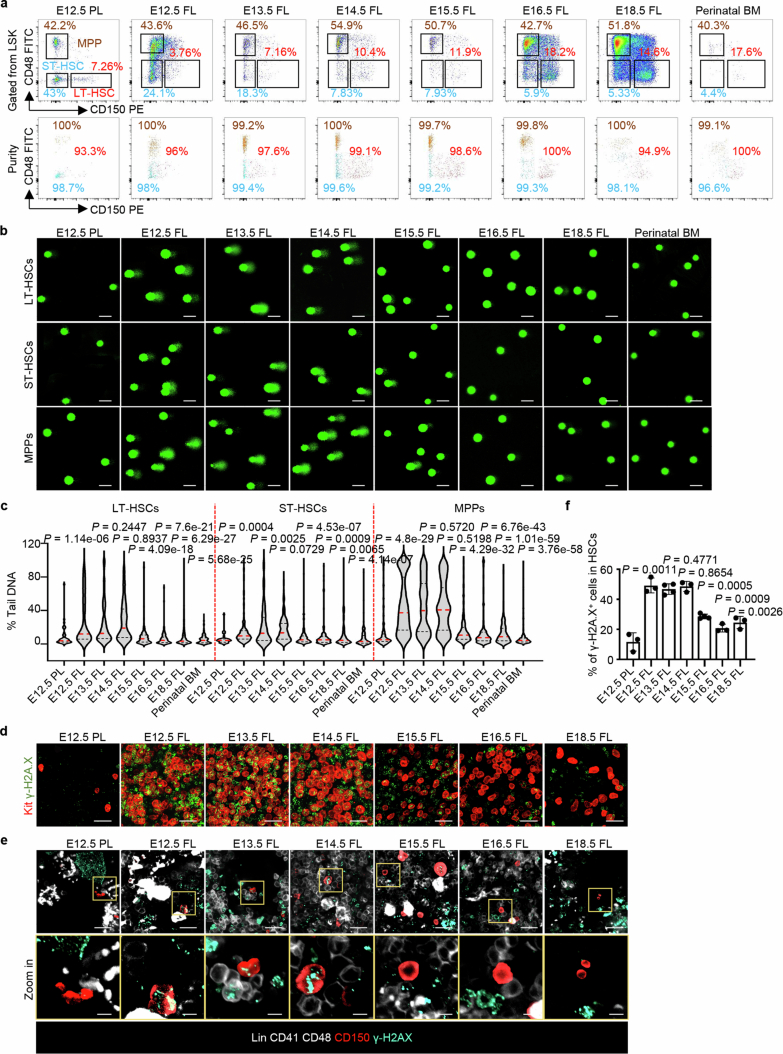
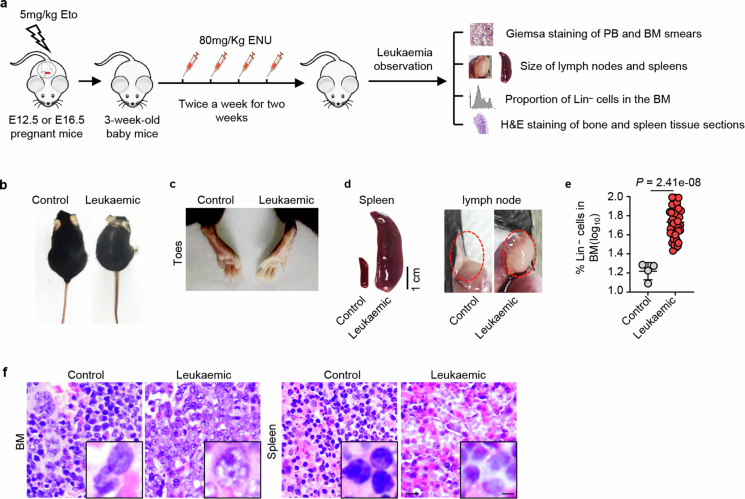
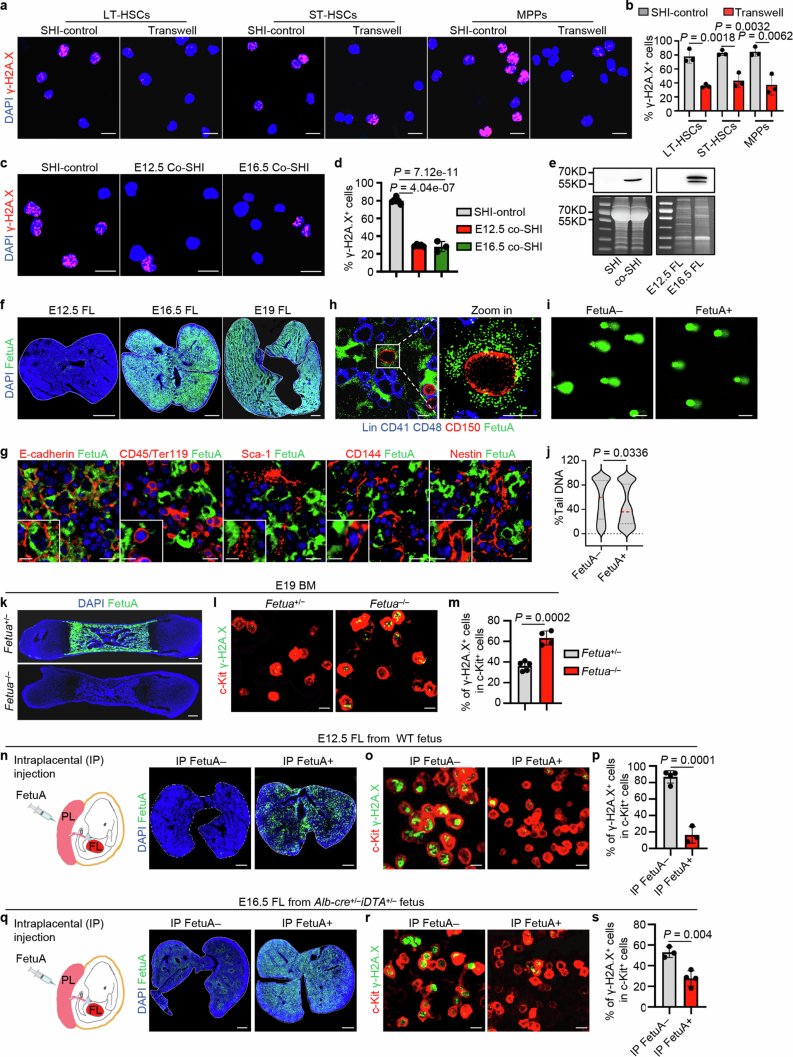
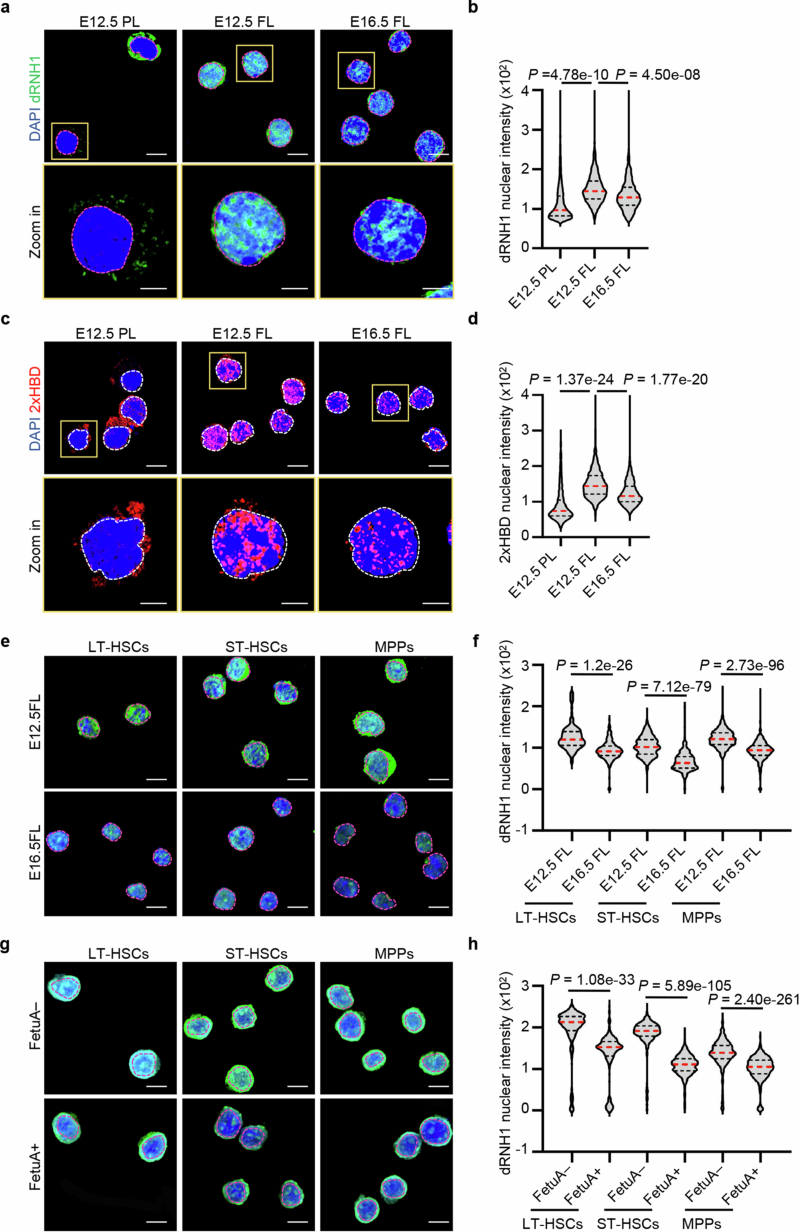
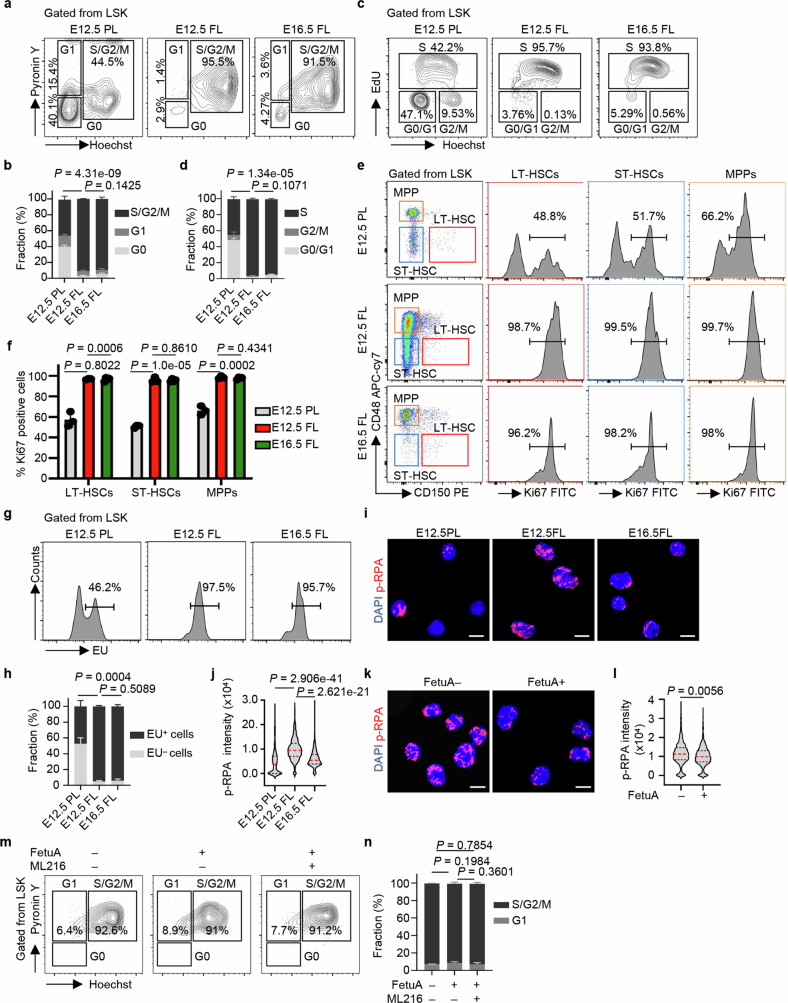
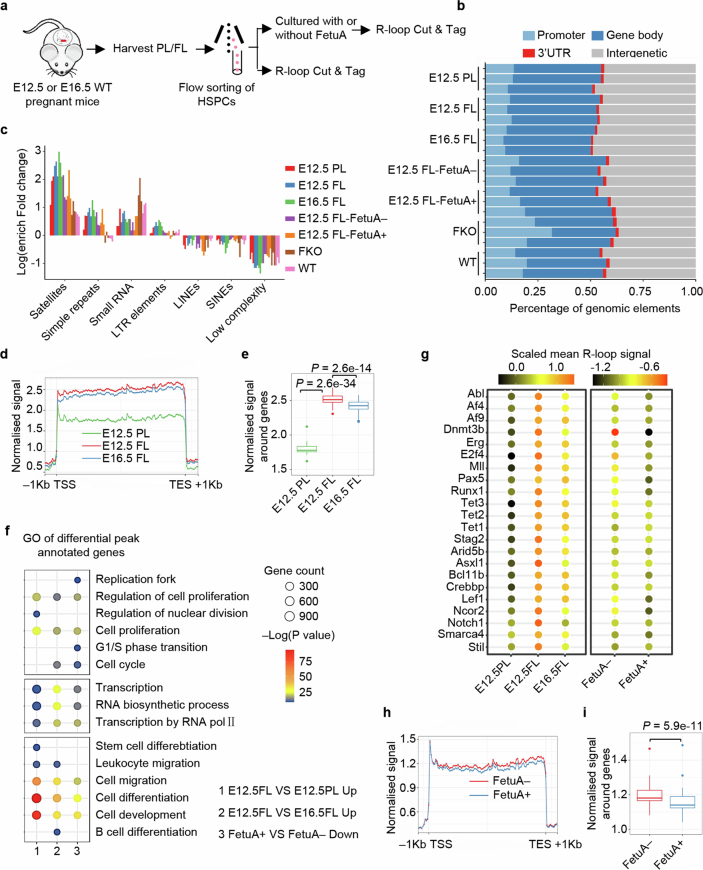
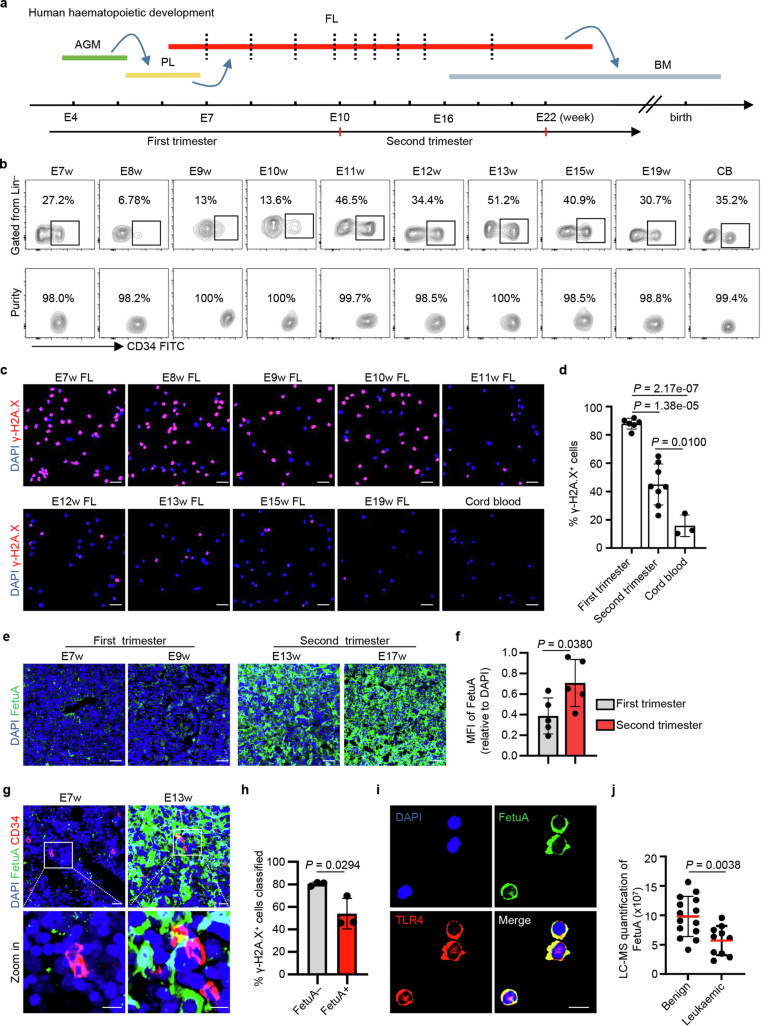
The maintenance of genomic integrity in rapidly proliferating cells is a substantial challenge during embryonic development1-3. Although numerous cell-intrinsic mechanisms have been revealed4-7, little is known about genome-protective effects and influences of developmental tissue microenvironments on tissue-forming cells. Here we show that fetal liver hepatocytes provide protection to haematopoietic stem and progenitor cell (HSPC) genomes. Lineage tracing and depletion in mice demonstrated that delayed hepatocyte development in early fetal livers increased the chromosomal instability of newly colonizing HSPCs. In addition, HSPCs developed tolerance to genotoxins in hepatocyte-conditioned medium, suggesting that hepatocytes protect the HSPC genome in a paracrine manner. Proteomic analyses demonstrated the enrichment of fetuin-A in hepatocyte-conditioned medium but not in early fetal livers. Fetuin-A activates a Toll-like receptor pathway to prevent pathogenic R-loop accumulation in HSPCs undergoing DNA replication and gene transcription in the fetal liver. Numerous haematopoietic regulatory genes frequently involved in leukaemogenic mutations are associated with R-loop-enriched regions. In Fetua-knockout mice, HSPCs showed increased genome instability and susceptibility to malignancy induction. Moreover, low concentrations of fetuin-A correlated with the oncogenesis of childhood leukaemia. Therefore, we uncover a mechanism operating in developmental tissues that offers tissue-forming cell genome protection and is implicated in developmental-related diseases.


Conflict of interest statement

Competing interests: The authors declare no competing interests.

Figures

Fig. 1
Fig. 1. HSPC genomes are unstable in the early fetal liver.
a, Mouse haematopoietic development and tissue harvesting of HSPCs (dashed lines) for the assessment of genome stability. AGM, aorta–gonad–mesonephros; BM, bone marrow; FL, fetal liver; PL, placenta. b,c, Representative comet-tail DNA images (b) and proportions (c) induced by etoposide (Eto) in HSPCs (n = 3). The medians (red dashed lines) and quartiles (black dashed lines) are shown. Scale bars, 50 µm. d,e, Representative in situ fluorescence images (d) and positive proportions (e) of γ-H2AX in Kit+ HSPCs in whole-mount tissues after in vivo Eto treatment (n = 5 for the E12.5 placenta and E12.5 fetal liver; n = 4 for the E13.5 fetal liver and E16.5 fetal liver; and n = 3 for the E14.5 fetal liver, E15.5 fetal liver and E18.5 fetal liver). Scale bars, 30 µm and 5 µm. The white squares represent the areas enlarged in the bottom row. f, The assessment of alterations caused by Eto treatment. CFC, colony-forming cell; WGS, whole-genome sequencing. g,h, Representative flow cytometry images (g) and proportions (h) of 3-week-old bone marrow LSK cells (n = 7 for untreated and E12.5 Eto; and n = 6 for E16.5 Eto). i,j, Plating (i) and replating (j) CFC assays of 3-week-old bone marrow LSK cells (n = 6 per group (i); n = 4 for untreated, n = 8 for E12.5 Eto and n = 6 for E16.5 Eto (j)). k,l, Representative Giemsa-stained images of peripheral blood (k) and bone marrow (l) smears (n = 7 for control and n = 31 for leukaemic (k); n = 7 for control and n = 13 for leukaemic (l)). Scale bars, 100 μm. m, Onset of leukaemia induced in mice (n = 20 for untreated, n = 17 for E12.5 Eto and n = 14 for E16.5 Eto). The n represents independent experiments (b,c), individual fetuses (d,e), mice (g,h,km) and dishes (i,j) from three independent experiments. The mean ± s.d. is shown (e,hj). Unpaired two-sided Student’s t-test (c,e,h,j), unpaired one-sided Student’s t-test (i) and log-rank (Mantel–Cox) test (m) were used. Source Data
Fig. 2
Fig. 2. HSPCs lack hepatocyte refuge in the early fetal liver.
a, The strategy of hepatocyte tracing using Alb-Cre;ROSA26-LSL-tdTomato mice. b, Alb-expressing cells (red) coexpressed the epithelial marker E-cadherin but not the haematopoietic cell lineage markers (CD3, B220, Gr-1, Mac-1 and Ter119) or the endothelial and mesenchymal marker laminin (n = 3). Scale bars, 25 µm. c, Representative fluorescence images showing tomato fluorescent protein-labelled hepatocytes and HSPCs (Kit (green)) in the developing fetal liver (n = 3). Scale bar, 500 µm. d, The strategy of hepatocyte depletion using Alb-Cre;ROSA26-LSL-DTA mice. e,g, Representative fluorescence images (e) and mean fluorescence intensity (g) of albumin red in the E16.5 fetal liver of Alb-cre+/–iDTA−/− and Alb-cre+/–iDTA+/− mice (n = 3). Scale bars, 1 mm. f,hk, Representative fluorescence images (f) and the numbers of Kit+ cells (h), the arterial blood vessels (Sca-1+; i), the sinusoid surface area (CD144+; j) and the perivascular surface area (Nestin+; k) in the E16.5 fetal liver of Alb-cre+/–iDTA+/− and Alb-cre+/–iDTA−/− mice (n = 3; n = 5 for Alb-cre+/–iDTA−/−; n = 4 for Alb-cre+/–iDTA+/− (hk)). Scale bars, 25 µm and 100 µm. l,m, Representative fluorescence images (l) and positive cell proportions (m) of γ-H2AX in Kit+ HSPCs in the E16.5 fetal liver from Alb-cre+/–iDTA+/− and Alb-cre+/–iDTA−/− mice after Eto treatment in vivo (n = 3). Scale bars, 20 µm. The n represents independent experiments (b,c) and individual fetuses from three independent experiments (em). The mean ± s.d. is shown (gk,m). Unpaired one-sided Student’s t-test (h) and unpaired two-sided Student’s t-test (g,ik,m) were used. Source Data
Fig. 3
Fig. 3. Hepatocyte-paracrine FetuA protects the HSPC genome.
a, Mechanistic investigation of the effect of hepatocytes on HSPCs. SHIF, SHI and co-SHI are culture media (see Methods). MS, mass spectrometer. b,c, Representative fluorescence images (b) and positive proportions (c) of γ-H2AX Eto induced in E12.5 fetal liver HSPCs in culture (n = 3). Scale bars, 20 µm. d, Volcano plots showing proteins in the media (n = 3 for SHI and n = 4 for co-SHI) and secretory proteins in fetal liver tissues (n = 4). The vertical dashed lines indicate the fold change (FC) threshold (log2FC = 0, log2FC > 1 or log2FC < −1), and the horizontal dashed line indicates the P value threshold (P = 0.05). e, Venn diagram showing proteins enriched in E16.5 co-SHI and lacking in the E12.5 fetal liver (more than twofold change, P < 0.05). The bubble chart and colours show the fold change and P values for the comparison between the E12.5 and E16.5 fetal liver. f,g, Representative fluorescence images (f) and positive proportions (g) of γ-H2AX Eto induced in HSPCs with or without FetuA and TLR4 antibodies in culture (n = 3). Scale bars, 20 µm. h, Representative fluorescence images of FetuA in the E16.5 fetal liver of Fetua+/– or Fetua–/– mice. Scale bars, 500 µm. i,j, Representative fluorescence images (i) and positive proportions (j) of γ-H2AX in Kit+ HSPCs in the E16.5 fetal liver Eto induced in Fetua+/– or Fetua–/– mice (n = 5 for Fetua+/– and n = 4 for Fetua–/–). Scale bars, 10 µm. km, Representative fluorescence images of FetuA (k) or γ-H2AX (l) and its positive proportions (m) in Kit+ HSPCs in the E16.5 fetal liver Eto induced in Fetua–/– mice with or without FetuA (n = 3). Scale bars, 500 µm (k) and 10 µm (l). IP, intraplacental. The n represents individual samples (bg) and fetuses (hm) from three (b,c,fm) or four (d) independent experiments. The mean ± s.d. is shown (c,g,j,m). Unpaired two-sided Student’s t-test (ce,g,j,m) was used. Source Data
Fig. 4
Fig. 4. FetuA activates the TLR4 pathway to prevent R-loop accumulation.
a, Representative fluorescence images of FetuA and TLR4 on E12.5 fetal liver HSPCs with or without FetuA treatment. Scale bars, 10 µm and 5 µm. The white squares represent the areas enlarged in the bottom row. b, Representative fluorescence images of TLR4 and MYD88 on HSPCs cultured with or without FetuA and TLR4 antibodies. Scale bars, 10 µm and 5 µm. c, Western blots of bZIPs (Fosl1, JunB and Jun), their phosphorylated (p) forms and BLM in E12.5 fetal liver HSPCs cultured with or without FetuA. d, ATAC-seq analysis of E12.5 fetal liver HSPCs with or without FetuA treatment, showing the differential opening and closing peaks and R-loop regulatory genes Smarcc1, Fanci and Blm. e, DNA-binding factors whose motifs were enriched in the opening regions of panel d. f, Volcano plot showing the differential gene expression. The horizontal dashed line shows the P value threshold (P = 0.05). The blue and red spots show the downregulated or upregulated genes, respectively, in FetuA-cultured HSPCs. g, Western blots (top) and signal intensity (bottom) of BLM in E12.5 fetal liver Lin HSPCs cultured with or without FetuA and the bZIP inhibitor SR11032 (data shown as mean ± s.d.). h,i, Representative fluorescence images (h) and nuclear signal intensity (i) of dRNH1 in E12.5 fetal liver HSPCs cultured with or without FetuA and the BLM inhibitor ML216. The nuclear regions are circled by dotted lines. Scale bars, 10 µm and 5 µm. j,k, Representative comet-tail DNA images (j) and percentages (k) of Eto induced in E12.5 fetal liver HSPCs cultured with or without FetuA and the BLM inhibitor ML216. Scale bars, 20 µm. l, A working model of the FetuA–TLR4 pathway in protecting the HSPC genome. RPA, replication protein A; RNAP, RNA polymerase. n = 3 independent experiments (ak). The medians (red dashed lines) and quartiles (black dashed lines) are shown (i,k). Two-sided binomial test (e), two-sided Wald test (f), unpaired one-sided Student’s t-test (g) and unpaired two-sided Student’s t-test (i,k) were used. Source Data
Fig. 5
Fig. 5. A lack of FetuA increased vulnerability to leukaemogenesis.
a, Experimental design for genome-wide R-loop sequencing (R-loop Cut&Tag), whole-genome sequencing (WGS) and leukaemia induction. b, Gene metaplots analysis of R-loop Cut&Tag. The mean coverages of R-loop signals over gene bodies (±1 kb) in E16.5 fetal liver HSPCs from WT and FKO mice are shown (n = 3). TSS, transcription start site; TES, transcription end site. c, Boxplots showing the R-loop signal over gene bodies (±1 kb) in E16.5 fetal liver HSPCs from WT and FKO mice (n = 3). The boxes delimit the lower (25th) and upper (75th) interquartile, and the horizontal line represents the median. d, The number of chromosomal insertions (left), deletions (middle) and structural variations (right) per genome in bone marrow HSPCs from 3-week-old Eto-treated WT and FKO mice at E16.5 (n = 4). The boxes delimit the minima and maxima, and the horizontal line represents the mean. e, Circos plots showing the genome-wide distribution of the identified R-loop events (outer circles; n = 3 per group) and mutations (inner circles; n = 4 per group) in HSPCs from WT and FKO mice. f, Dot plots revealing the correlation between R-loop signals and mutations in WT (left) and FKO (right) mice (n = 3 for R-loop and n = 4 for WGS). g, Mean R-loop signal (n = 3) and mutation numbers (n = 4) of the genes frequently involved in leukaemia in HSPCs from WT and FKO mice. h, The onset of leukaemia induced in WT and FKO mice by Eto treatment at E16.5 and N-ethyl-N-nitrosourea (ENU) treatment at 3 weeks of age (see Extended Data Fig. 4a; n = 6 for WT and n = 11 for FKO). The n represents individual samples (bg) and mice (h) from three independent experiments. Two-sided Wilcoxon test (c), unpaired two-sided Student’s t-test (d), two-sided Pearson test (f) and log-rank (Mantel–Cox) test (h) were used. Source Data
Extended Data Fig. 1
Extended Data Fig. 1. Flow-sorting of HSPCs and their sensitivity to genotoxic agents ex vivo.
a, Immunophenotypically negative lineage (Lin), positive Sca-l (Sca-1+) and Kit+ (LSK) cells were sorted by flow cytometry with high purities (mean ± s.d.) from the haematopoietic tissues of the E12.5 placenta (PL) (n = 4), E12.5 fetal liver (FL) (n = 6), E13.5 FL (n = 4), E14.5 FL (n = 4), E15.5 FL (n = 3), E16.5 FL (n = 3), E18.5 FL (n = 5) and perinatal bone marrow (BM) (n = 3) to assay the sensitivity of HSPCs to genotoxic agents. b, c, Representative fluorescence images and positive cell proportions of γ-H2AX etoposide (Eto)-induced ex vivo in HSPCs isolated from PL, FL and BM on different embryonic days (E13.5 FL, n = 4; E15.5 FL, n = 6; other groups, n = 3). Scale bar, 50 µm. d, e, Representative fluorescence images and positive cell proportions of γ-H2AX ultraviolet (UV) light-induced HSPCs isolated from PL, FL and BM on different embryonic days (E12.5 PL, Perinatal BM, n = 4; E12.5 FL, E16.5 FL, n = 5; E13.5 FL, n = 9; E14.5 FL, E18.5FL, n = 3; E15.5 FL, n = 6). Scale bar, 50 µm. The n represents independent experiments. The mean ± s.d. is shown (c, e). Statistical tests: unpaired two-sided Student’s t-test (c, e). Source Data
Extended Data Fig. 2
Extended Data Fig. 2. Flow-sorting of HSCs and MPPs and DNA damage detection after Eto-treatment ex vivo or in vivo.
a, LT-HSCs (LSKCD150+CD48), ST-HSCs (LSKCD150CD48), and MPPs (LSKCD150CD48+) were sorted by flow cytometry with high purities from the haematopoietic tissues labelled to assay their sensitivity to genotoxic agents (n = 3 per group). b, c, Representative comet-tail DNA images and proportions induced by Eto-treatment ex vivo in LT-HSCs, ST-HSCs and MPPs isolated from the labelled tissues (n = 3 per group). The medians (red dashed lines) and quartiles (black dashed lines) of each group are shown. Scale bar, 50 µm. d, Representative in situ fluorescence images of Kit and γ-H2AX after Eto-treatment in vivo (E12.5 PL, E12.5 FL, n = 5; E13.5 FL, E16.5 FL, n = 4; E14.5 FL, E15.5 FL, E18.5 FL, n = 3). Scale bar, 30 µm. e, f, Representative in situ fluorescence images and the positive cell proportion of γ-H2AX in HSCs (LinCD41CD48CD150+) after Eto-treatment in vivo (E13.5 FL, E15.5 FL, n = 4, other groups, n = 3; mean ± s.d.). Scale bars, 20 and 5 µm. The n represents individual samples (a-c) and fetuses (d-f) from 3 independent experiments. Statistical tests: unpaired two-sided Student’s t-test (c, f). Source Data
Extended Data Fig. 3
Extended Data Fig. 3. Chromosomal alterations in BM HSPCs from Eto-treated mice at the embryonic stage.
a, Experimental design for whole-genome sequencing (WGS) and chromosome fluorescence in situ hybridization (FISH). b, The genome mutation numbers in 3-week-old BM-LSK cells (E12.5 FL, n = 3; E16.5 FL, n = 4). The boxes delimit the minima and maxima, and the horizontal line represents the mean. c, d, Representative fluorescence images and proportions of normal and aberrant chromosomes in cells from mice treated with Eto at E12.5 or E16.5, chromosome 4 (FITC) and chromosome 6 (Texas red); arrows indicate aberrant chromosomes (Untreated, n = 6, E12.5 Eto, n = 15; E16.5 Eto, n = 5; mean ± s.d.). Scale bar, 10 µm. The n represents individual samples (b) and mice (c, d) from 3 independent experiments. Statistical tests: unpaired two-sided Student’s t-test (b), unpaired one-sided Student’s t-test with Welsh’s correction (d). Source Data
Extended Data Fig. 4
Extended Data Fig. 4. Leukaemia induction and observation in mice.
a, Experimental design for leukaemia induction and monitoring in mice. ENU, N-ethyl-N-nitrosourea; PB, peripheral blood; BM, bone marrow. b, c, The physical symptoms of leukaemic and normal control mice. d, Spleens and lymph nodes from leukaemic and control mice. b-d, Control, n = 5, Leukaemic, n = 51. e, The proportion of lineage-negative cells in the BM of leukaemic and control mice (Control, n = 5, Leukaemic, n = 51; mean ± s.d.). f, Representative H&E images of tissue sections (Control, n = 4; Leukaemic, n = 10). Scale bars, 100 and 25 μm. The n represents individual mice. Statistical tests: unpaired two-sided Student’s t-test (e). Source Data
Extended Data Fig. 5
Extended Data Fig. 5. The hepatocyte-secreted factor FetuA provides genome protection for HSPCs.
a, b, Representative fluorescence images and positive proportions of γ-H2AX induced by Eto in E12.5 FL LT-HSCs, ST-HSCs and MPPs cultured with or without hepatocytes (refer to Fig. 3a) (n = 3). Scale bar, 20 µm. c, d, Representative fluorescence images and positive proportions of γ-H2AX Eto-induced in E12.5 FL-HSPCs in cultures of E16.5 or E12.5 hepatocyte-conditioned medium (co-SHI) or basic medium (SHI) (SHI-control, n = 6, E12.5 Co-SHI, n = 3; E16.5 Co-SHI, n = 5). Scale bar, 20 µm. e, Western-blots analysis of FetuA in SHI and co-SHI media and in E12.5 and E16.5 FL tissues; Coomassie blue was used as a loading control (n = 3). f, Representative fluorescence images of FetuA in E12.5 FL, E16.5 FL and E19 FL (n = 3). Scale bar, 500 µm. g, Representative fluorescence images of FetuA and hepatocytes (E-cadherin+), haematopoietic (CD45/Ter119+), endothelial (Scal-1 or CD144+), mesenchymal (Nestin+) cells in E16.5 FL (n = 3). Scale bars, 10 and 5 µm. h, Representative fluorescence images of FetuA (green) and HSPCs (LinCD41CD48CD150+) in E16.5 FL (n = 3). Scale bars, 10 and 5 µm. i, j, Representative comet-tail DNA images and the proportions of Eto-induced tail DNA in HSPCs cultured with or without FetuA (n = 3). The medians (red dashed lines) and quartiles (black dashed lines) of each group are shown. Scale bar, 100 µm. k, Representative fluorescence images of FetuA in the E19 bone marrow (BM) of Fetua+/– and Fetua–/– mice. Scale bar, 500 µm. l, m, Representative fluorescence images and positive cell proportions of γ-H2AX (green) in Kit+ cells (red) in the E19 BM of Fetua+/– or Fetua–/– mice (n = 3). Scale bar, 10 µm. n, Representative fluorescence images of FetuA in the E12.5 FL of mice with or without intraplacental (IP) injection of FetuA. Scale bar, 300 µm. o, p, Representative fluorescence images and positive cell proportions of γ-H2AX (green) in Kit+ cells (red) in the E12.5 FL of mice with or without IP injection of FetuA followed by Eto-treatment in vivo (IP FetuA–, n = 4; IP FetuA+, n = 3). Scale bar, 10 µm. q, Representative fluorescence images of FetuA in the E16.5 FL of Alb-cre; ROSA26-LSL-DTA mice with or without IP injection of FetuA. Scale bar, 500 µm. r, s, Representative fluorescence images and positive cell proportions of γ-H2AX (green) in Kit+ cells (red) in the E16.5 FL of Alb-cre; ROSA26-LSL-DTA mice with or without IP injection of FetuA followed by Eto-treatment in vivo (IP FetuA–, n = 3; IP FetuA+, n = 4). Scale bar, 10 µm. The n represents independent experiments (a-j) and fetuses (k-s) from 3 independent experiments. The mean ± s.d. is shown (b, d, m, p, s). Statistical tests: unpaired two-sided Student’s t-test (b, d, j, m, p, s). Source Data
Extended Data Fig. 6
Extended Data Fig. 6. Effects of FetuA on HSPCs.
a, Scatter-plots showing the consistency of ATAC-seq replicates for each group (n = 3). b, Fragment size distribution of ATAC-seq data (n = 3). c, ATAC-seq signals of Blm, Fanci and Smarcc1 in Integrative Genomics Viewer are shown; the red boxes indicate the peaks where the bZIP motifs are located (n = 3). d, Heatmaps showing the Cut & Tag peak signal intensities (n = 2). e, Cut & Tag sequencing signals of Jun, JunB and Fosl1 on the Blm gene from the Integrative Genomics Viewer are shown (n = 2). Cut & Tag for Jun binding to the Blm promoter. f, Western-blots analysis of the BLM protein in LSK cells from E12.5 FL and E16.5 FL (n = 2). g, h, Western-blots and relative signal intensity of the BLM protein in Lin cells cultured with or without FetuA at different time points (n = 3; mean ± s.d.). The n represents independent experiments. Statistical tests: unpaired two-sided Student’s t-test (h). Source Data
Extended Data Fig. 7
Extended Data Fig. 7. Immunofluorescence assay of dRNH1 and 2xHBD in HSPCs.
a, b, Representative fluorescence images and nuclear intensity of dRNH1 in HSPCs from E12.5 PL, E12.5 FL and E16.5 FL (n = 3). Scale bars, 10 and 5 µm. c, d, Representative fluorescence images and nuclear intensity of 2xHBD in HSPCs from E12.5 PL, E12.5 FL and E16.5 FL (n = 3). Scale bars, 10 and 5 µm. e, f, Representative fluorescence images and nuclear intensity of dRNH1 in HSCs and MPPs from E12.5 FL and E16.5 FL (n = 3). Scale bar, 10 µm. g, h, Representative fluorescence images and nuclear signal intensity of dRNH1 in E12.5 FL HSCs and MPPs cultured with or without FetuA (n = 3). Scale bar, 10 µm. The nuclear regions are circled by dotted lines (a, c, e, g). The medians (red dashed lines) and quartiles (black dashed lines) are shown (b, d, f, h). The n represents independent experiments. Statistical tests: unpaired two-sided Student’s t-test (b, d, f, h). Source Data
Extended Data Fig. 8
Extended Data Fig. 8. Fetal liver HSPCs undergo DNA-replication and transcription simultaneously.
a, b, Representative flow cytometry images and the proportions of each cell cycle stage in HSPCs from E12.5 PL, E12.5 FL and E16.5 FL cells stained with Hoechst 33342 and PyroninY (E12.5 PL, E16.5 FL, n = 3; E12.5 FL, n = 6; S/G2/M phase was compared). c, d, Representative flow cytometry images and the proportions of HSPCs in each cell cycle stage at E12.5 PL, E12.5 FL and E16.5 FL after 5-ethynyl-2’-deoxyuridine (EdU) treatment (n = 3 per group; S phase was compared). e, f, Representative flow cytometry images and Ki67-positive cell proportions in HSCs and MPPs from E12.5PL, E12.5FL and E16.5FL (n = 3 per group). g, h, Representative flow cytometry images and the ethyluridine (EU)-positive fraction of HSPCs from E12.5 PL, E12.5 FL and E16.5 FL after EU-treatment (E12.5 PL, E12.5 FL, n = 3; E16.5 FL, n = 6; EU+ population was compared). i, j, Representative fluorescence images and nuclear signal intensity of p-RPA in HSPCs from E12.5 PL, E12.5 FL and E16.5 FL (n = 3). The medians (red dashed lines) and quartiles (black dashed lines) are shown. Scale bar, 10 µm. k, l, Representative fluorescence images and nuclear signal intensity of p-RPA in E12.5 FL-HSPCs treated with or without FetuA (n = 3). The medians (red dashed lines) and quartiles (black dashed lines) are shown. Scale bar, 10 µm. m, n, Representative flow cytometry images and the proportion of each cell cycle stage in HSPCs cultured with or without FetuA and the BLM inhibitor ML216 (n = 3). The mean ± s.d. is shown (b, d, f, h, n). The n represents individual samples from 3 independent experiments (a-h) and independent experiments (i-n). Statistical tests: unpaired two-sided Student’s t-test (b, d, f, h, j, l, n). Source Data
Extended Data Fig. 9
Extended Data Fig. 9. Genome-wide R-loop and DNA sequencing assays of fetal HSPCs.
a, Experimental design for genome-wide R-loop sequencing (R-loop Cut & Tag). b, Genomic distribution of R-loop peaks in each sample. c, Enrichment of R-loops in various types of repetitive elements in each sample. d, Gene-metaplots analysis of R-loop Cut & Tag; mean coverages of R-loop signals over gene bodies (±1 kb) in the HSPCs from E12.5 PL, E12.5 FL and E16.5 FL are shown. e, Box-plots showing the R-loop signal over gene bodies (±1 kb) in HSPCs from E12.5PL, E12.5 FL and E16.5 FL. The boxes delimit the lower (25th) and upper (75th) interquartile, and the horizontal line represents the median. f. GO analysis of differentially expressed peak-annotated genes; the circle size shows the number of genes associated with each GO term, and the circle colour denotes the –Log (P value). g, Mean R-loop signal of the genes that are frequently involved in leukemogenesis in HSPCs from E12.5 PL, E12.5 FL, and E16.5 FL and in E12.5 FL HSPCs cultured with or without FetuA. h, Gene-metaplots analysis of R-loop Cut & Tag; mean coverages of R-loop signals over gene bodies (±1 kb) in E12.5 FL HSPCs cultured with or without FetuA are shown. i, Box-plots showing the R-loop signal over gene bodies ( ± 1 kb) in E12.5 FL HSPCs cultured with or without FetuA. The boxes delimit the lower (25th) and upper (75th) interquartile, and the horizontal line represents the median. n = 3 independent experiments (b-i). Statistical tests: two-sided Wilcoxon test (e, i). Source Data
Extended Data Fig. 10
Extended Data Fig. 10. Similar genome-protective mechanism in humans.
a, Schematic of haematopoietic development and the tissues used for HSPC harvest (red dashed lines) for the assessment of genome stability. b, Immunophenotypically lineage-negative (Lin) and CD34-positive (CD34+) cells were flow-sorted with high purities from the haematopoietic tissue of E7w fetal liver (FL), E8w FL, E9w FL, E10w FL, E11w FL, E12w FL, E13w FL, E15w FL, E16w FL and neonatal cord blood (CB) to determine the sensitivity of HSPCs to genotoxic agents. c, d, Representative fluorescence images and positive proportions of γ-H2AX induced by Eto in human HSPCs isolated from FL and CB (first trimester, n = 6; second trimester, n = 8; cord blood, n = 3). Scale bar, 50 µm. e, f, Representative fluorescence images and mean fluorescence intensity (MFI) of FetuA (green) in human FL at the indicated developmental stages (n = 5 per group). Scale bar, 50 µm. g, Representative fluorescence images of FetuA and CD34 (red) in FL (n = 3). Upper scale bar, 20 µm; lower scale bar, 10 µm. h, Proportions of γ-H2AX-positive FL-HSPCs cultured with or without FetuA induced by Eto in the first trimester (n = 3). i, Representative fluorescence images of FetuA and TLR4 on HSPCs after FetuA-treatment (n = 3). Scale bar, 20 µm. j, Liquid chromatography-mass spectrometry quantification of FetuA in the bone marrow blood sera of benign and leukaemic infants (Benign, n = 14; Leukaemic, n = 10). The n represents individual samples (c-f, j) and independent experiments (g-i). The mean ± s.d. is shown (d, f, h, j). Statistical tests: unpaired two-sided Student’s t-test (d, f, h, j). Source Data

References

    1. Saxena, S. & Zou, L. Hallmarks of DNA replication stress. Mol. Cell82, 2298–2314 (2022). - PMC - PubMed
    1. Gaillard, H. & Aguilera, A. Transcription as a threat to genome integrity. Annu. Rev. Biochem.85, 291–317 (2016). - PubMed
    1. Aguilera, A. & Garcia-Muse, T. Causes of genome instability. Annu. Rev. Genet.47, 1–32 (2013). - PubMed
    1. Hoeijmakers, J. H. Genome maintenance mechanisms for preventing cancer. Nature411, 366–374 (2001). - PubMed
    1. Branzei, D. & Foiani, M. Maintaining genome stability at the replication fork. Nat. Rev. Mol. Cell Biol.11, 208–219 (2010). - PubMed

MeSH terms

Substances

LinkOut - more resources