. 2025 Jan;637(8045):496-503.
doi: 10.1038/s41586-024-08289-w. Epub 2024 Dec 4.

Mis-splicing of a neuronal microexon promotes CPEB4 aggregation in ASD

Affiliations

Mis-splicing of a neuronal microexon promotes CPEB4 aggregation in ASD

Carla Garcia-Cabau et al. Nature. 2025 Jan.

Abstract

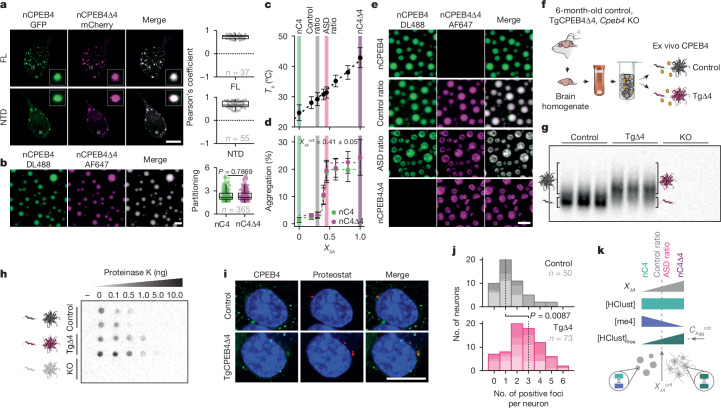
The inclusion of microexons by alternative splicing occurs frequently in neuronal proteins. The roles of these sequences are largely unknown, and changes in their degree of inclusion are associated with neurodevelopmental disorders1. We have previously shown that decreased inclusion of a 24-nucleotide neuron-specific microexon in CPEB4, a RNA-binding protein that regulates translation through cytoplasmic changes in poly(A) tail length, is linked to idiopathic autism spectrum disorder (ASD)2. Why this microexon is required and how small changes in its degree of inclusion have a dominant-negative effect on the expression of ASD-linked genes is unclear. Here we show that neuronal CPEB4 forms condensates that dissolve after depolarization, a transition associated with a switch from translational repression to activation. Heterotypic interactions between the microexon and a cluster of histidine residues prevent the irreversible aggregation of CPEB4 by competing with homotypic interactions between histidine clusters. We conclude that the microexon is required in neuronal CPEB4 to preserve the reversible regulation of CPEB4-mediated gene expression in response to neuronal stimulation.


Conflict of interest statement

Competing interests: K.L.-L. holds stock options in and is a consultant for Peptone. X.S. is a scientific founder and advisor of Nuage Therapeutics. All other authors declare no competing interests.

Figures

Fig. 1
Fig. 1. CPEB4 condenses in neurons.
a, CRISPR–Cas9-mediated mEGFP knock-in strategy in mice. b, Generation of ex vivo differentiated striatal neurons from mEGFP–CPEB4 knock-in mice. c,d, Fluorescence microscopy image of live ex vivo primary striatal neurons (left) and western blot (right) analysing mEGFP–CPEB4 expression (c) and the number and size of foci (d) (median). –/–, untagged littermates; NA, not applicable; T/T, mEGFP–CPEB4 mice. n, cells. e,f, Fluorescence microscopy image of fixed differentiated N2a cells overexpressing nCPEB4 (left) and western blot (right) analysing FL and NTD expression (e) and the number and size of foci (f) (median, two-tailed Mann–Whitney test). Untr., untransfected cells. n, cells from 3 independent experiments. g,h, Fluorescence microscopy images of live ex vivo primary striatal neurons before and after stimulation (g) and percentage of cells (mean) with foci after stimulation (3 min) (h). n, cells. i,j, Fluorescence microscopy images of live differentiated N2a cells overexpressing nCPEB4–GFP before and after stimulation (i) and percentage of cells (mean) with foci after stimulation (60 min) (j). n, cells from 3 independent experiments. For h and j, only cells with cytoplasmic foci before stimulation were analysed. For gel source data, see Supplementary Fig. 1. Scale bars, 10 μm (c,e,g,i). Illustration in b created using BioRender (credit: R.M., https://biorender.com/q00q129; 2024). Source Data
Fig. 2
Fig. 2. nCPEB4 condensation is regulated by pH.
a,b, Fluorescence microscopy images of live differentiated N2a cells overexpressing FL nCPEB4–GFP before and after stimulation (a) and the fraction of cellular area occupied by condensates after stimulation, normalized to the value measured at the end of stimulation (b). Representation of the most common behaviour (53.3% of cells, mean ± s.d.). n, cells out of 30 cells. c, Changes in intracellular pH of N2a cells after stimulation. Representation of the most common behaviour (53.8% of cells, mean ± s.d.). n, cells out of 13 cells from 3 independent experiments. d, Chemical shift of a specific nCPEB4(NTD) histidine Cβ signal as a function of pH and pKa values of all histidine side-chain resonances. Box plots: line, median; box, quartiles; whiskers, 1.5× the interquartile range. n, resonances. e, Differential interference contrast (DIC) microscopy images at 20 ºC (top) and cloud points (bottom; mean ±  s.d.) of nCPEB4(NTD) as a function of pH (10 µM protein, 100 mM NaCl). n = 3 independent measurements. f, nCPEB4(NTD) mutants. g, DIC microscopy images at 38 ºC (top) and cloud points (bottom; mean ± s.d.) of nCPEB4(NTD) and mutants (30 µM protein, 100 mM NaCl, pH 8). The number of histidine residues is indicated at the base of each bar. nC4, nCPEB4. n = 3 independent measurements. h, Map of intermolecular contact ratios, after histidine protonation, between a chain in the middle of the condensate and the surrounding chains (mean). Neg, region rich in negatively charged amino acids; qHis, charge of histidine residues. n = 3 independent simulation replicas. i, Contact ratio between different residue types on a chain in the middle of the condensate and the histidine residues on the surrounding chains (mean). Box plots: line, median; box, quartiles; whiskers, rest of the distribution. n = 3 independent simulation replicas. j, Simulation snapshots of two interacting nCPEB4(NTD) chains in a condensate. k, DIC microscopy images of nCPEB4(NTD) as a function of pH and NaCl concentration at 25 °C (5 µM protein for pH 6; 30 µM protein for pH 8). n = 3 fields of view. For b, only cells with cytoplasmic foci before stimulation were analysed. Scale bars, 10 μm (a,e,g,k). Source Data
Fig. 3
Fig. 3. me4 prevents CPEB4 aggregation.
a, nCPEB4(NTD) deletion variants. b, Cloud points (mean ± s.d., n = 3 independent measurements; 30 µM protein, 100 mM NaCl) and urea concentration required for multimer dissolution (100 µM protein, 5 °C; Extended Data Fig. 4a). c,d, Fluorescence microscopy images of fixed differentiated N2a cells overexpressing nCPEB4–GFP or nCPEB4Δ4–GFP (c) and number of foci (median, two-tailed Mann–Whitney test) (d). n, cells from 3 independent experiments. e,f, Fluorescence microscopy images of live differentiated N2a cells overexpressing nCPEB4–GFP or nCPEB4Δ4–GFP before and after stimulation (e) and percentage of cells (mean, two-tailed Mann–Whitney test) with foci after stimulation (60 min) (f). n, total cells analysed by blind analysis from a pool of 7 experiments. g, DIC microscopy images of nCPEB4(NTD) and nCPEB4Δ4(NTD) at 30 °C and on ice (30 µM protein, 150 mM NaCl). n = 3 fields of view. h, Fluorescence microscopy images (with enhanced brightness) of nCPEB4(NTD) and mutants after 1 day of incubation (30 µM protein, 200 mM NaCl, 37 °C). n = 9 fields of view from 3 independent experiments. i,j, Aggregation quantification (mean ± s.d.) of nCPEB4(NTD) and variants (i) and of nCPEB4Δ4(NTD) as a function of pH (j) (30 µM protein, 200 mM NaCl, 37 °C). n = 9 fields of view from 3 independent experiments. Vertical line and shading indicate mean ± s.d. of the His pKa values (Fig. 2d). k,l, Fluorescence microscopy images of live differentiated N2a cells overexpressing nCPEB4Δ4–GFP or Δ4ΔHC–GFP before and after stimulation (k) and percentage of cells (mean, two-tailed Mann–Whitney test) with foci after stimulation (60 min) (l). n, cells from 3 independent experiments. m, Fraction of the cellular area occupied by condensates after stimulation, normalized to the value measured at the end of stimulation. Left, representation of the most common behaviour (68.2% of cells, mean ± s.d.) of nCPEB4Δ4. n, cells out of 22 cells. Right, representation of the most common behaviours (52.6% of cells, mean ± s.d.) of Δ4ΔHC. n, cells out of 19 cells. For f, l and m, only cells showing cytoplasmic foci before stimulation were analysed. nC4, nCPEB4; nC4Δ4, nCPEB4Δ4. Scale bars, 10 μm (c,e,g,h,k). Source Data
Fig. 4
Fig. 4. Dominant-negative effect of mis-splicing.
a, Fluorescence microscopy images of fixed differentiated N2a cells co-transfected with nCPEB4–GFP and nCPEB4Δ4–mCherry (left) and co-localization, as assessed by using Pearson’s correlation coefficient (right). Box plots: line, median; box, quartiles; whiskers, 1.5× interquartile range. n, cells from 3 independent experiments. b, Fluorescence microscopy images of a solution of nCPEB4(NTD) and nCPEB4Δ4(NTD) (χΔ4 = 0.5, n = 3 fields of view; left) and partitioning in the condensates (n, condensates, two-tailed Mann–Whitney test; right) (30 µM protein, 200 mM NaCl, 37 °C). Box plots: line, median; box, quartiles; whiskers, 1.5× interquartile range. c, Cloud point of solutions of nCPEB4(NTD) and nCPEB4Δ4(NTD) of different compositions (mean ± s.d.) (20 µM protein, 100 mM NaCl). n = 3 independent measurements. d,e, Aggregation quantification (mean ± s.d.) after 1 day (d) and fluorescence microscopy images of nCPEB4, nCPEB4Δ4 and ratios of control and ASD (e) (30 µM protein, 200 mM NaCl, 37 °C). n = 10 fields of view from 3 independent experiments. f, Schematic of analysis of aggregates in mouse brains. Yellow spheres, co-purified entities. g, Western blot of ex vivo CPEB4 from brains of 6-month-old control mice, TgCPEB4Δ4 mice and Cpeb4 knockout mice (KO; negative control) by SDD–AGE, with the positions of monomeric and aggregated CPEB4 indicated. n = 2 individual measurements. h, Dot blot western of proteinase K resistance of CPEB4 from brains of 6-month-old control mice, TgCPEB4Δ4 mice and Cpeb4 KO mice. n = 2 individual measurements. i,j, Fluorescence microscopy images of striatal neurons from brain sections of 1.5-month-old control mice and TgCPEB4Δ4 mice immunostained for CPEB4 (green) and co-staining with Proteostat dye (red) for aggregates (i) and distribution of the number of double-positive (CPEB4 and Proteostat) foci per neuron (j). n, neurons from 3 (control) and 4 (TgCPEB4Δ4) mice (colour shades). Dotted line: median. Significance assessed using a generalized linear mixed model. k, Effect of χΔ4 on the aggregation of mixtures of nCPEB4(NTD). CAggcrit, critical concentration of free HClust necessary for aggregation, defining χΔ4crit; [HClust]free, amount of HClust not interacting with me4. For gel source data, see Supplementary Fig. 4. nC4, nCPEB4; nC4Δ4, nCPEB4Δ4; TgΔ4, TgCPEB4Δ4. Scale bars, 10 μm (a,b,e,i). Source Data
Fig. 5
Fig. 5. A peptide restores the reversibility of condensation.
a, Peptide sequence. b, Fluorescence microscopy images of an ASD ratio sample in the absence (–peptide) and presence (+peptide) of 1 molar equivalent (eq) of peptide (30 µM protein, 100 mM NaCl, 37 °C). n = 3 fields of view. Scale bar, 10 μm. c, Aggregation quantification of nCPEB4Δ4–AF647 in an ASD ratio sample at increasing molar equivalents of peptide after 1 day (mean ± s.d.) (30 µM protein, 100  mM NaCl, 37 °C). n = 9 fields of view from 3 independent experiments. d, Temperature reversibility experiment monitored by apparent absorbance measurements. Change of the cloud point (mean ± s.d.) at each temperature cycle, relative to that measured before the first cycle (Tc – Tc0) (20 µM protein, 100 mM NaCl). n = 3 independent measurements. Dotted line: fully reversible process. e, Schematic illustration of how low inclusion of me4 in nCPEB4 can lead to the onset of ASD. Illustration in e created using BioRender (credit: R.M., https://biorender.com/j24j695; 2022). Source Data
Extended Data Fig. 1
Extended Data Fig. 1. Model systems and in vitro behavior.
a) nCPEB4 sequence. E3, exon 3; me4, microexon 4; RRM, RNA recognition motif; ZZ, zinc-binding domain. b) Sagittal section of a CPEB4 immunohistochemistry in a mouse embryo (E13.5) with several regions of the nervous system highlighted. CB, cerebellum; CHP, choroid plexus; CS, corpus striatum; DRG, dorsal root ganglion; NPC, neopallial cortex. Representative of n = 3 embryos. c) RT-PCR assay monitoring Cpeb4 me4 splicing in different mouse organs with an amplified schematic of the Cpeb4 splice variants. n = 2 replicates. d) qRT-PCR assays monitoring Srrm4 transcript levels in different mouse organs relative to brain (mean). n, biological replicates (tissue samples from different mice). e) qRT-PCR assays monitoring the percentage of Cpeb4 isoforms harboring me4 (nCPEB4) or not (nCPEB4Δ4) in different cell lines (mean). Undiff., undifferentiated; Diff., differentiated. n, biological replicates. f) qRT-PCR assays monitoring Srrm4 and Rbfox1 transcript levels in different cell lines relative to undifferentiated N2a (mean). n, biological replicates. g) Percentage spliced in (PSI) of Cpeb4 me4 in either Control (Ctrl) or SRRM4 knock-down (SRRM4 KD) N2a cells and in either Control (Ctrl) or SRRM4 over-expressed (SRRM4) 293T cells. Data from B. Blencowe. h) FRAP of nCPEB4 in N2a cells (mean ± s.d.). Fluorescence recovery half-time (t1/2) and mobile fraction (MF) from 3 independent experiments. n, foci. i,j) Fluorescence microscopy of live ex vivo striatal neurons after stimulation with NMDA (i) and fraction of the cellular area occupied by condensates after stimulation, normalized to the value measured at the end of stimulation, tfirst (j) (mean ± s.d., one-way ANOVA). tfirst, time frame immediately after NMDA addition; tmax, time frame showing the maximum condensed fraction; tlast, last time frame. n, cells. k) Fold change in the transcript levels (mean, two-tailed Mann-Whitney test) of the early depolarization marker cFos in NMDA stimulated primary neurons and N2a cells relative to before stimulation. n, independent experiments. l) Fold change in the transcript levels (mean, two-tailed Mann-Whitney test) of early depolarization markers (JunB and cFos) in N2a cells after KCl stimulation relative to before stimulation. n, independent experiments. m) Absorbance as a function of temperature of a nCPEB4(NTD) solution (30 µM protein, 100 mM NaCl) and DIC microscopy insets at 15 and 35 °C. Green line: cloud point (Tc). Representative of n = 3 independent measurements. n) DIC microscopy of a fusion event of nCPEB4(NTD) in vitro condensates (30 µM protein, 100 mM NaCl, 25 °C). n = 2 fusion events. o) FRAP of nCPEB4(NTD) in vitro condensates (20 µM protein, 150 mM NaCl, 37 °C; mean ± s.d.). n, condensates. For j, only cells showing cytoplasmic foci before stimulation were analyzed. For gel source data, see Supplementary Fig. 1. Scale bars, 1000 μm (b) and 10 μm (i,m,n). Source Data
Extended Data Fig. 2
Extended Data Fig. 2. Analysis of phosphorylations and pH titrations.
a,b) nCPEB4 modified-to-total occurrence ratios determined by mass spectrometry (a) before and after stimulation of N2a cells overexpressing FL nCPEB4-GFP (median) and representative WB of the immunoprecipitation (b). n = 3 independent biological replicates. Bold: previously undescribed post-translationally modified sites. Gray line: positions of exons (E1-E10). E4, microexon 4; P, phosphorylation; M, methylation; DM, dimethylation. c) Foci quantification of nCPEB4(NTD)-GFP non-phosphorylatable (11A) and phospho-mimetic (11D) mutants in differentiated N2a cells (median, two-tailed Mann-Whitney test). n, cells. d) Fluorescence microscopy of live differentiated N2a cells overexpressing nCPEB4(NTD)-GFP 11D and 11A mutants before and after stimulation with WB analyzing expression. n11D = 8 and n11A = 11 cells from 1 independent experiment. e) Left: Percentage of cells (mean) in d) with foci after stimulation (60 min). The mean ± s.d. of nCPEB4(NTD) is represented in green for reference (Fig. 1j). Right: Fraction of cellular area in d) occupied by condensates after stimulation (60 min), normalized to the value measured at the end of stimulation (mean ± s.d., two-tailed Mann-Whitney test). n, cells from 1 independent experiment. f,g) Fluorescence microscopy of live differentiated N2a cells overexpressing nCPEB4-GFP before (-ionomycin) and after (+ionomycin) addition of 1 µM ionomycin with WB analyzing expression (f) and percentage of cells (mean) with foci after ionomycin addition (60 min) (g). The mean ± s.d. of KCl stimulation is represented in green for reference (Fig. 1j). Untr., untransfected cells. n, cells from 3 independent experiments. h) Fraction of cellular area occupied by condensates after stimulation, normalized to the value measured at the end of stimulation. Representation of the behavior of 40% (left) and 6.7% (right) of cells (mean ± s.d.). n, cells out of 30 total cells. Related to Fig. 2b. i) Changes in intracellular pH of N2a cells after stimulation. Representation of the behavior of 46.2% of cells (mean ± s.d.). n, cells out of 13 total cells from 3 independent experiments. Related to Fig. 2c. j) Amino acid composition of nCPEB4(NTD) and enrichment score (ES, mean ± s.d.) of each amino acid type in nCPEB4(NTD) compared to the DisProt3.4 database,. k) Determination of the apparent pKa of His residues in nCPEB4(NTD) by NMR, where each plot represents the fit of the chemical shift of the His resonances and the inset shows the pKa values obtained. For e,g,h, only cells with cytoplasmic foci before stimulation were analyzed. nC4, nCPEB4; Δ4, nCPEB4Δ4. For gel source data, see Supplementary Fig. 2. Scale bars, 10 μm (d,f). Source Data
Extended Data Fig. 3
Extended Data Fig. 3. nCPEB4(NTD) simulations and analysis of multimerization.
a) Comparison between the saturation concentrations from experiments (30 µM protein, 100 mM NaCl, pH 8, 40 °C) and molecular simulations (qHis = 0.01, 20 °C) of nCPEB4(NTD) and the His to Ser variants. Experimental saturation concentrations are represented as mean ± s.d. of n = 3 measurements of the same sample. Simulation data are represented as mean ± s.d. over n = 3 independent simulation replicas. qHis, charge of His residues. b) Saturation concentrations (upper) and dense phase concentrations (lower) from molecular simulations of nCPEB4(NTD) with qHis = 0.50 (nCPEB4 qHis = 0.50), 0.10 (nCPEB4 qHis = 0.10), and 0.01 (nCPEB4), and of the His to Ser variants with qHis = 0.01. Data represented as mean ± s.d. (closed markers) over n = 3 independent simulation replicas (open markers). c) Upper: position of His, Arg, Lys, Phe, Tyr, Trp, Asp, and Glu residues in the nCPEB4(NTD) sequence. Middle: ratio of contacts at qHis = 0.50 vs qHis = 0.01 between His (green circles) or Arg residues (blue squares) and charged residues (closed symbols), and vice versa (open circles). Lower: ratio of contacts at qHis = 0.50 vs qHis = 0.01 between aromatic (cyan circles) or Arg residues (blue squares) and His residues (closed symbols), and vice versa (open symbols). Both open and closed symbols show ratios of contacts between residues on a chain in the middle of the condensate and the surrounding chains. Data represented as mean ± s.d. of n = 3 independent simulation replicas. d) Experimental saturation concentrations (30 µM protein, 40 °C) of nCPEB4(NTD) at increasing NaCl concentrations at pH 6 and 8 (mean ± s.d.). n = 3 measurements of the same sample. e) Effect of concentration, temperature, ionic strength, and pH on nCPEB4(NTD) multimer formation monitored by DLS (representative of n = 3 measurements). f) Liquid-phase TEM micrograph of a multimer and size distribution. n, imaged multimers. Scale bar, 10 nm. g) Temporal evolution of multimers (10 µM protein, 100 mM NaCl, 25 °C) by super-resolution microscopy. n = 2 fields of view. Scale bar, 5 μm. h) 1H,15N-CP-HISQC backbone amide peak intensities of nCPEB4(NTD) at increasing urea concentrations (100 µM protein, 5 °C). Red dots: residues not assigned. n = 1 spectrum. i) Urea titration of the samples in h) monitored by DLS (representative of n = 3 measurements). j) Amino acid clustering (nine amino acid window) in nCPEB4(NTD). Upper: aromatic residues (gray) and His (cyan). Center: cationic residues (gray) and Arg (blue). Lower: anionic residues (red). k) Ranking of mean 1H,15N-CP-HISQC backbone amide peak intensities of nCPEB4(NTD) at 4 M urea by amino acid type (100 µM protein, 5 °C). Box plots: line, median; box, quartiles; whiskers, 1.5x interquartile range. n = 1 spectrum. l) Average contacts (mean and difference of n = 2 independent replicas) between residues in a chain in the middle of a multimer and the residues on the surrounding chains from simulations of nCPEB4(NTD) multimers of 130 to 170 chains with an Rg of 17.5 ± 0.8 nm. m) 1H,13C-HSQC traces of representative side chain resonances at 0 and 4 M urea (500 µM protein, 5 °C). The specific residue types (one letter code) and 1H position within the side chain (Greek letters) are indicated. n = 1 spectrum. Source Data
Extended Data Fig. 4
Extended Data Fig. 4. Effect of me4 on nCPEB4(NTD) multimerization and on nCPEB4 interactions in cells.
a) Left: urea titration monitored by DLS of nCPEB4Δ4(NTD), ΔHC, and Δ4ΔHC (100 µM protein, 5 °C). Right: relative volume fractions of the monomer and multimer peaks (mean ± s.d.) versus urea concentration for all protein variants. Related to Extended Data Fig. 3i. n = 3 measurements. b) Effect of concentration, temperature, ionic strength, and pH on nCPEB4Δ4(NTD) multimer formation monitored by DLS (representative of n = 3 measurements). c) 1H,15N-CP-HISQC backbone amide peak intensities of nCPEB4Δ4(NTD) at increasing urea concentrations (100 µM protein, 5 °C). To simplify the comparison there is a gap in the amino acid sequence corresponding to me4 and the numbering of residues after this position is based on nCPEB4(NTD). Red dots: residues not assigned. n = 1 spectrum. d) Ranking of mean 1H,15N-CP-HISQC backbone amide peak intensities of nCPEB4Δ4(NTD) at 4 M urea by amino acid type (100 µM protein, 5 °C). Box plots: line, median; box, quartiles; whiskers, 1.5x interquartile range. n = 1 spectrum. e) nCPEB4 and nCPEB4Δ4 number and size of foci from fluorescence microscopy of fixed N2a cells (median, two-tailed Mann-Whitney test). n, cells from 3 independent experiments. Related to Fig. 3c,d. f) xCPEB4 and xCPEB4 + Ex4 proximity partners determined by BioID in Xenopus laevis prophase I oocytes. Upper: fold increase in association of proximity partners with xCPEB4 harboring exon4 (+Ex4) relative to the xCPEB4 variant without exon4 (Δ4), shown as peptide-spectrum match (PSM) ratios between the two isoforms. Identified hits include proteins enriched in xCPEB4-BirA (Δ4) and xCPEB4 + Ex4-BirA, relative to BirA alone. The hits were identified in the N-terminal and C-terminal BirA fusions. Lower: WB of X. laevis oocytes injected with BirA alone or myc-tagged xCPEB4-BirA (Δ4) and xCPEB4 + Ex4-BirA (+Ex4) used in BioID assay. Biotinylated proteins shown with streptavidin-HRP. n = 1 independent biological replicate. g) Comparison of nCPEB4 and nCPEB4Δ4 interactomes composition in N2a cells determined by immunoprecipitation followed by mass spectrometry identification. Volcano plot showing differentially abundant interactome hits in nCPEB4Δ4 compared to nCPEB4. Bait proteins are indicated (nCPEB4Δ4: Q17RY0_nC4Δ4, nCPEB4: Q17RY0_nC4). Significance assessed with two-sided Empirical Bayes Statistics for Differential Expression test. h) Effect of me4 in nCPEB4 binding to RNA determined by in vivo competition assay. Polyadenylation of Emi2 3′-UTR radioactive probe in the absence (–) and presence (+) of progesterone (P) in X. laevis oocytes not injected (0% competition) or injected with CPEB1 RNA-binding domain (ZZ) (100% competition), CPEB4 RNA-binding domain (RRMs), xCPEB4 (Δ4), xCPEB4 + Ex4 (+Ex4). n = 1 independent experiment. nC4, nCPEB4; nC4Δ4, nCPEB4Δ4. For gel source data, see Supplementary Fig. 3. Source Data
Extended Data Fig. 5
Extended Data Fig. 5. Effect of me4 on condensate morphology in vitro and condensate dissolution in cells.
a) Fraction of cellular area occupied by nCPEB4Δ4 condensates after stimulation, normalized to the value measured at the end of stimulation. Representation of the behavior of 71.2%, 18.6%, and 10.2% of cells (mean ± s.d.). n, cells out of 59 total cells. b) nCPEB4Δ4 modified-to-total occurrence ratios determined by mass spectrometry before and after stimulation of N2a cells overexpressing FL nCPEB4Δ4-GFP (median). n = 3 independent biological replicates. Bold: previously undescribed post-translationally modified sites. Gray line: positions of exons (E1-E10). P, phosphorylation; M, methylation; DM, dimethylation. c) Cloud point (mean ± s.d.) of nCPEB4Δ4(NTD) as a function of pH (10 µM protein, 100 mM NaCl). n = 3 independent measurements. d) Fluorescence microscopy of nCPEB4(NTD), nCPEB4Δ4(NTD), ΔHC, and Δ4ΔHC over time (30 µM protein, 200 mM NaCl, 37 °C). Related to Fig. 3h,i. n = 9 fields of view from 3 independent experiments. e) FRAP of in vitro nCPEB4Δ4(NTD) condensates (30 µM protein, 200 mM NaCl, 37 °C) after 7 days (mean ± s.d.). n, condensates. f) Change of the cloud point (mean ± s.d.) of nCPEB4(NTD) and nCPEB4Δ4(NTD) with increasing molar equivalents of RNA, relative to that measured without RNA (Tc-Tc0) (30 µM protein, 100 mM NaCl). nC4, nCPEB4; nC4Δ4, nCPEB4Δ4. n = 3 independent experiments. g) Fluorescence microscopy of nCPEB4(NTD) and nCPEB4Δ4(NTD) with increasing molar equivalents of RNA 1 day after sample preparation and aggregation quantification (mean ± s.d.) (30 µM protein, 200 mM NaCl, 37 °C). n = 9 fields of view from 3 independent experiments. h) Fraction of cellular area occupied by condensates after stimulation, normalized to the value measured at the end of stimulation, of live N2a cells overexpressing nCPEB4Δ4 and Δ4ΔHC mutant. Representation of the behavior of 22.7% and 9.1% (nCPEB4Δ4) and 26.3% and 21.1% (Δ4ΔHC) of cells (mean ± s.d.). n, cells out of 22 and 19 total cells, respectively. Related to Fig. 3m. For a,h, only cells showing cytoplasmic foci before stimulation were analyzed. Scale bars, 10 μm (d,g). Source Data
Extended Data Fig. 6
Extended Data Fig. 6. Effect of nCPEB4Δ4 mole fraction on condensation in vitro and identification of nCPEB4 aggregates in mouse brains.
a) Co-localization as assessed by using Pearson’s correlation coefficient of fixed N2a cells co-transfected with nCPEB4-mCherry and nCPEB4Δ4-GFP. Box plots: line, median; box, quartiles; whiskers, 1.5x interquartile range. n, cells from 3 independent experiments. b) FRAP experiment (mean ± s.d.) in N2a cells co-transfected with FL nCPEB4-GFP and nCPEB4Δ4-mCherry (upper) or nCPEB4-mCherry and nCPEB4Δ4-GFP (lower). n, condensates from 3 independent experiments. c) Fluorescence microscopy of solutions of nCPEB4(NTD) and nCPEB4Δ4(NTD) of different compositions after 1 day (30 µM protein, 200 mM NaCl, 37 °C). n = 10 fields of view from 3 independent experiments. Related to Fig. 4d,e. Scale bar, 10 μm. d) Cloud point (mean ± s.d.) of control and ASD isoform ratio samples as a function of pH (10 µM protein, 100 mM NaCl). n = 3 independent measurements. e) Aggregation quantification (mean ± s.d.) of solutions of nCPEB4(NTD) and nCPEB4Δ4(NTD) of different compositions at pH 6 and 8 (30 µM protein, 200 mM NaCl, 37 °C). n = 9 fields of view from 3 independent experiments. f) WB of ex vivo CPEB4 from 6-month-old control mice, TgCPEB4Δ4 mice, and Cpeb4 KO mice (negative control) brains by 4–12% gradient SDS-PAGE. n = 2 individual measurements. g) WB of different conformational states of ex vivo CPEB4 from 6-month-old control mice and TgCPEB4Δ4 mice brains using SDD-AGE. The increased amount of aggregated CPEB4 in TgCPEB4Δ4 mice brains, eluting in the void volume (framed fractions), was quantified and normalized to control mice, used as an internal control (10.8 vs 1.0). n = 2 individual measurements. h) Aggregation time course of monomeric CPEB4 from 6-month-old control mice brains seeded by stable CPEB4 aggregates from 6-month-old TgCPEB4Δ4 mice brains. The seed (~40 ng of total protein extracted) is undetectable in the WB. Within 24 h, CPEB4 monomers from 6-month-old control mice brains are aggregated, resembling the seed. The last lane displays the seed concentrated 100-fold. n = 2 individual measurements. nC4, nCPEB4; nC4Δ4, nCPEB4Δ4; TgΔ4, TgCPEB4Δ4. For gel source data, see Supplementary Fig. 4. Source Data
Extended Data Fig. 7
Extended Data Fig. 7. Effect of the peptide on nCPEB4(NTD) condensation in vitro.
a) Partitioning of each isoform in the condensates of an ASD ratio sample (χΔ4 = 0.45) in the absence and presence of 1 molar equivalent of peptide (30 µM protein, 100 mM NaCl, 37 ºC). Related to Fig. 5b. Box plots: line, median; box, quartiles; whiskers, 1.5x interquartile range. n, condensates. Statistical significance from a two-tailed Mann-Whitney test. b) Cloud point difference (mean ± s.d.) of an ASD ratio sample with 1 molar equivalent of peptide compared to the sample without peptide (Tc-Tc(ASD)) (30 µM protein, 100 mM NaCl). n = 3 independent measurements. c) Fluorescence microscopy of an ASD ratio sample (30 µM protein, 100 mM NaCl, 37 ºC) with increasing molar equivalents of peptide after 1 day and aggregation quantification of nCPEB4 DL488 (mean ±s.d.). n = 9 fields of view from 3 independent experiments. Scale bar, 10 μm. d) Schematic representation of the temperature reversibility experiment. e) Example of one replicate of the temperature reversibility experiment. Apparent absorbance measurement for nCPEB4(NTD) (left), nCPEB4Δ4(NTD) (center), and nCPEB4Δ4(NTD) with 1 molar equivalent of peptide (right) over three temperature cycles. f) Temperature reversibility experiment monitored by apparent absorbance measurements (20 µM protein, 100 mM NaCl). Absorbance increase (ΔA) ratio (mean ± s.d.) at each temperature cycle relative to the ΔA measured before the first cycle (ΔA/ΔA0). n = 3 independent measurements. Dotted line: fully reversible process. g,h) Amino acid composition and enrichment score (ES, mean ± s.d.) of each amino acid type in CPEB2(NTD) (g) and CPEB3(NTD) (h) compared to the DisProt3.4 database,. Illustration in d created using BioRender (credit: R.M., https://biorender.com/q89v018; 2023). Source Data

References

    1. Gonatopoulos-Pournatzis, T. & Blencowe, B. J. Microexons: at the nexus of nervous system development, behaviour and autism spectrum disorder. Curr. Opin. Genet. Dev.65, 22–33 (2020). - PubMed
    1. Parras, A. et al. Autism-like phenotype and risk gene mRNA deadenylation by CPEB4 mis-splicing. Nature560, 441–446 (2018). - PMC - PubMed
    1. Irimia, M. et al. A highly conserved program of neuronal microexons is misregulated in autistic brains. Cell159, 1511–1523 (2014). - PMC - PubMed
    1. Ule, J. & Blencowe, B. J. Alternative splicing regulatory networks: functions, mechanisms, and evolution. Mol. Cell76, 329–345 (2019). - PubMed
    1. Gonatopoulos-Pournatzis, T. et al. Autism-misregulated eIF4G microexons control synaptic translation and higher order cognitive functions. Mol. Cell77, 1176–1192.e16 (2020). - PubMed

LinkOut - more resources