. 2025 Jan;637(8045):487-495.
doi: 10.1038/s41586-024-08308-w. Epub 2024 Dec 4.

Tracking transcription-translation coupling in real time

Affiliations

Tracking transcription-translation coupling in real time

Nusrat Shahin Qureshi et al. Nature. 2025 Jan.

Abstract

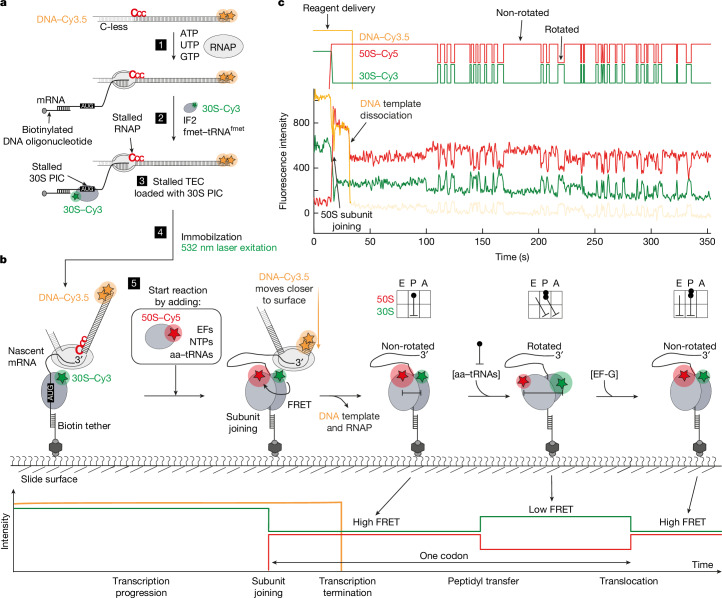
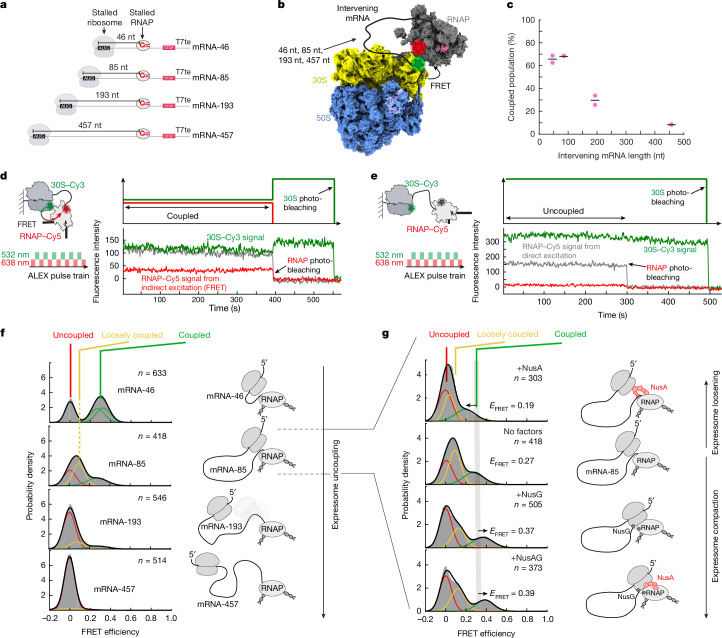
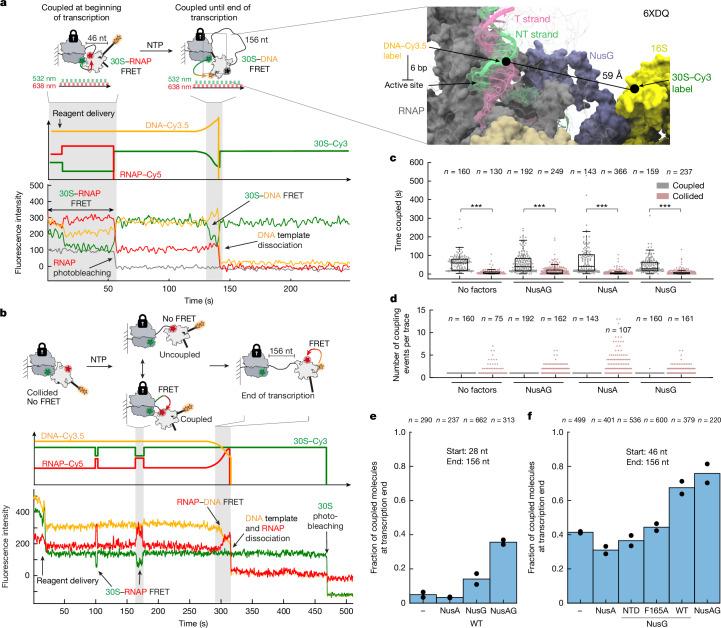
A central question in biology is how macromolecular machines function cooperatively. In bacteria, transcription and translation occur in the same cellular compartment, and can be physically and functionally coupled1-4. Although high-resolution structures of the ribosome-RNA polymerase (RNAP) complex have provided initial mechanistic insights into the coupling process5-10, we lack knowledge of how these structural snapshots are placed along a dynamic reaction trajectory. Here we reconstitute a complete and active transcription-translation system and develop multi-colour single-molecule fluorescence microscopy experiments to directly and simultaneously track transcription elongation, translation elongation and the physical and functional coupling between the ribosome and the RNAP in real time. Our data show that physical coupling between ribosome and RNAP can occur over hundreds of nucleotides of intervening mRNA by mRNA looping, a process facilitated by NusG. We detect active transcription elongation during mRNA looping and show that NusA-paused RNAPs can be activated by the ribosome by long-range physical coupling. Conversely, the ribosome slows down while colliding with the RNAP. We hereby provide an alternative explanation for how the ribosome can efficiently rescue RNAP from frequent pausing without requiring collisions by a closely trailing ribosome. Overall, our dynamic data mechanistically highlight an example of how two central macromolecular machineries, the ribosome and RNAP, can physically and functionally cooperate to optimize gene expression.


Conflict of interest statement

Competing interests: The authors declare no competing interests.

Figures

Fig. 1
Fig. 1. Single-molecule assay for real-time tracking of co-transcriptional translation elongation.
a, Experimental design for preparation of transcription–translation complexes. C-less, sequence lacking cytidines; CCC, three consecutive cytidines. b, Single-molecule assay for observing transcription and translation of the same mRNA molecules in real time. EFs, elongation factors. Grids at top right depict tRNA conformation in the A, P and E sites of the ribosome during the translation elongation cycle. Scheme at bottom illustrates the expected fluorescence signals. c, Representative single-molecule trace showing fluorescence intensities of transcription (yellow) and translation (red and green). Trace was smoothed for visualization. An idealized trace is displayed on top.
Fig. 2
Fig. 2. Ribosome slows down while colliding with RNAP.
a, Experimental design. TC–TL complex, transcription–translation complex. b,c, Representative, smoothed traces for elongating (b) and colliding conditions (c). d, Probability density histograms for number of translated amino acids in colliding and elongating conditions. e, Box plots of non-rotated (top) and rotated (bottom) dwell times during colliding (left, blue) and elongating (right, orange) conditions with 150 nM total aa–tRNAs and 50 nM EF-G. Boxes show median (centre line), 25th percentile (bottom edge), 75th percentile (top edge) and whiskers extend to 1.5 times the interquartile range. Note that not all outliers are visible on this y-axis scale. The red dashed line denotes the position at which ribosome and RNAP would collide under colliding conditions. f, Cumulative probability distribution of the dwell times for the sixth amino acid incorporation for non-rotated state (left) and rotated state (right). Number of analysed molecules (n) is indicated (d,f) or reported in Methods (e). Data were combined from three biological replicates (df). g, Expressome structures visualizing the start and end states of the ribosome slowdown after colliding with the RNAP, represented by the coupled state (Protein Data Bank (PDB): 6XDQ) transitioning into the collided state (PDB: 6ZTM). Source Data
Fig. 3
Fig. 3. Real-time tracking of ribosome–RNAP coupling in dependence of intervening mRNA length and Nus factor composition.
a, DNA template design. T7te, T7 terminator. b, Location of labelling sites within coupled expressome (PDB: 6XDQ). c, Total population of coupled states (loosely coupled and coupled) in dependence of intervening mRNA length. Mean of two replicates is shown as black line. Number of analysed molecules (n) and data used are the same as depicted in f. d,e, Schematic (left) and representative smoothed traces (right) for coupled (d) and uncoupled (e) expressomes. f, FRET distribution histograms with varying mRNA length. Uncoupled (EFRET ≈ 0), loosely coupled (EFRET ≈ 0.1) and coupled states (EFRET ≈ 0.3) are indicated. Number of analysed molecules (n) is indicated. Data were combined from two replicates. g, FRET distribution histograms with different Nus factor compositions for mRNA-85. Number of analysed molecules (n) is indicated. Data were combined from two replicates. FRET distribution histogram shown for mRNA-85 without factors is the same as shown in f. NusAG, NusA plus NusG. Source Data
Fig. 4
Fig. 4. Nus factors increase coupling during active transcription elongation and RNAP–ribosome collisions reduce subsequent coupling efficiency.
a,b, Experimental setup (top) and example traces for tracking coupling during active transcription elongation starting from coupled (a, bottom left) or collided state (b, bottom). Traces were smoothed for visualization. a, Right, expressome structure displaying the distance between the 30S–Cy3 label in h33a and the DNA–Cy3.5 label. c, Beeswarm plots representing all coupled dwell times for all molecules during transcription from coupled or collided states. Box plots are overlaid in black. Boxes show median (centre line), 25th percentile (bottom edge) and 75th percentile (top edge), and whiskers extend to 1.5 times the interquartile range. Number of dwell times (n) is indicated. Two-sided Wilcoxon–Mann–Whitney test: *P < 0.05, **P < 0.01, ***P < 0.001. Exact P values are shown in Source Data. d, Number of coupling and recoupling events per trace during transcription from coupled or collided states. Number of evaluated molecules (n) is shown. e,f, Mean fraction of molecules coupled at the end of transcription starting from collided (e) or coupled (f) states. Black dots represent values from two biological replicates. Total number of evaluated molecules (n) is shown. WT, wild type. Source Data
Fig. 5
Fig. 5. Ribosome reactivates NusA-paused RNAP via mRNA looping.
a,b, Overview of single-molecule experimental setup. The start of the experiment was triggered by delivery of 50 µM NTPs and 1 µM Nus factors at various combinations to either immobilized stalled mRNA-46 TEC (−70S; a) or stalled expressome (+70S; b). TC, transcription. c, Overlay of probability density distribution for single-molecule transcription times without 70S and with 70S in the presence and absence of Nus factors. Number of evaluated molecules (n) is indicated. d, NusA conformations in the histidine (his) operon leader paused elongation complex (hisPEC)-bound cryo-EM structure (PDB: 6FLQ) and in the expressome-bound cryo-EM structure (PDB: 6XDQ). The structures were aligned on RNAP Cα backbone atoms using PyMol. NusA conformation in his-paused RNAP is incompatible with the expressome owing to steric clashes between NusA and 30S (S3, S4 and 16S rRNA). e, Left, single-round transcription assays with mRNA-46 in the presence of NusA and with or without 70S, analysed by denaturing gel electrophoresis. Stalled TEC, pause 1 (P1), pause 2 (P2) and full-length (FL) mRNA bands are shown (full gel is presented in Extended Data Fig. 9). Top right, band intensities (from two biological replicates) are plotted as a function of time. f, Model for ribosome-assisted RNAP activation via long-range interactions. Source Data
Extended Data Fig. 1
Extended Data Fig. 1. Real-time tracking of translation elongation.
a, Scheme for data evaluation. b, 50S arrival time to the mRNA-46 stalled TEC loaded with 30S PIC. Data was acquired with 50 nM 50S-Cy5, 2 µM IF2a, 150 nM aa-tRNA, 450 nM EF-Tu, 300 nM EF-Ts, 50 nM EF-G at 21 °C. The time of 50S arrival to the expressome is plotted as histogram. Inset shows zoom of the first 20 s after reagent delivery. Reagent delivery time is at t = 0 s. Number of analyzed molecules (n) is indicated. c, Overview for HMM-assisted assignment of single-molecule traces. d, e, Representative smoothed traces for elongating (d) and colliding (e) conditions are shown. HMM assignment is shown on top. Original HMM assignment based on tMAVEN is shown in green, after visual inspection in red and after non-TL correction in pink (see methods). FRET efficiencies are plotted on bottom. Threshold used during visual inspection is indicated as an horizontal dashed line. f, Boxplots for longest dwell per trace is shown for elongating and colliding condition, exemplifying the assignment procedure on two replicates. Median (central mark), 25th percentile (bottom edge) and 75th percentile (top edge) are shown. Whiskers correspond to 1.5x interquartile range. g, Beeswarm and boxplots of dwell times for aa-tRNA-dependent non-rotated state (left panel) and EF-G-dependent rotated state (middle panel). Median (central mark), 25th percentile (bottom edge) and 75th percentile (top edge) are shown. Whiskers correspond to 1.5x interquartile range. Asterisks represent p-values determined via two-sided Wilcoxon-Mann-Whitney-test and are reported as p < 0.05*, p < 0.01**, p < 0.001***. Exact values are listed in Source Data. Note that at the given y-axis range not all outliers are visible (see full list in Source Data). Average transcription rate is plotted as function of NTP concentration (right panel). Numbers of evaluated dwell times (n) are indicated in the plots. h, Stack of single-molecule traces for elongating (left) and colliding (right) conditions. Each row represents a single transcription-translation complex. Non-rotated states are displayed in dark orange (elongating) or dark blue (colliding). The respective rotated states are shown in light orange or light blue. i, Mean fraction of molecules ending in rotated state or non-rotated state for colliding or elongating conditions. Last state before photobleaching was evaluated. Indicated errors are standard deviations from three biological replicates with points representing the value from individual replicates. j, SDS-PAGE gel (one replicate) containing all recombinantly expressed protein factors used in this study. Source Data
Extended Data Fig. 2
Extended Data Fig. 2. Real-time tracking of translation elongation.
a, b, Under colliding conditions, rotated and non-rotated dwell times deviate from single-exponential behavior: Single exponential fitting of non-rotated and rotated state dwell-times for the first 6 amino acids during elongating (a) and colliding conditions (b), using y = 1-exp(-b*t), with given coefficient [b] representing the mean transition rate (in s−1) for the respective state. 95% confidence bounds of the fits are indicated. The number of fitted dwells (n) are indicated as inset in panel c. c, Cumulative probability of colliding (blue) and elongating (orange) conditions from panel a, b are overlayed. The two right plots are also shown in main Fig. 2f. d, Boxplots of longest (left), second longest (middle) and third longest (right) dwell time per trace for all molecules are shown for elongating (orange) and colliding (blue) conditions. Number of evaluated dwells (n) is indicated. Median (central mark), 25th percentile (bottom edge) and 75th percentile (top edge) are shown. Whiskers correspond to 1.5x interquartile range. Colliding state dwells using 10x higher aatRNA/EF-G concentrations are shown in gray. Note: not all dwells are observable at given y-axis (see full list in Source Data). e, FRET distribution histograms are shown. Number of analyzed molecules is indicated. Bar graph in bottom right panel shows that the ribosome resides preferentially in the rotated state during the collision process. While approaching RNAP from 46 nt to 28 nt intervening mRNA length, the ribosome is 59 ± 3% of the time present in the rotated state versus 20 ± 12% during elongating conditions. Data points from 2 biological replicates are shown. Note: the FRET efficiency change between replicates is due to the use of different donor fluorophores that have different R0 values (51 Å for Cy3 and 71 Å for Cy3B). Source Data
Extended Data Fig. 3
Extended Data Fig. 3. Ribosome – RNAP distances and labeling.
a, Overlay of expressome structures (6ztn, 6x7f, 6xdq, 6x6t, 6vu3, 6zto), showing the variation of FRET distances between the ribosomal h33a (16S rRNA) and RNAP β’ (Nter=black and Cter=pink) labeling sites. Structures were aligned on the RNAP. Helix 33 is color coded according to pdb ID and displayed as cartoon representation. Labeling sites on RNAP and 16S rRNA are indicated as spheres. In all displayed coupled states, the labeling sites are in FRET distance, whereas in the collided state and uncoupled state, they are too far to be detected by FRET (>100 Å). b, Introduction of the ybbR-peptide tag as well as the Cy5 label do not significantly affect RNAP activity: RNAP-Cy5 activity test using single-round transcription assays. Area of total RNA (mean of duplicates) was integrated and normalized to WT RNAP. Individual data points are shown. c, d, Overview of all pdb-deposited expressome structures, (n = 37), which serve as the structural basis for the ribosome-RNAP (c) or ribosome-DNA (d) FRET signal. Distances are plotted as a function of the intervening mRNA illustrating that our FRET signal is specific for the coupled states. Collided state structures are shown in red, coupled state structures are shown in green and uncoupled state structures are shown in gray. For (c), distances were measured between E16 C-alpha (RNAP β’) and U1025 C3’ (16S rRNA) and for (d), the distances were measured between the same residue of RNAP and DNA 6 nt downstream from the active site to the non-template strand, where the Cy3.5 DNA label is located during transcription termination. Distances to alternative 30S/RNAP complexes relevant to translation initiation rather than elongation, were also evaluated (>130 Å) but cannot be plotted here, as they lack nucleic acids. Some uncoupled structures (6ztp, 6zto cluster 4 and 5) also fall in FRET range, however those structures were only obtained at a shorter 38 nt intervening mRNA length and were not observed at longer mRNA lengths used in our study to track ribosome/RNAP coupling. Vertical dashed line in plots at 46 nt represents the shortest construct used for the coupled state in this study. Source Data
Extended Data Fig. 4
Extended Data Fig. 4. Ribosome-RNAP distance distributions.
a, FRET distribution histograms are displayed in dependence of mRNA length. Number of analyzed molecules are indicated within the plots. Uncoupled state (EFRET ~ 0) is shown in red, loosely coupled state (EFRET ~ 0.1) is shown in orange and coupled state (EFRET ~ 0.3) is shown in green. The combined datasets of both replicates are shown in Fig. 3f. b-d, DNA oligonucleotides hybridizing to the intervening mRNA can affect (mRNA-46) or completely disrupt coupling (mRNA-85, mRNA-193, mRNA-457). FRET distribution histograms (b) and corresponding schematics (c, d) for oligonucleotide induced expressome uncoupling. e, FRET distribution histograms are displayed in dependence of Nus factors for mRNA-85. Number of analyzed molecules are indicated within the plots. Uncoupled state (EFRET ~ 0) is shown in red, loosely coupled state (EFRET ~ 0.1) is shown in orange and coupled state (EFRET ~ 0.3) is shown in green. The combined datasets of both replicates are shown in Fig. 3g. Source Data
Extended Data Fig. 5
Extended Data Fig. 5. Ribosome-RNAP coupling kinetics.
a, Representative, smoothed single-molecule traces (mRNA-85) displaying dynamically coupled expressome molecules acquired as equilibrium experiments (no reagent delivery). b, Mean fraction of coupled molecules is plotted for different mRNA lengths with values from individual biological replicates indicated (from two replicates). Total number of molecules (n) analyzed is indicated. c, Coupled dwell times for all coupling events for all molecules are displayed as beeswarm and boxplots. Median (central mark), 25th percentile (bottom edge) and 75th percentile (top edge) are shown. Whiskers correspond to 1.5x interquartile range. The signals for the expressome being in the coupled state before photobleaching (periods of 30S-Cy3/RNAP-Cy5 FRET) was evaluated for molecules for which the RNAP-Cy5 signal did not photobleach before 100 s. Number of analyzed dwells (n, from two replicates) is indicated. d, Expressome recoupling dynamics are shown for mRNA-85 and mRNA-193. The signals for the expressome being uncoupled (periods of no Cy3-Cy5 FRET) were evaluated and the dwells were fitted with a single exponential equation: y = 1-exp(-b*t). The number of fitted dwells (n) is indicated for both biological replicates (top and bottom plots). The errors represent the 95% confidence intervals of the fit. e-h, Stack of raw single-molecule traces for mRNA-46 (e), mRNA-85 (f), mRNA-193 (g), mRNA-457 (h) in absence of transcription and translation elongation. Each row represents a single transcription-translation complex. Coupled states (characterized by 30S-Cy3/RNAP-Cy5 FRET signal) are shown in blue. Traces are sorted by the total time for which coupling can be detected. White spaces in between coupling events represent uncoupled expressomes. The fraction of uncoupled expressomes increases with mRNA length. In case of the mRNA-46 expressome, we do not detect any uncoupling events and therefore, the apparent coupled state lifetime is limited by photobleaching. Traces without any coupled states during the entire experimental time are represented as empty traces (white) at the bottom of each plot. Source Data
Extended Data Fig. 6
Extended Data Fig. 6. Coupling is more transient following a ribosome-RNAP collision.
a, Coupled dwell times (2 biological replicates) during transcription following a collision were fitted to a 1-exponential function, y = 1-exp(-b*t). Evaluated FRET signal is shown on the left. The error represents the 95% confidence intervals of the fit. The number of fitted dwells (n) is indicated for both replicates. b, c, Stack of single-molecule traces for transcriptions out of collided (b) or coupled (c) state. Each row represents a single transcription-translation complex. Experiment start was triggered by delivering 50 µM NTPs to the immobilized and stalled expressome molecules in absence of Nus factors. Transcriptions are depicted in yellow-orange, coupling events are shown in red and traces with coupling at transcription end are marked in green. A large portion of collided expressomes fail to establish coupling completely during subsequent transcription elongation. Source Data
Extended Data Fig. 7
Extended Data Fig. 7. Tracking coupling during transcription elongation.
Representative smoothed traces for transcription out of coupled (a-c) or collided (d) state. Data was acquired with alternative laser excitation at wavelengths of 532 nm and 638 nm. The reaction was started with delivery of 50 µM of each NTP. The 70S ribosome was kept stalled on the RBS. a, Illustration of single-molecule trace, where both machines remain coupled throughout the complete transcription reaction. The steady increase in Cy3.5-Cy5 FRET efficiency towards the end of transcription (at ~160–170 s) directly shows active transcription elongation while both machines are coupled containing an intervening mRNA length of 156 nt. b, Single-molecule trace (smoothed) with photobleaching of the RNAP-Cy5 before transcription is completed. Time-evolution of coupling cannot be tracked by 30S-Cy3 and RNAP-Cy5 FRET anymore. Moreover, the expressome uncouples after RNAP-photobleaching and before transcription end, as also no 30S-Cy3 to DNA-Cy3.5 FRET is detected (in contrast to Fig. 4a). c, d, Assignment of 3-color data by thresholding exemplified on representative, smoothed traces. Thresholds for 30S-RNAP FRET transitions are shown as red horizontal dashed lines, which allows for accurate determination of the coupled dwell times, and thresholds for 30S-DNA (c) or DNA-RNAP (d) FRET transitions are displayed as yellow orange horizontal dashed lines, which allows for the accurate determination of transcription end (see black arrows). Green-yellow arrows depict bleedthrough from green Cy3-channel to yellow-Cy3.5 channel and yellow-red arrows depict bleedthrough from yellow-Cy3.5 channel to red-Cy5 channel.
Extended Data Fig. 8
Extended Data Fig. 8. Transcription from collided state immediately resumes after addition of NTPs.
Single-round transcription assays with assembled 70S collided expressome using prNQ215 DNA template. Stalled transcription elongation complex (stalled TEC) was formed with 50 nM DNA template, 200 nM E. coli RNAP, 100 µM ACU trinucleotide, 5 µM GTP and 5 µM ATP (+150 nM 32P α-ATP) halting RNAP initially at U24 to prevent loading of multiple RNAPs. Then RNAP was walked to desired stalling site by addition of 10 µM UTP and simultaneous addition of 10 µg/mL rifampicin (to prevent transcription re-initiation). 70S PIC was formed on the stalled TEC in presence of 2 µM IF2a, 1 µM fmet-tRNAfmet and 4 mM GTP. This stalled expressome was chased in presence or absence of NusA and/or NusG with 50 µM NTPs (each) at room temperature and per condition time points were taken at 0, 10, 20, 30, 40, 60, 90, 120, 180, 240, 360 and 600 s. Stalled expressome band (91 nt) was immediately chased after NTP addition (<10 s). The gels stem from one replicate.
Extended Data Fig. 9
Extended Data Fig. 9. The ribosome activates NusA-paused RNAPs.
a-d, Single-round transcription assays with coupled expressome using the prNQ216 DNA template. h101 of the 50S mutant was pre-annealed with a biotin-oligonucleotide and the formed expressomes were purified using streptavidin beads to enrich for fully assembled transcription-translation complexes. The purified stalled expressome (+70S) or the stalled transcription complex alone (−70S) were chased in presence or absence of Nus factors (w/o factors, w/ NusA/NusG, w/ NusA only, w/ NusG only; 1 µM final concentration for each Nus factor) and with 50 µM NTP (each) at room temperature. For each condition, time points were taken at 0, 10, 20, 30, 40, 60, 90, 120, 180, 240, 360 and 600 s. e, Pause-escape lifetimes for pause 1 and pause 2 in presence of NusA and in presence (orange) or absence (blue) of ribosome. Natural logarithm of normalized band intensities (P/T) was plotted as function of time and pause-escape lifetimes were fitted with a linear fit function (y = m*x + b, with m being the rate constant). Data range that was used for fitting is indicated with arrows. Pause-escape lifetime (τ) errors were obtained by error propagation of linear least square fit error for the rate constant. f, Ribosome can activate RNAP only when sharing the same mRNA: Single-round transcription assays with mRNA-46 in presence of NusA and with 1 µM 70S (in trans, loaded on 6(FK) mRNA) analyzed by denaturing gel electrophoresis. Stalled TEC, pause 1, pause 2 and full-length mRNA bands are shown. The gel stems from one replicate. g, Normalized band intensities (P/T) from gels shown in panels a-d are displayed as a function of time. The displayed datapoints are from 2 biological replicates. Bands for pause 1, pause 2 and full-length (FL) RNA were integrated and divided by the total RNA per lane. Parts of panels (b), (d) and (g) are also shown in main Fig. 5e. h, Secondary structure prediction of the nascent mRNA (mRNA-46) using the RNA structure web server (https://rna.urmc.rochester.edu/RNAstructureWeb/). Top prediction shows secondary structure at pause site 1 (134 nt) and bottom prediction shows secondary structure at pause site 2 (169 nt). The secondary structure was predicted using default settings on the website for 21 °C, forcing the ribosome binding site (as it is masked by the ribosome) and 12 nt (ref. ) upstream from 3’-end of the nascent mRNA (as they are masked by the paused RNAP) to be single-stranded. Color code corresponds to probability of base-pair formation. Position of the ribosome and the RNAP are indicated. Start codon (AUG) is highlighted with a black box. Source Data
Extended Data Fig. 10
Extended Data Fig. 10. The ribosome activates NusA-paused RNAPs.
a, Overlay of probability density distribution for single-molecule transcription times without 70S (blue) and with 70S (orange) in presence and absence of Nus factors. This is a replicate of the data presented in Fig. 5c. Number of evaluated molecules (n) is indicated. b,c, Probability density distribution for single-molecule transcription times with 70S in presence of 1 µM NusG-NTD (b) or 1 µM NusG-F165A (c). Number of evaluated molecules (n) is indicated. Source Data

References

    1. Miller, O. L., Hamkalo, B. A. & Thomas, C. A. Visualization of bacterial genes in action. Science169, 392–395 (1970). - PubMed
    1. Blaha, G. M. & Wade, J. T. Transcription–translation coupling in bacteria. Annu. Rev. Genet.56, 187–205 (2022). - PubMed
    1. McGary, K. & Nudler, E. RNA polymerase and the ribosome: the close relationship. Curr. Opin. Microbiol.16, 112–117 (2013). - PMC - PubMed
    1. Irastortza-Olaziregi, M. & Amster-Choder, O. Coupled transcription–translation in prokaryotes: an old couple with new surprises. Front. Microbiol.11, 624830 (2020). - PMC - PubMed
    1. Burmann, B. M. et al. A NusE:NusG complex links transcription and translation. Science328, 501–504 (2010). - PubMed

MeSH terms

LinkOut - more resources