. 2024 Dec 4;7(1):1617.
doi: 10.1038/s42003-024-07289-w.

Single-cell immune profiling and validation of PBMCs in the onset of and recovery from herpes zoster

Affiliations

Single-cell immune profiling and validation of PBMCs in the onset of and recovery from herpes zoster

Shang Zheng et al. Commun Biol. .

Abstract

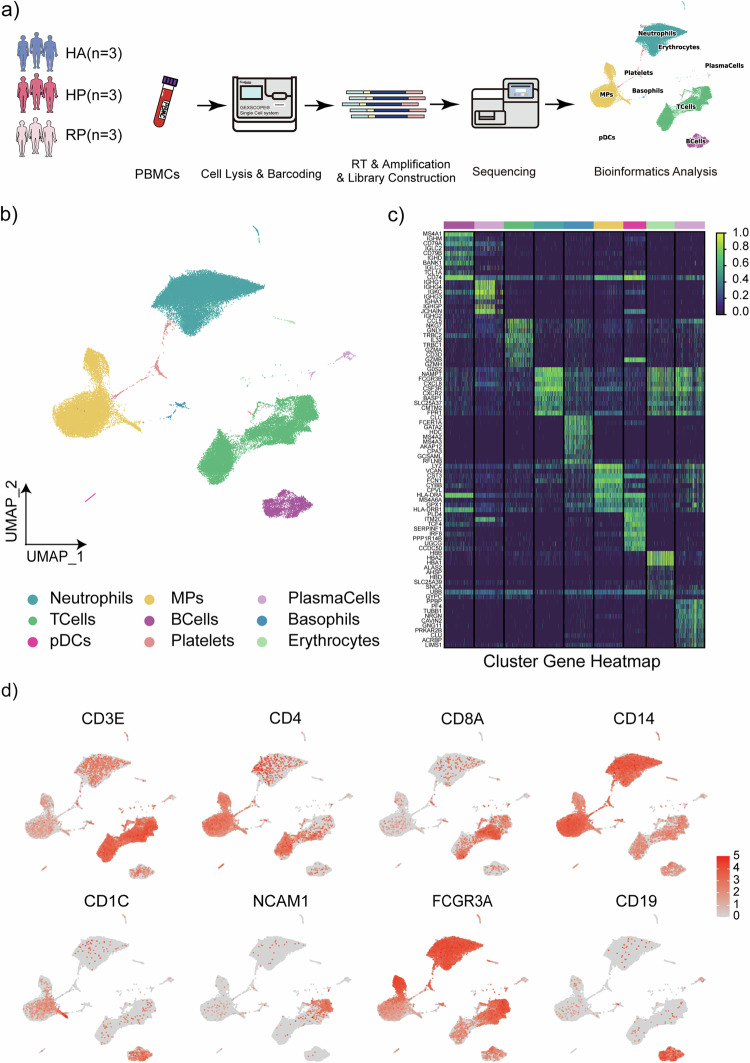
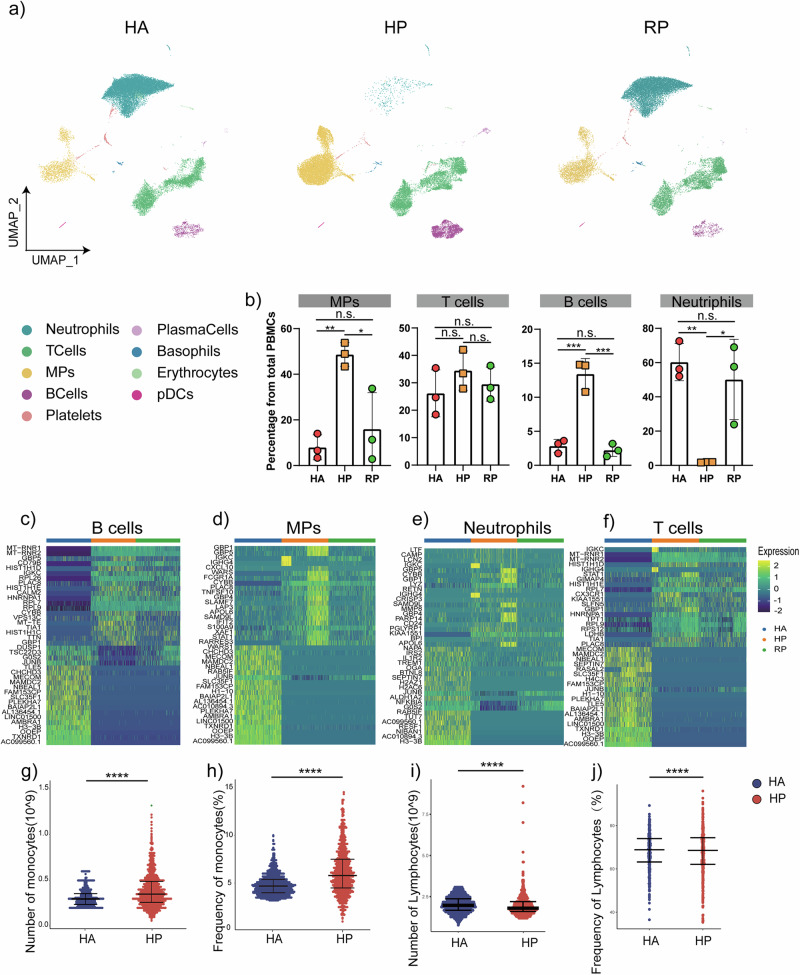
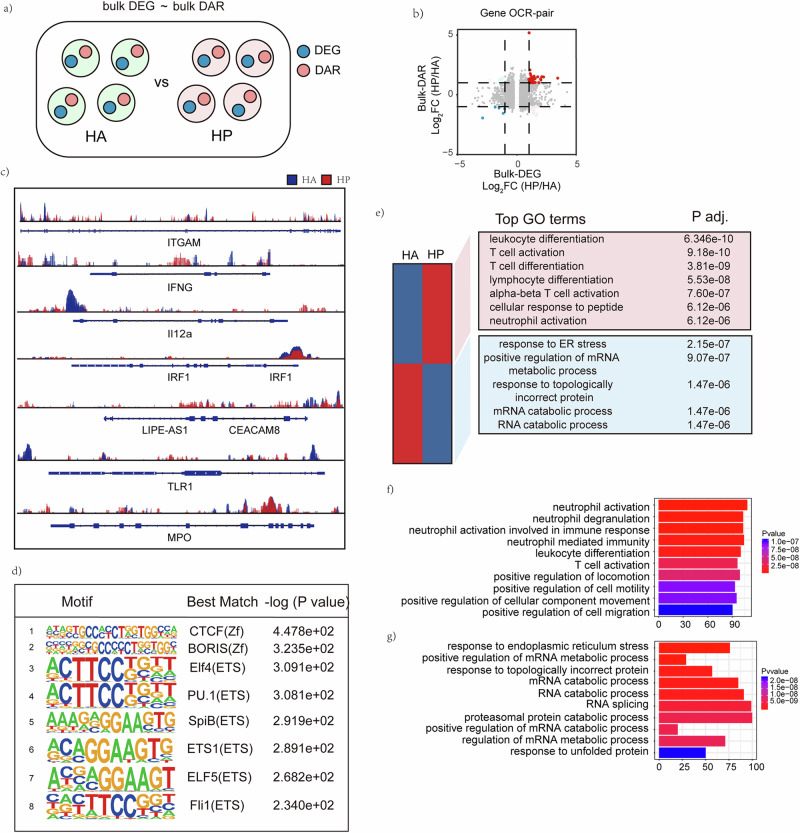
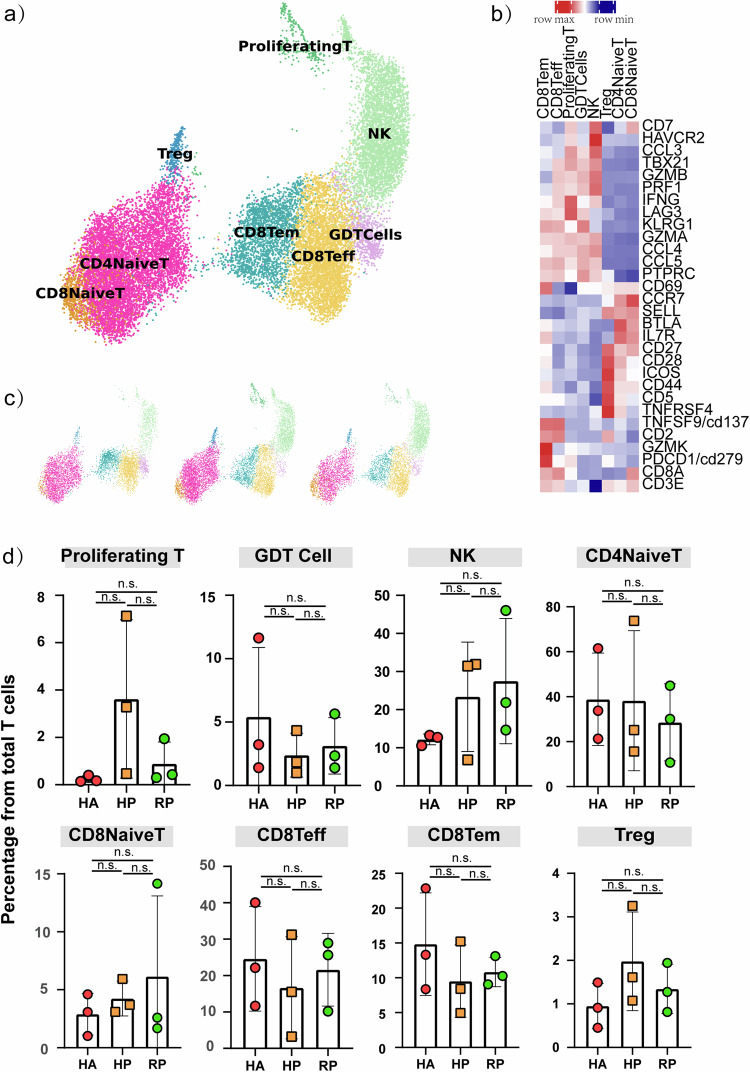
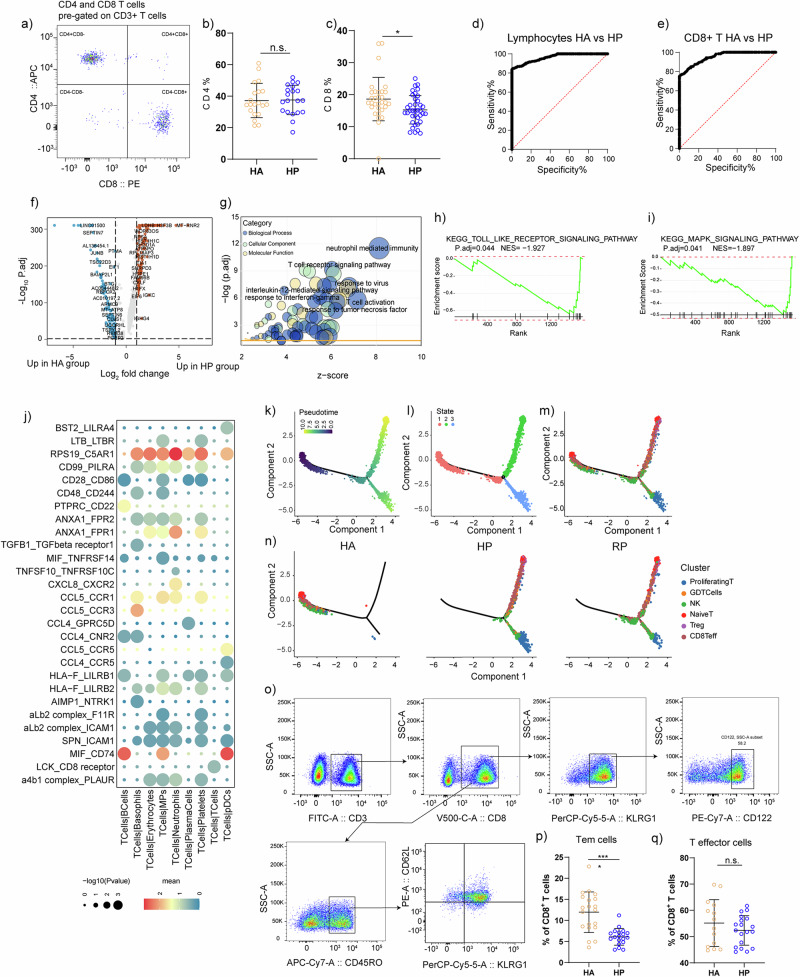
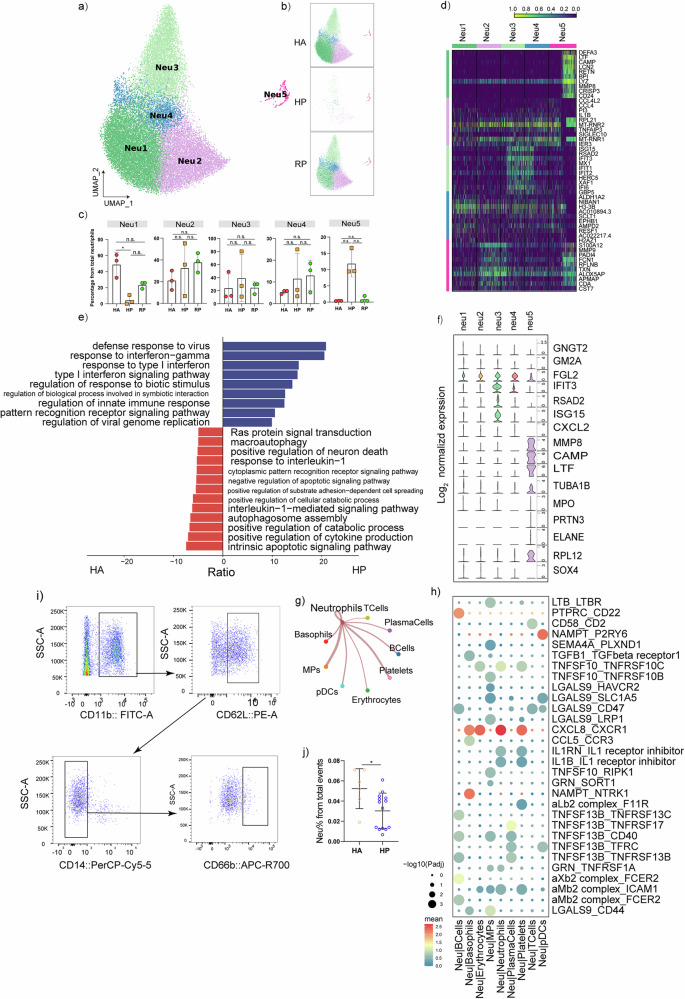
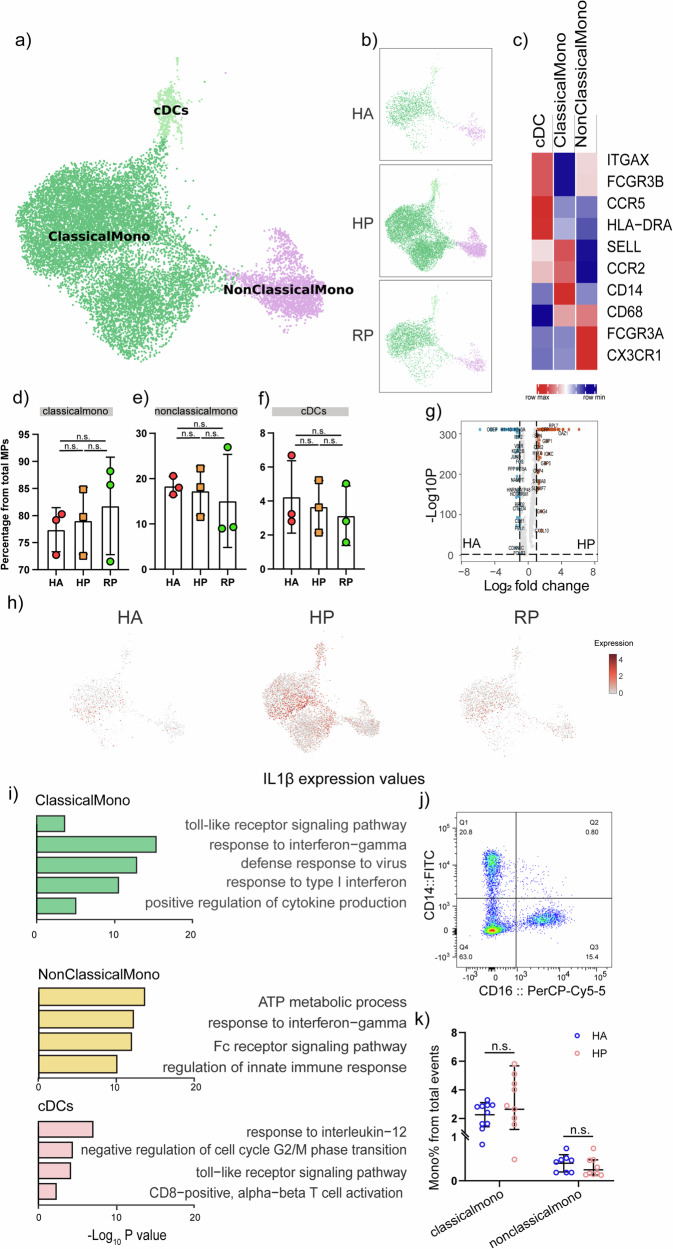
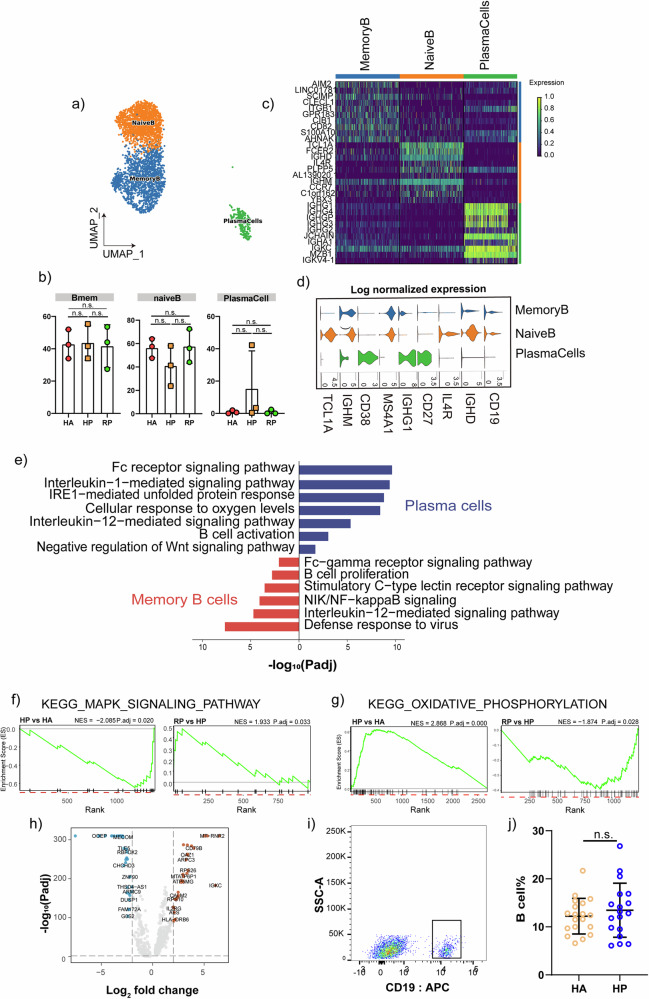
To gain deeper insights into pathogenesis of herpes zoster, the peripheral blood mononuclear cells (PBMCs) from male patients mostly were subjected to single-cell RNA-seq (scRNA-seq) and ATAC-seq analysis. Here we show a detailed immune cell profile in the onset of and recovery from herpes zoster, revealing proportion alterations of the subpopulations, which were validated by flow cytometric analysis and comparison of blood routine data. The integrative analysis of the transcriptomes and epigenomes provided a comprehensive description and validation of the key changes in peripheral blood. This study may provide deep insight into the immune profile during herpes zoster progression and holds potential clinical significance.


Conflict of interest statement

Competing interests: The authors declare no competing interests.

Figures

Fig. 1
Fig. 1. Study design and analysis of single immune cell profiling in the onset of and recovery from herpes zoster.
a Schematics of the experimental design for single-cell RNA (sc-RNA) sequencing. Peripheral blood mononuclear cells (PBMCs) were processed via sc-RNA sequencing using the 10x-Based Genomics platform after collected from herpes zoster patients (HP), herpes zoster patients after recovery (RP) and healthy controls (HA). b UMAP plot showing eight subpopulations of PBMCs including neutrophils, MPs, plasma cells, T cells, B cells, basophils, CDCs, platelets and erythrocytes identified using integrated and classification analysis. c The heatmaps show differentially expressed genes (DEGs) upregulated in eight subpopulations of PBMCs. d UMAP projection of canonical markers, including CD3E, CD4, CD8A, and NCAM1 for NK and T cells; CD14, CD1C, and FCGR3A for myeloid cells; and CD19 for B cells as indicated in the legend.
Fig. 2
Fig. 2. An overview of NK and T, B, and myeloid cells in the blood of three groups.
a The UMAP plot shows a comparison of the clustering distribution across HCs as well as herpes zoster patients (HP) and herpes zoster patients (RP) patients. b The bar plot shows the relative contributions of eight subpopulations by samples, including three HAs, three HP patients, and three RP patients. c The box diagram shows the percentages of myeloid, NK and T, and B cells across the three groups. d The heatmap shows the DEGs of B cells among the HAs, herpes zoster patients (HP) and herpes zoster patients (RP) patients. e The heatmap shows the DEGs of MPs among the HAs, herpes zoster patients (HP) and herpes zoster patients (RP) patients. f The heatmap shows the DEGs of neutrophils among the HAs, herpes zoster patients (HP) and herpes zoster patients (RP) patients. g The heatmap shows the DEGs of T cells among the HAs, herpes zoster patients (HP) and herpes zoster patients (RP) patients. hk Blood routine analysis of the numbers and frequencies of monocytes and lymphocyte from HA and herpes zoster patients. Unpaired t-test were used and the data represent the means ± SEM. ***P < 0. 001, ****P < 0. 0001.
Fig. 3
Fig. 3. Integrated analysis of scRNA seq and ATAC-seq at bulk level.
a Strategy to integrated analysis DEGs and DARs at bulk level. b Gene-OCR pairs determined by log2(fold change) of scRNA-seq and ATAC-seq at the bulk level. c The top 8 motifs motif analysis of the up-regulated Peaks and the predicted motif-related key transcription factors are shown. d Genome browser showing bulk-level ATAC-seq results for OCRs corresponding to key genes enriched in scRNA-seq analysis between HA and HP are displayed. e GO analysis of biological processes related to more open chromatin regions and less open chromatin regions. KEGG analysis of biological processes related to f more open chromatin regions and g less open chromatin regions.
Fig. 4
Fig. 4. Characterization of T and NK cell states in the blood of patients with herpes zoster.
a Three clusters of T and NK cell were displayed according to marker gene expression levels. Uniform manifold approximation and projection (UMAP) presentation of the heterogeneous clusters of T and NK cell, proliferating T cells, GDT cells, NK cell, CD4 naïve T cells, CD8 naïve T cells, CD8 Teff cells, CD8 Tem cells and Tregs. b Heatmap of subtype-specific marker genes of T and NK cell, including CD3E, CD8A, CD279, GZMK, CD2, CD137, TNFRSF4, CD5, CD44, ICOS, CD28, CD27, IL7R, BTLA, SEELL, CCR7, CD69, PTPRC, CCL5, CCL4, GZMA, KLRG1, LAG3, IFNG, PRF1, GZMB, TBX21, CCL3, HAVCR2 and CD7. c The UAMP plot shows the distribution of the eight subpopulations across HA, HP and RP group. d Box diagram of the relative frequencies of eight subpopulations across HA, HP and RP group.
Fig. 5
Fig. 5. Validation for CD8+ T cell subpopulations.
a Representative cytometric gating strategy for identification of T lymphocytes. b Proportion of peripheral CD4 T cell in HP and HA groups. c Proportion of peripheral CD8 T cell in HP and HA groups. d ROC curve for CD3+ T lymphocyte to separate hp from HA. AUC = 0.96. AUC, area under curve. e ROC curve for CD8+ T lymphocyte to separate hp from HA. AUC = 0.95. AUC, area under curve. f Volcano plot for comparison of HP vs. HA group in CD8 Teff cluster. g Bubble chart for GO enrichment analysis of the DEGs of CD8 Teff cluster upregulated in HP patients. P value was derived by a hypergeometric test. h GSEA plot for selected pathway positively enriched in CD8+ Teff cell cluster. i GSEA plot for selected signaling pathway positively enriched in CD8+ Teff cell cluster. j Heatmaps showing the top 30 cell–cell interactions in the scRNA-seq dataset of T cells, as inferred by CellPhoneDB. km Pseudotime trajectories to show the alignment of neutrophil subpopulations. Cells were colored by Pseudotime (k) subpopulation (l) or time (m). o Representative cytometric gating strategy for identification of CD8+ T lymphocytes. p Proportion of peripheral CD8 Tem cells in HP and HA groups. q Proportion of peripheral CD8 Teff cells in HP and HA groups.
Fig. 6
Fig. 6. Characterization of neutrophils in patients with herpes zoster.
a Five clusters of neutrophils were displayed according to marker gene expression levels. Uniform manifold approximation and projection (UMAP) presentation of the heterogeneous clusters of neutrophils. b The UAMP plot shows the distribution of the five subpopulations across HA, HP and RP group. c Box diagram of the relative frequencies of five subpopulations across HA, HP and RP group. d The heatmap shows the DEGs of five neutrophils subpopulations. e GO BP enrichment analysis for the DEGs of neutrophils in HP patients. The red terms represent upregulated terms, and the blue represent downregulated terms. P value was derived by a hypergeometric test. f Violin plot of subtype-specific marker genes of neutrophils, including GNGT2, GM2A, FGL2, IFIT3, RSAD2, ISG15, CXCL2, MMP8, CAMP, LTF, TUBA1B, MPO, PRTN3, ELANE, RPL12 and SOX4. g Network diagram of receptor-ligand interaction pairs between neutrophils and other cell types. Network nodes are cell types, network edge thickness is the total number of ligand-receptor pairs, and line color is consistent with ligand cell type. h Heatmaps showing the top 30 cell–cell interactions in the scRNA-seq dataset of T cells, as inferred by CellPhoneDB. i Representative cytometric gating strategy for identification of neutrophils. j Proportion of peripheral neutrophils in HP and HA groups.
Fig. 7
Fig. 7. Myeloid cell subsets and their states in the blood of patients with herpes zoster.
a Three clusters of myeloid cells were displayed according to marker gene expression levels. Uniform manifold approximation and projection (UMAP) presentation of the heterogeneous clusters of peripheral myeloid cells, Classical CD14++CD16− monocytes, non-classical CD14+CD16++ monocytes and cDCs. b The UAMP plot shows the distribution of the eight subpopulations across HA, HP and RP group. c Heatmap of subtype-specific marker genes of myeloid cells, including ITGAX, FCGR3B, CCR5, HLA-DRA, SELL, CCR2, CD14, CD68, FCGR3A and CX3CR1. d Box diagram of the relative frequencies of classical monocyte across HA, HP and RP group. e Box diagram of the relative frequencies of nonclassical monocyte across HA, HP and RP group. f Box diagram of the relative frequencies of cDCs across HA, HP and RP group. g Volcano plot for comparison of HP vs. HA group in classical monocyte cluster. h The UAMP plot shows that IL-1β was highly expressed in the HP patients compared with the RP patients and HCs in MPs. i GO BP enrichment analysis of the DEGs of the three subpopulations upregulated in HP patients. P value was derived by a hypergeometric test. j Representative cytometric gating strategy for identification of classical monocytes and nonclassical monocytes. k Proportion of peripheral classical monocytes and nonclassical monocytes in HP and HA groups.
Fig. 8
Fig. 8. Characterization of B cells in patients with herpes zoster.
a Three clusters of b cells were displayed according to marker gene expression levels. Uniform manifold approximation and projection (UMAP) presentation of the heterogeneous clusters of peripheral b cells, memory b cells, naïve b cells and plasma cells. b The bar plot shows the relative contributions of three subpopulations by samples, including the HA, HP and RP group. c The heatmap shows the DEGs of b cells between the HAs and herpes zoster patients (HP). d violin plot of subtype-specific marker genes of b cells, including CD19, IGHD, IL4R, CD27, IGHG1, MS4A1, CD38, IGHM and TCL1A. e GO BP enrichment analysis for the DEGs of memory b cell and plasma cells upregulated in HP patients. P value was derived by a hypergeometric test. f GSEA plot for selected pathway positively enriched in b cell cluster. g GSEA plot for selected signaling pathway positively enriched in b cell cluster. h Volcano plot for comparison of HP vs. HA group in b cell cluster. i Representative cytometric gating strategy for identification of b cells. j Proportion of peripheral b cells in HP and HA groups.

Similar articles

References

    1. Cohen, E. J. & Jeng, B. H. Herpes Zoster: A Brief Definitive Review. Cornea40, 943–949 (2021). - PMC - PubMed
    1. Harpaz, R., Leung, J. W. The Epidemiology of Herpes Zoster in the United States During the Era of Varicella and Herpes Zoster Vaccines: Changing Patterns Among Older Adults. Clin. Infect. Dis., 10.1093/cid/ciy953/5213085 (2018). - PubMed
    1. Rafael Harpaz, J. W. L. The Epidemiology of Herpes Zoster in the United States During the Era of Varicella and Herpes Zoster Vaccines: Changing Patterns Among Children. Clin. Infect. Dis., 10.1093/cid/ciy954/5213086 (2018). - PubMed
    1. Chen, M.-H. et al. Risk of depressive disorder among patients with herpes zoster: a nationwide population-based prospective study. Psychosom. Med.76, 285–291 (2014). - PubMed
    1. Jeon, Y. H. Herpes Zoster and Postherpetic Neuralgia: Practical Consideration for Prevention and Treatment. Korean J. Pain.28, 177–184 (2015). - PMC - PubMed

LinkOut - more resources