. 2024 Dec 4;14(1):30188.
doi: 10.1038/s41598-024-80672-z.

Pelophen B is a non-taxoid binding microtubule-stabilizing agent with promising preclinical anticancer properties

Affiliations

Pelophen B is a non-taxoid binding microtubule-stabilizing agent with promising preclinical anticancer properties

Stephanie Vermeulen et al. Sci Rep. .

Abstract

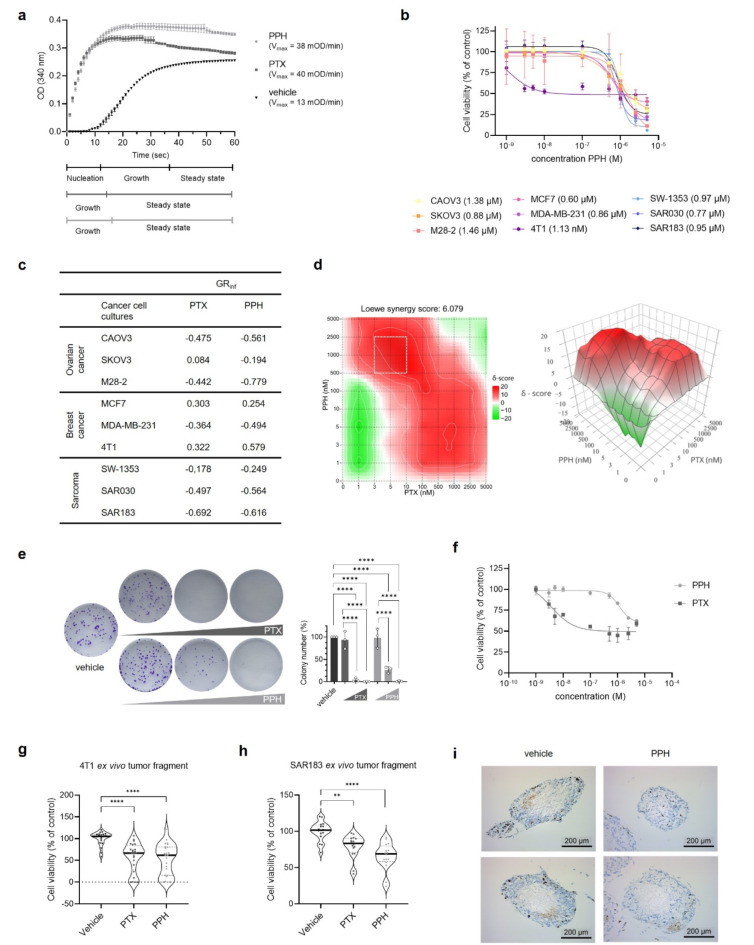
Taxanes, such as paclitaxel (PTX), stabilize microtubules and are used as a first-line therapy in multiple cancer types. Disruption of microtubule equilibrium, which plays an essential role in mitosis and cell homeostasis, ultimately results in cell death. Even though PTX is a very potent chemotherapy, its use is associated with major side effects and therapy resistance. Pelophen B (PPH), a synthetic analog of peloruside A, stabilizes microtubules through interaction with a non-taxoid binding site of β-tubulin. We evaluated the anticancer effect of PPH in a variety of tumor types by using established cell lines, early-passage cultures and ex vivo tumor-derived cultures that preserve the 3D architecture of the tumor microenvironment. PPH significantly blocks colony formation capacity, reduces viability and exerts additivity with PTX. Interestingly, PPH overcomes resistance to PTX. Mechanistically, PPH induces a G2/M cell cycle arrest and increases the presence of tubulin polymerization promoting protein (TPPP), inducing lysine 40 acetylation of α-tubulin. Although, results induced by paclitaxel or PPH are concordant, PPH's unique microtubule binding mechanism enables PTX additivity and ensures overcoming PTX-induced resistance. In conclusion, PPH results in remarkable anti-cancer activity in a range of preclinical models supporting further clinical investigation of PPH as a therapeutic anticancer agent.

Keywords: Breast cancer; Microtubule-stabilizing agent; Ovarian cancer; Paclitaxel; Pelophen B; Sarcoma.


Conflict of interest statement

Declarations. Competing interests: Johan Vander Eycken is patentholder of Pelophen B (PCT/EP2014/075903). All other authors declare no competing interests. Ethics approval and consent to participate: Informed consent of patients to use tumor material was obtained after the study protocol was approved by the institutional review board of the Ghent University Hospital (EC 2018/0080 and ONZ-2022–0345, EC 2019/1869 and ONZ-2023-0502). All animal experiments were approved by the local ethics committee (ECD 19-45 and ECD 19-86, Ghent University Hospital). All animal experiments were conducted in accordance with the regulatory guidelines of the Ethics Committee of Ghent University Hospital and the ARRIVE guidelines.

Figures

Fig. 1
Fig. 1
Binding site of PPH and chemical structure of PLA and PPH. (a) Microtubules are composed of α- and β-tubulin dimers. PTX binds on the luminal side of β-tubulin while PPH binds on the laulimalide/peloruside binding site on the microtubule surface. Lysine 40 acetylation (K40 Ac) of α-tubulin leads to stabilization of polymerized microtubules. Created with BioRender.com. (b) Chemical structure of PLA. (c) Chemical structure of PPH.
Fig. 2
Fig. 2
PPH has antiproliferative activity in vitro and ex vivo. (a) Time-lapse tubulin polymerization assay showing PTX (5 µM) and PPH (5 µM) induce polymerization of microtubules in vitro and eliminate the nucleation phase. Data represent mean ± SD of three independent experiments. Statistical significance between groups was determined with one-way ANOVA and Tukey’s multiple comparisons test. (b) 3-day PPH treatment dose-dependently inhibits growth of cancer cell cultures with EC50 values in the low micromolar range indicated between brackets. (c) GRinf represents the normalized growth rate inhibition of the drug at infinite concentration and shows a cytotoxic effect (GRinf < 0), cytostatic (GRinf = 0) or partial growth inhibition (GRinf > 0) dependent on cell type. (d) Combining PTX and PPH leads to an additive effect in SKOV3 cells. Heatmap represents mean of 3 biological replicates (N = 3). δ-score < -10: antagonistic effect, -10 < δ-score < 10 additive effect, 10 < δ-score synergistic effect. Dotted square in 2-dimensional heatmap indicates the most synergistic area. (e) PPH reduces colony forming capacity of SKOV3 cells. Cells were treated with PTX (1 nM, 3 nM and 10 nM) or PPH (0.1 µM, 1 µM and 2.5 µM) . Samples were normalized to vehicle control. Bar plot represents mean ± SD of three biologically independent experiments. Statistical significance between groups was determined with one-way ANOVA and Tukey’s multiple comparisons test. (f) EC50 curve showing dose-dependent reduction in metabolic activity of SKOV3 spheroids after 5-day treatment with PTX or PPH. EC50 curve represents mean ± SD of two biologically independent experiments (N = 2) with each 3 technical replicates (n = 3). (g,h) Violin plot indicating the reduction in metabolic activity following 5 days of ex vivo treatment with PTX (0.1 µM) or PPH (50 µM) of 4T1 tumor fragments (g, n = 24) or soft tissue sarcoma (SAR183) (h, n = 16). Statistical significance between groups was determined with a Kruskal–Wallis test and Dunn’s multiple comparisons test. (i) Immunohistochemical Ki67 staining of ex vivo cultured 4T1 tumor fragments after 5 days of ex vivo treatment with PPH (50 µM). Images represent technical replicates. Levels of statistical significance are indicated as * P ≤ 0.05, ** P ≤ 0.01, *** P ≤ 0.001, **** P < 0.0001. DMSO was used as vehicle control.
Fig. 3
Fig. 3
Mechanism of action of PPH. (a) PTX (3 nM) and PPH (1 µM) induce rounding of MCF7 breast cancer cells 24h post-treatment. White arrows indicate the rounded cells. Each biological replicate is represented with a different symbol (N = 3) and each symbol is a technical replicate (n = 3). Statistical significance between groups was determined with Kruskall Wallis test and Dunn’s multiple comparisons test. (b) 24-h treatment with PTX (100 nM) or PPH (5 µM) induces a G2/M cell cycle arrest in MCF7 breast cancer cells. Bar plot represents mean ± SD of three biologically independent experiments. Statistical significance between groups was determined with one-way ANOVA and Tukey’s multiple comparisons test. (c,d) Volcano plot depicting the differentially abundant proteins in SKOV3 spheroids after 5-day treatment with PPH (1 µM) (c) or PTX (4 nM) (d) compared to vehicle control. The vertical dotted red lines indicate a log2 fold change > 1. The horizontal dotted red line indicates a p-value = 0.05 (log10 adjusted p-value 1.30). Proteins are labelled with their corresponding gene names. Data are representative of the mean of six biological replicates (N = 6). (e) Graphs representing the upregulation of biological processes in vehicle treated spheroids versus PPH treated spheroids (top) or PPH treated spheroids versus vehicle treated spheroids (bottom) based on mass-spectometry assisted proteomics analysis and analysis with g:Profiler. (f,g) Heatmap of differentially regulated genes involved in cell cycling (GO: 0007049) (f) or microtubule-based processes (GO:0007017) (g) after PTX or PPH treatment versus vehicle control spheroids. (h) 24-h treatment with PTX (100 nM) or PPH (2.5 µm) of SKOV3 cells induces Lysine 40 acetylation (K40 Ac) of α-tubulin. GAPDH was used as loading control. Representative images from three biologically independent replicates are shown. Uncropped blots are shown in Supplementary Figure S5. Bar plot represents mean ± SD of three biologically independent experiments. Statistical significance between groups was determined with one-way ANOVA and Tukey’s multiple comparisons test. (i) Immunohistochemical K40 Ac of α-tubulin staining of ex vivo 4T1 tumor fragments after 5-day treatment with 100 nM PTX or 50 µM PPH. Levels of statistical significance are indicated as * P ≤ 0.05, ** P ≤ 0.01, *** P ≤ 0.001, **** P < 0.0001. DMSO was used as vehicle control.
Fig. 4
Fig. 4
PPH overcomes PTX resistance. (a) PTX resistant phenotype of SKOV3 cells is confirmed by the increase of the EC50 value for PTX in SKOV3 PTX resistant cancer cells compared to parental SKOV3 cells. EC50 curve represents mean ± SD of three biologically independent experiments (N = 3) with each three technical replicates (n = 3). (b) PPH reduces viability of PTX resistant SKOV3 cells. EC50 curve represents mean ± SD of three biologically independent experiments (N = 3) with each three technical replicates (n = 3). (c,d) Real-time analysis of cell confluency of SKOV3 PTX resistant cells following PPH treatment. Microscopic pictures were taken every 6h and cell confluency was analyzed using IncuCyte software (indicated by yellow mask). Cell confluency curve represents mean ± SD of three biologically independent experiments (N = 3) with each 3 technical replicates (n = 3). Pictures are representative of three independent experiments. (e) Representative images and quantification of colony formation assay for SKOV3 PTX-resistant cells treated with PTX (1 nM, 3 nM and 10 nM) or PPH (0.1 µM, 1 µM and 2.5 µM) showing PPH overcomes PTX resistance. Samples were normalized to vehicle control (DMSO). Bar plot represents mean ± SD of three biologically independent experiments. Statistical significance between groups was determined with one-way ANOVA and Tukey’s multiple comparisons test. (f) Violin plot indicating the impact of 5-day treatment with PTX (0.1 µM) or PPH (50 µM) on ATP content of HGSOC ex vivo cultured tumor fragments. DMSO was used as vehicle control. Each symbol is a technical replicate (n = 22). Statistical significance between groups was determined with a Kruskal–Wallis test and Dunn’s multiple comparisons test. (g) Immunohistochemical K40 Ac of α-tubulin staining of ex vivo cultured patient-derived HGSOC tumor fragments after 5 days of PPH treatment (50 µM). Levels of statistical significance are indicated as * P ≤ 0.05, ** P ≤ 0.01, *** P ≤ 0.001, **** P < 0.0001. RI = resistance index. DMSO was used as vehicle control.

References

    1. Jordan, M. A. & Wilson, L. Microtubules as a target for anticancer drugs. Nat. Rev. Cancer4, 253–265 (2004). - PubMed
    1. Yang, C. P. H. & Horwitz, S. B. Taxol®: The first microtubule stabilizing agent. Int. J. Mol. Sci.18, 1733 (2017). - PMC - PubMed
    1. Tian, Z. & Yao, W. Albumin-bound paclitaxel: Worthy of further study in sarcomas. Front. Oncol.12, 815900 (2022). - PMC - PubMed
    1. Bray, F. et al. Global cancer statistics 2022: GLOBOCAN estimates of incidence and mortality worldwide for 36 cancers in 185 countries. CA Cancer J. Clin.74, 229–263 (2024). - PubMed
    1. Siegel, R. L., Giaquinto, A. N. & Jemal, A. Cancer statistics, 2024. CA Cancer J. Clin.74, 12–49 (2024). - PubMed

MeSH terms

LinkOut - more resources