. 2025 Jan;26(2):443-469.
doi: 10.1038/s44319-024-00335-y. Epub 2024 Dec 4.

Rarγ-Foxa1 signaling promotes luminal identity in prostate progenitors and is disrupted in prostate cancer

Affiliations

Rarγ-Foxa1 signaling promotes luminal identity in prostate progenitors and is disrupted in prostate cancer

Dario De Felice et al. EMBO Rep. 2025 Jan.

Abstract

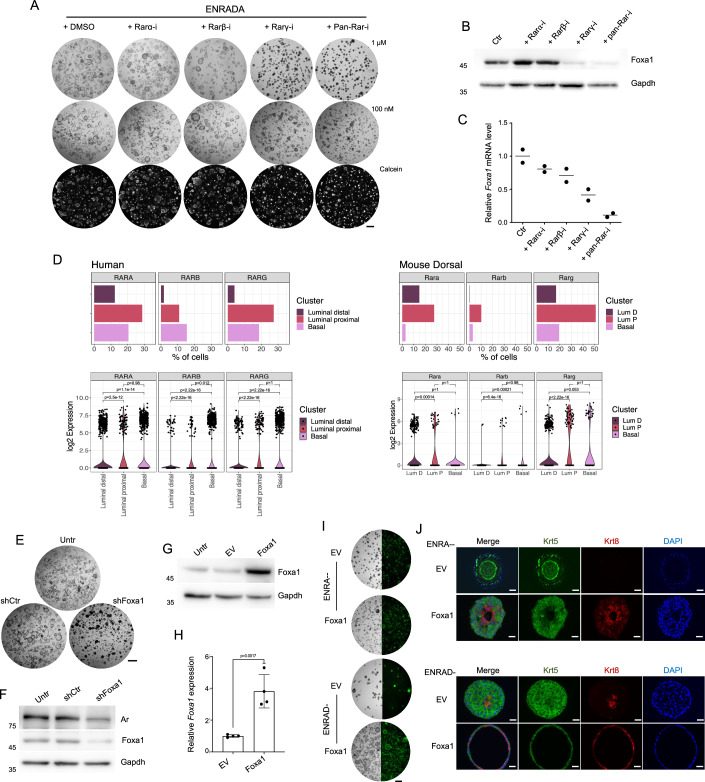
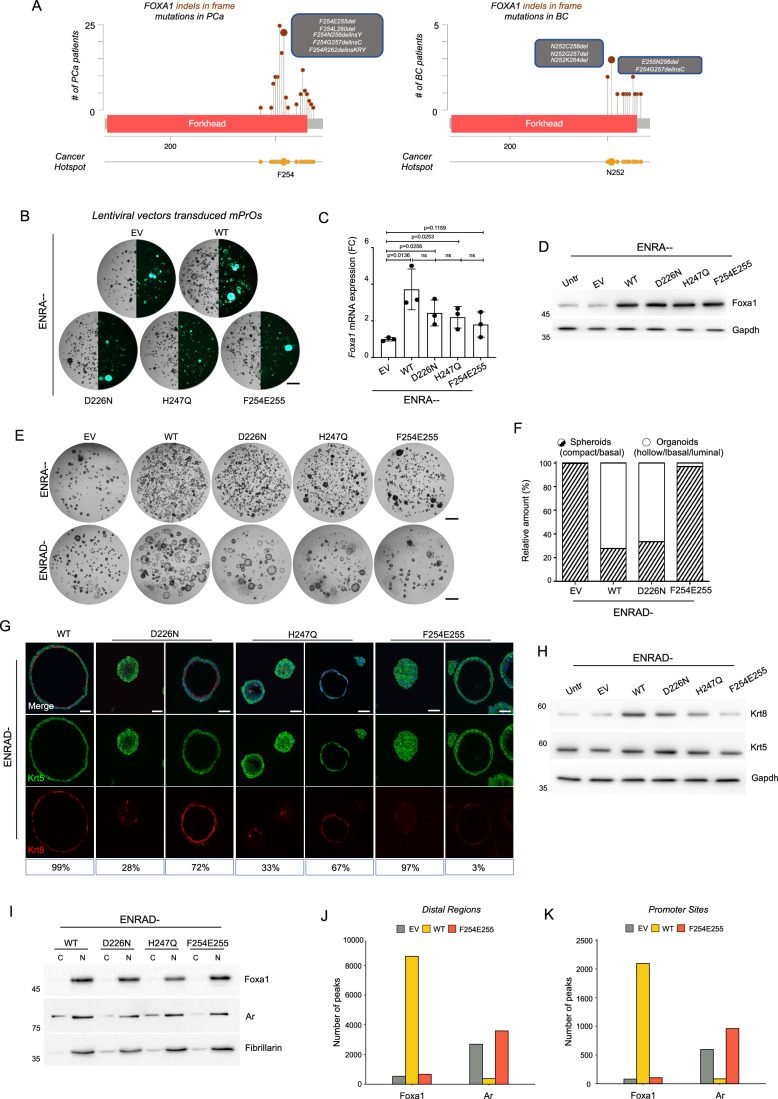
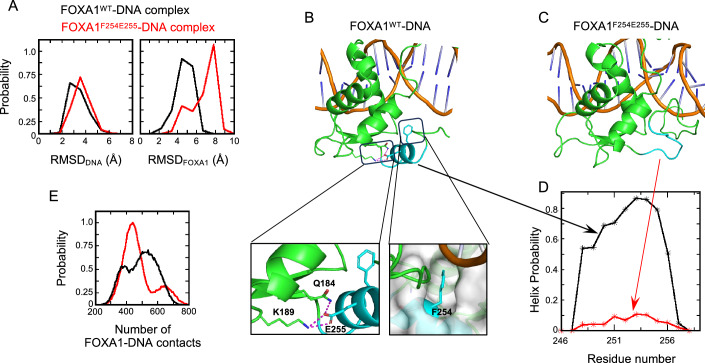
Retinoic acid (RA) signaling is a master regulator of vertebrate development with crucial roles in body axis orientation and tissue differentiation, including in the reproductive system. However, a mechanistic understanding of how RA signaling governs cell lineage identity is often missing. Here, leveraging prostate organoid technology, we show that RA signaling orchestrates the commitment of adult mouse prostate progenitors to glandular identity, epithelial barrier integrity, and specification of prostatic lumen. RA-dependent RARγ activation promotes the expression of Foxa1, which synergizes with the androgen pathway for luminal expansion, cytoarchitecture and function. FOXA1 mutations are common in prostate and breast cancers, though their pathogenic mechanism is incompletely understood. Combining functional genetics with structural modeling of FOXA1 folding and chromatin binding analyses, we discover that FOXA1F254E255 is a loss-of-function mutation compromising its transcriptional function and luminal fate commitment of prostate progenitors. Overall, we define RA as an instructive signal for glandular identity in adult prostate progenitors. Importantly, we identify cancer-associated FOXA1 indels affecting residue F254 as loss-of-function mutations promoting dedifferentiation of adult prostate progenitors.

Keywords: FOXA1; Organoids; Prostate; Retinoic Acid.


Conflict of interest statement

Disclosure and competing interests statement. FCh is a consultant for Dompè Pharmaceuticals SPA (not related to this work). All other authors declare no competing interests.

Figures

Figure 1
Figure 1. Retinoic acid promotes prostate-like cytoarchitecture and lumen formation in prostate organoids cooperating with androgen signaling.
(A) Schematic overview of the procedure for establishing mPrOs (adapted from Karthaus et al, 2014). (B) Representative stereoscopic images of the mixed organoid population at different days of culture, scale bar: 1 mm. Magnifications (2x) are shown in the lower panels. Scale bars, 500 μm. N > 3 independent biological replicates. (C) Immunofluorescence staining of basal (Krt5) and luminal (Krt8) cytokeratins in mPrOs and mouse prostate tissue. Cell nuclei are stained with DAPI. Scale bars, mPrOs 50 μm; prostate 500 μm. Magnification of the selected area are shown. Scale bars, mPrOs 20 μm, prostate 200 μm. N > 3 independent biological replicates. (D) Representative stereoscopic images (left) and quantification (right) of mPrOs cultured in medium conditioned with different concentrations of ATRA (B27zero = 0 nM, B27 = 6 nM, B27plus = 16 nM; a minimum of 100 organoids/dome x 3 domes were counted for each condition; large mPrOs, diameter >250 μm). Scale bar, 1 mm. Data are presented as mean value ± s.d. of n = 3 independent biological replicates. Unpaired t-test, p < 0.05 was considered statistically significant. (E) Representative stereoscopic images (left) and quantitative phenotypic comparison (right) of mPrOs cultured with or without ATRA. Scale bar, 1 mm. Data are presented as mean value ± s.d. of n = 3 independent biological replicates. Paired t-test, p < 0.05 was considered statistically significant. (F) Representative stereoscopic images and immunofluorescence analysis of Krt5, Krt8, Ar, Zo-1 (Tjp1), Zo-3 (Tjp3), Cldn4, and Cldn7 expression and localization in mPrOs cultured with or without DHT, ATRA or both. Scale bars, 100 μm; n = 2 independent biological replicates. Magnification (10x) of immunostaining of mPrOs cultured in presence of DHT and ATRA (ENRADA medium) are shown to pointing out protein localization. (G, H) Representative stereoscopic images (G) and quantitative analysis (H) of mPrOs morphology upon administration, or withdrawal, of DHT and ATRA. Scale bars, 1 mm. Data are presented as mean value ± s.d. of n = 3 independent biological replicates. Unpaired t-test, p < 0.05 was considered statistically significant. Source data are available online for this figure.
Figure 2
Figure 2. Retinoic acid signaling promotes Foxa1 expression in adult prostate progenitors.
(A) Scatter plot representing the changes in gene expressions in mPrOs grown for 6 days in ENRAD or ENRADA conditions. The number of significant up (log2FC > 1, orange) and down (log2FC < −1, light blue) regulated genes is indicated as N in the figure. Significance is assigned if the gene has an adj. p-value lower than 0.05 (Wald test followed by the Benjamini–Hochberg multiple test correction, default in DESeq2). Red arrow indicates Foxa1. (B, C) Representative Western blot analysis of Foxa1 expression in mPrOs upon administration for 6 days (B) and successive withdrawal for 6 days (C) of ATRA and DHT individually or in combination. Gapdh is used as loading control. N = 3 independent biological replicates. (D) Representative Western blot analysis of Ar and Foxa1 expression in mPrOs grown for 6 days with or without DHT (10 nM), ATRA (at different concentrations), and Enzalutamide (ENZA, 10 μM). Gapdh is used as loading control. N = 3 independent biological replicates. (E) Volcano plots representing the changes in gene expressions in mPrOs grown for 6 days in indicated media. Members of the Fox family of transcription factors are indicated among the significant up (orange) and down (light blue) regulated genes. Significance is assigned if the gene has an adj. p-value lower than 0.05 (Wald test followed by the Benjamini–Hochberg multiple test correction, default in DESeq2). Source data are available online for this figure.
Figure 3
Figure 3. A Rarγ-Foxa1 transcriptional cascade is essential for the retinoic acid control of glandular identity in adult prostate progenitors.
(A) mPrOs morphology upon administration of RARs inhibitors at different concentrations (upper and middle panels). Calcein staining determines mPrOs viability (lower panels). Scale bars, 1 mm. N = 3 independent biological replicates. (B) Representative Western blot analysis of Foxa1 expression in mPrOs treated with the different RAR inhibitors for 6 days. Gapdh is used as loading control. N = 3 independent biological replicates. (C) RT-qPCR analysis of Foxa1 expression in mPrOs treated with the RARs inhibitors. Data are presented as mean value ± s.d. of n = 2 independent biological replicates (Ctr, mean = 1; Rarα-i, mean = 0.8; Rarβ-i, mean = 0.71; Rarγ-i, mean = 0.41; pan-Rar-i, mean = 0.11). (D) Percentage of cells (bar plots) and expression levels (violin plots) of, RARα RARβ, and RARγ genes in epithelial cell populations of human and mouse normal prostate (Data ref: Crowley et al, ; Appendix Fig. S2). The p-values were calculated with the Mann–Whitney U Test. (E, F) Phenotypic response of mPrOs cultured in ENRADA to Foxa1 knock-down. Scale bar, 1 mm (E). Western blot showing reduction of Foxa1 and Ar level in mPrOs stably transduced with shRNAs against Foxa1 (F). Untransduced mPrOs and mPrOs expressing not targeting shRNAs (shCtr) are used as controls. Gapdh is used as loading control. N = 3 independent biological replicates. (G, H) Western blot analysis of Foxa1 expression in mPrOs grown without DHT and ATRA (ENRA--) untransduced (Untr), stably transduced with an empty vector (EV) or with a vector expressing mouse Foxa1 (Foxa1). Gapdh is used as loading control (G). RT-qPCR analysis of Foxa1 RNA expression in EV and Foxa1 mPrOs cultured in ENRA-- medium (H). Data are presented as mean value ± s.d. of n = 4 independent biological replicates. Unpaired t-test, p < 0.05 was considered statistically significant. (I, J) Morphological comparison of wild-type and transduced (EV and Foxa1) mPrOs cultured without ATRA and with or without DHT (ENRAD-, ENRA--) (I). Scale bar, 1 mm. N > 3 independent biological replicates. Immunofluorescence analysis of Krt5 (basal) and Krt8 (luminal) markers in the different conditions. Nuclei are stained with DAPI (J). Scale bar 50 μm. Source data are available online for this figure.
Figure 4
Figure 4. Foxa1 occupies distal and promoter elements of key luminal progenitor genes and reshape androgen receptor binding genome-wide.
(A) Schematic representation of the cross-comparison study of RNA-seq analysis performed in this study and published ChIP-seq datasets (Adams et al, 2019). (B) Venn diagram showing the binding sites of Ar and Foxa1 in the genome of mPrOs expressing endogenous (empty vector, EV) or exogenous (Foxa1) Foxa1. Distal elements (±2.5 kb away from an annotated gene promoter) are displayed on the left, whereas promoter sites are shown on the right. ChIP-seq data are from Adams et al, (n = 2 replicates per condition). (CF) Numerical (C and E) and graphical (D and F) representation of Foxa1 and Ar cistromes at both distal (DE) and promoter (PE) elements with endogenous levels of Foxa1 (EV (0)) and upon its overexpression (Foxa1 (1)). The number of de novo and pre-existing but rearranged PE/DE sites are indicated in red. (G) Percentage overlap of ChIP-seq promoter elements (PE)-associated Genes (Adams et al, 2019) with Upregulated and Downregulated DEGs from RNA-seq (comparison ENRADA vs ENRAD-, this work). The significance of the overlap has been determined by a hypergeometric test. Each bar represents a set of genes (e.g., n = 1694) associated to a specific class of PE (e.g., de novo Foxa1-bound PE, F1). (H) Venn diagrams showing the overlap of differentially expressed genes in mPrOs cultured in ENRADA versus ENRAD, and exogenous Foxa1-bound promoter elements (PE (F1)) in the genome. Relevant upregulated genes in the intersection are highlighted. (I) Genomic snapshot of ChIP-seq (n = 2 pooled replicates) and RNA-seq (n = 3 pooled replicates) signals over the selected gene Cldn4.
Figure 5
Figure 5. The hotspot Foxa1F254E255 prostate cancer mutation is unable to promote luminal identity in prostate progenitors.
(A) Indels mutations of the alpha-helix region at the C-terminal part of the Forkhead domain of FOXA1 identified in prostate (left) and breast (right) cancers (cBioportal/Cosmic databases). (BD) Brightfield and fluorescence images of mPrOs grown without ATRA and DHT (ENRA--) expressing wild-type Foxa1 or its mutant forms D226N, H247Q, or F254E255. mPrOs transduced with the empty vector (EV) were used as controls (B). Scale bar, 1 mm. RT-qPCR analysis of Foxa1 RNA expression in transduced mPrOs cultured in ENRA-- medium (C). Western blot analysis of Foxa1 protein levels in transduced mPrOs (D). Gapdh is used as loading control. Data are presented as mean value ± s.d. of n = 3 independent biological replicates. Unpaired t-test, p < 0.05 was considered statistically significant. (E, F) Morphological analysis of mPrOs transduced with Foxa1 variants upon re-administration of DHT (E) and quantification of compact versus hollow organoids (F). Scale bars: 1 mm. N = 2 independent biological replicates. (G, H) Immunofluorescence (G) and Western blot (H) analyses of Krt5 (basal) and Krt8 (luminal) markers in mPrOs cultured in presence of DHT but not ATRA (ENRAD-) and expressing exogenous wild-type Foxa1 or its mutant forms. Gapdh is used as loading control. Scale bar, 50 μm. N = 3 independent biological replicates. (I) Biochemical fractionation of nuclear (N) and cytosolic (C) compartments showing nuclear localization of wild type and mutant form of Foxa1. Ar and Fibrillarin are used as nuclear markers and loading controls. (J, K) Number of peaks identified by ChIP-seq in distal regions (J) and gene promoters (K) for Foxa1 and Ar in mPrOs stably transduced with wild-type Foxa1 (WT), Foxa1F254E255 (F254E255) or the empty vector (EV) and cultured with DHT but not ATRA, as reported in Adams et al, . Source data are available online for this figure.
Figure 6
Figure 6. Molecular modeling of the FOXA1F254E255 FKHD domain is consistent with impaired DNA binding ability.
(A) Distribution of Root Mean Squared Deviation (RMSD) of conformations of FOXA1WT–DNA (black) and FOXA1F254E255–DNA (red) sampled during aMD simulations. (B, C) Snapshot from MD simulation highlighting the C-terminal α-helix (cyan) of FKHD of the FOXA1WT–DNA complex (B), which becomes disordered (cyan) in the FOXA1F254E255–DNA complex (C). In the case of the FOXA1WT–DNA complex (B), residues Q184, K189, and E255 are shown as sticks and interactions between them are highlighted in dashed lines (magenta). The residue F254 is shown as sticks and the region around it is shown as surface (gray) highlighting that the sidechain of F254 is buried in the cavity. (D) Distribution of the helix probability (from the MD simulations) of the conformation of the C-terminal α-helix of FKHD of FOXA1 sampled during FOXA1WT–DNA (black) and FOXA1F254E255–DNA (red) complexes. (E) Probability of the number of FOXA1–DNA contacts of FOXA1WT (black) and FOXA1F254E255 (red) (from the MD simulations).
Figure EV1
Figure EV1. Induction of RA signaling-responsive genes and lumen formation by ATRA and DHT treatment in prostate organoids.
(A) Schematic representation of the three main enzymatic steps of retinoid metabolism. (B) RNA-Seq analysis showing differentially expressed genes involved in the retinoid pathway upon single or combined administration of ATRA and DHT to mPrOs cultured in ENRA-- medium. Data are presented as mean value ± s.d. of n = 3 biological independent replicates. The indicated adjusted p-values were calculated with the Wald test followed by the Benjamini–Hochberg multiple test correction (default in DESeq2). (C) mPrOs (C57BL6/J-upper panel and CD1-lower panel) morphology after 6 days of administration of different concentration of ATRA. Scale bar, 1 mm. N > 3 independent biological replicates. (D) Phenotypic analysis of mPrOs cultured with 16 nM ATRA with or without DHT and Enzalutamide. Scale bar, 1 mm. N = 3 independent biological replicates.
Figure EV2
Figure EV2. Transcriptional and phenotypic impact of ATRA treatment in prostate organoids.
(A) Schematic representation of the cross-comparison study of RNA-seq analysis performed in this study (upper panels) and heatmaps displaying the number of DEGs (upregulated, downregulated, and total) for the 6 comparisons between the experimental conditions (ENRA--, ENRAD-, ENRA-A, ENRADA) (lower panels). The number indicated inside each cell of the matrix is a gene count except for the bottom right heatmap, which shows the percentage of DEGs over the total number of expressed genes (N = 17,557). Each cell number is the result of the differential expression analysis between the condition indicated in the row and the one in the column (e.g., 1631 is the number of upregulated genes in the comparison ENRA-A vs ENRA--). Upregulated (log2FC > 1) and downregulated (log2FC < −1) genes are the ones with an adj. p-value lower than 0.05 (Wald test followed by the Benjamini–Hochberg multiple test correction, default in DESeq2). (B) Scatter plots representing the changes in gene expressions in mPrOs grown for 6 days in indicated media. The number of significant up (log2FC > 1, orange) and down (log2FC < −1, light blue) regulated genes is indicated as N in the figure. Significance is assigned if the gene has an adj. p-value lower than 0.05 (Wald test followed by the Benjamini–Hochberg multiple test correction, default in DESeq2). Red arrow indicates Foxa1. (C) RT-qPCR analysis of Foxa1 gene expression in mPrOs keept for 5 day in ENRA-- and treated for 24 h with DHT, ATRA or the combination of both (Data are presented as mean value ± s.d. of n = 3 independent biological replicates, one-way ANOVA *p = 0.022). (D) Heatmap showing the expression of a selected panel of genes in mPrOs kept in the indicated culture conditions (mean of n = 3 biological independent replicates). Hierarchical clustering with average method has been applied on the heatmap rows. Genes are annotated as basal, luminal differentiated, and periurethral (PrU)/luminal progenitor (LumP) based on Crowley et al (2020) single-cell RNA sequencing analysis. Significant differentially expressed genes (DEGs) in the different comparisons are shown in red (upregulated) and turquoise (downregulated). Significance is assigned if the gene has an adj. p-value lower than 0.05 (Wald test followed by the Benjamini–Hochberg multiple test correction, default in DESeq2). (E) Differential expression of luminal marker and tight-junction genes in mPrOs grown under ENRADA, ENRA-A, ENRAD-, or ENRA-- culture conditions. Data are presented as mean value ± s.d. of n = 3 independent biological replicates. The indicated adjusted p-values were calculated with the Wald test followed by the Benjamini–Hochberg multiple test correction (default in DESeq2). (F) Immunofluorescence analysis of Krt5 and Krt8 in mPrOs cultured without DHT and ATRA (ENRA--) or with DHT only (ENRAD). The withe frame marks a peculiar cell morphology noticed only in the absence of ATRA. Scale bars, 100 μm. (G) RNA-seq bar plot representation of late cornified envelope genes (LCE) the expression of which is robustly repressed by RA signaling. Data are presented as mean value ± s.d. of n = 3 independent biological replicates. The indicated adjusted p-values were calculated with the Wald test followed by the Benjamini–Hochberg multiple test correction (default in DESeq2).
Figure EV3
Figure EV3. Molecular and phenotypic impact of modulating RA signaling, AR signaling, and Foxa1 expression in prostate organoids.
(A) Western blot analysis of endogenous Foxa1 expression in mPrOs treated with different amounts of ATRA. Gapdh is used as loading control. N = 2 independent biological replicates. (B) Biochemical fractionation of cytosolic (C) and nuclear (N) compartments showing levels and localization of endogenous Foxa1 in the absence (B27zero, ATRA 0 nM) or presence (B27plus, ATRA 16 nM) of RA signaling. Fibrillarin is used as nuclear marker and loading control. (C) Percentage of cells (bar plots) and expression levels (violin plots) of, Rarα Rarβ, and Rarγ genes in epithelial cell populations of mouse normal prostate (Data ref: Crowley et al, ; Appendix Fig. S2). The p-values indicated in the boxplots were calculated with the Mann–Whitney U Test. (D) Morphological analysis of transduced mPrOs ((empty vector (EV) and Foxa1)) cultured without ATRA and DHT (ENRA--), without ATRA with DHT (ENRAD-), and without ATRA with DHT plus Enzalutamide (ENZA 10 μM). Scale bar, 1 mm. (E) Immunofluorescence analysis of Zo-1 (Tjp1), Zo-3 (Tjp3), Cldn 4, and Cldn 7 expression and localization in transduced mPrOs (EV and Foxa1) cultured without ATRA but with DHT (ENRAD-). Magnification (10x) of Zo-1 and Zo-3 immunostaining are shown to pointing out protein localization. Nuclei are stained with DAPI. Scale bars, 100 μm. White arrowhead indicates Zo-1 and Zo-3 proteins localization. N = 2 independent biological replicates.
Figure EV4
Figure EV4. Transcriptional impact of retinoic acid and testosterone signaling in prostate organoids.
(A) The barplot displays the overlap between differentially expressed genes (this work, comparison indicated on the left side) and all the Foxa1 PE-associated genes from ChIP-seq in the Foxa1 transgene expression condition (F1 + F1a + F1b + FA1). Genes are colored based on the RNA-seq status, i.e., upregulated (red), Downregulated (purple), or not differentially expressed (gray). The total number of FOXA1 PE-associated genes is 1853. The significance of the overlap between up- and down-regulated genes and the FOXA1 PE-associated genes has been determined by a hypergeometric test. The p-value is denoted by asterisks (***: 0–0.001, **: 0.001–0.01, *: 0.01–0.05, No symbol: 0.1–1.0). ChIP-seq data are from Adams et al, . (B) Venn diagrams showing the overlap of differentially expressed genes in mPrOs cultured in ENRADA versus ENRAD, and exogenous Foxa1-bound distal elements (DE (F1)) in the genome. Relevant upregulated genes in the intersection are highlighted. (C) Venn diagram showing the overlap between DEGs in mPrOs cultured in ENRADA versus ENRAD and distal elements where exogenous Foxa1 replaces/displaces Ar. Relevant DEGs in the intersections are highlighted. (D) Heatmap showing DEGs in mPrOs cultured in ENRADA versus ENRAD on the promoter of which exogenous Foxa1 displaces/replaces Ar. The indicated adjusted p-values were calculated with the Wald test and then corrected with the Benjamini–Hochberg method (default method in DESeq2). Gene names highlighted in red indicate a significant upregulation (log2FC > 1, adj. p-value < 0.05), while gene names highlighted in blue indicate a significant downregulation (log2FC < −1, adj. p-value < 0.05). (E) Venn diagram showing the overlap between differentially expressed genes in mPrOs cultured in ENRADA versus ENRAD and distal elements concomitantly bound by both Ar and exogenous Foxa1. Relevant genes in the intersections are highlighted. (F) Heatmap showing DEGs in mPrOs cultured in ENRADA versus ENRAD whose promoter is concomitantly bound by both Ar and exogenous Foxa1. The indicated adjusted p-values were calculated with the Wald test and then corrected with the Benjamini–Hochberg method (default method in DESeq2). Gene names highlighted in red indicate a significant upregulation (log2FC > 1, adj. p-value < 0.05), while gene names highlighted in blue indicate a significant downregulation (log2FC < −1, adj. p-value < 0.05). (G) Venn diagram showing the overlap between DEGs in mPrOs cultured in ENRADA versus ENRAD and distal elements bound by Ar but not by exogenous Foxa1. Relevant genes in the intersections are highlighted. (H) Heatmap showing DEGs in mPrOs cultured in ENRADA versus ENRAD whose promoter is bound by Ar but not by exogenous Foxa1. The indicated adjusted p-values were calculated with the Wald test and then corrected with the Benjamini–Hochberg method (default method in DESeq2). Gene names highlighted in red indicate a significant upregulation (log2FC > 1, adj. p-value < 0.05), while gene names highlighted in blue indicate a significant downregulation (log2FC < −1, adj. p-value < 0.05).
Figure EV5
Figure EV5. Genetic engineering of prostate organoids with Foxa1 mutant isoforms.
(A) RT-PCR and amplicons sequences of wild-type and mutant forms of Foxa1 stably expressed in mPrOs. Spectropherograms highlighting the mutated nucleotides in the different mPrOs lines. (B) Immunofluorescence analysis showing nuclear localization of endogenous and exogenous wild-type and mutant D226N Foxa1 in different growth culture conditions. Scale bar 50 μm. (C) Heatmap showing the signal intensity of Foxa1 and Ar binding over AR genome-wide binding sites (ChIP-seq from Adams et al, 2019). ChIP-seq was performed on mPrOs stably transduced with wild-type Foxa1, Foxa1F254E255, or the empty vector (EV) and cultured with DHT but not ATRA.

Update of

References

    1. Adams EJ, Karthaus WR, Hoover E, Liu D, Gruet A, Zhang Z, Cho H, DiLoreto R, Chhangawala S, Liu Y et al (2019) FOXA1 mutations alter pioneering activity, differentiation and prostate cancer phenotypes. Nature 571:408–412 - PMC - PubMed
    1. Adams EJ, Karthaus WR, Hoover E, Liu D, Gruet A, Zhang Z, Cho H, DiLoreto R, Chhangawala S, Liu Y et al (2019) Gene Expression Omnibus GSE128867. https://www.ncbi.nlm.nih.gov/geo/query/acc.cgi?acc=GSE128867 [DATASET]
    1. Alfthan O, Tarkkanen J, Gröhn P, Heinonen E, Pyrhönen S (1983) Tigason® (Etretinate) in prevention of recurrence of superficial bladder tumors. Eur Urol 9:6–9 - PubMed
    1. Allenby G, Bocquel MT, Saunders M, Kazmer S, Speck J, Rosenberger M, Lovey A, Kastner P, Grippo JF, Chambon P (1993) Retinoic acid receptors and retinoid X receptors: interactions with endogenous retinoic acids. Proc Natl Acad Sci USA 90:30–34 - PMC - PubMed
    1. Alonso-Curbelo D, Ho Y-J, Burdziak C, Maag JLV, Morris JP, Chandwani R, Chen H-A, Tsanov KM, Barriga FM, Luan W et al (2021) A gene-environment-induced epigenetic program initiates tumorigenesis. Nature 590:642–648 - PMC - PubMed

MeSH terms

LinkOut - more resources