. 2025 Jan;26(1):42-52.
doi: 10.1038/s41590-024-02024-3. Epub 2024 Dec 4.

Pyroptotic cell corpses are crowned with F-actin-rich filopodia that engage CLEC9A signaling in incoming dendritic cells

Affiliations

Pyroptotic cell corpses are crowned with F-actin-rich filopodia that engage CLEC9A signaling in incoming dendritic cells

Caroline L Holley et al. Nat Immunol. 2025 Jan.

Abstract

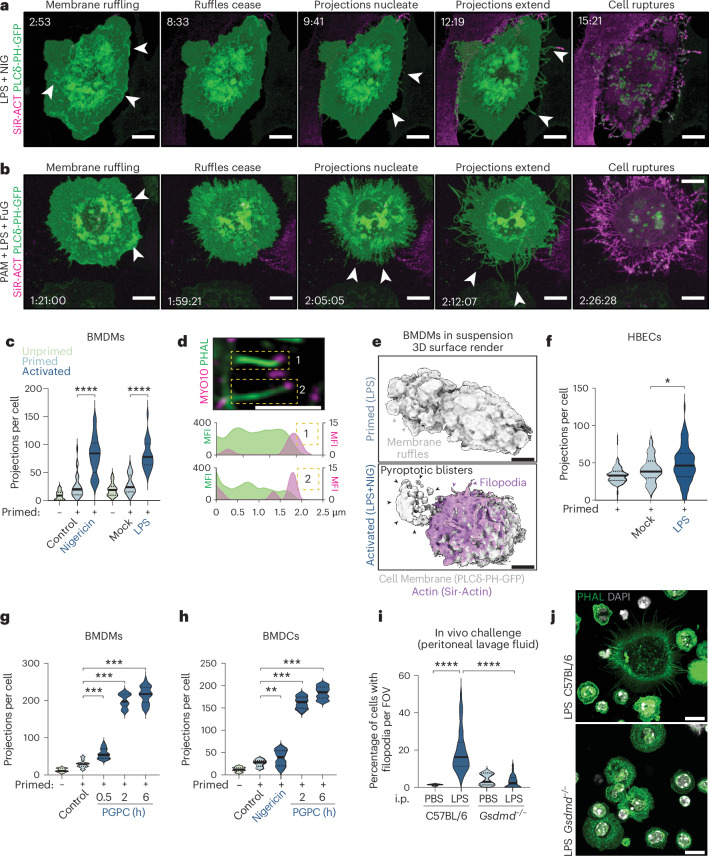
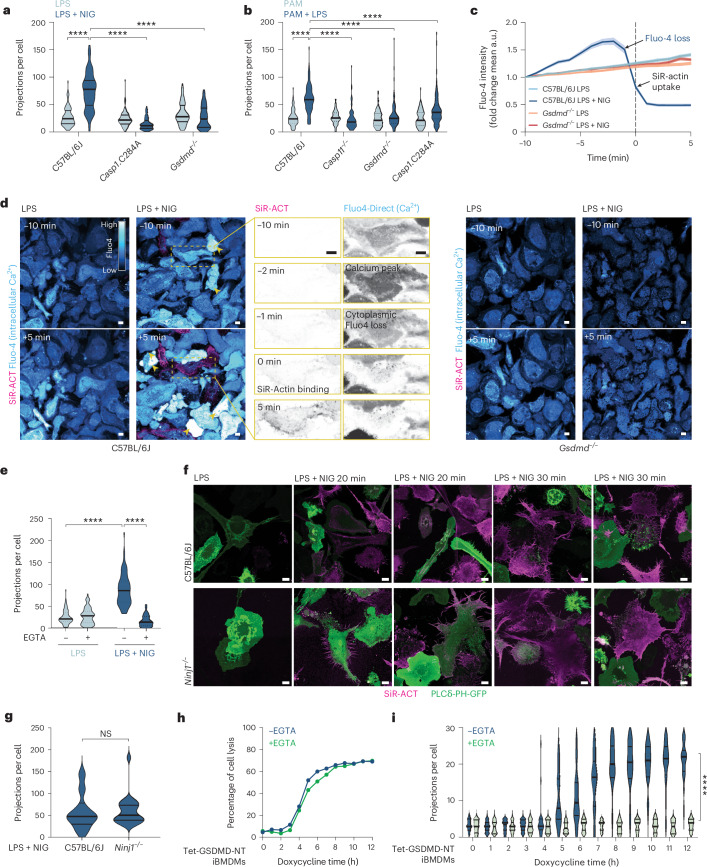
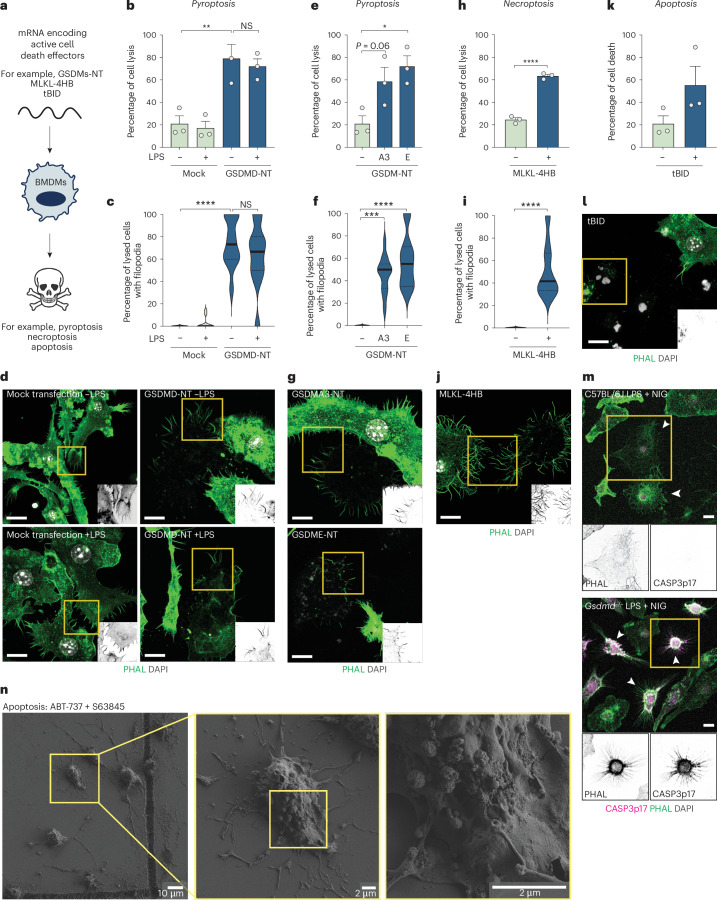
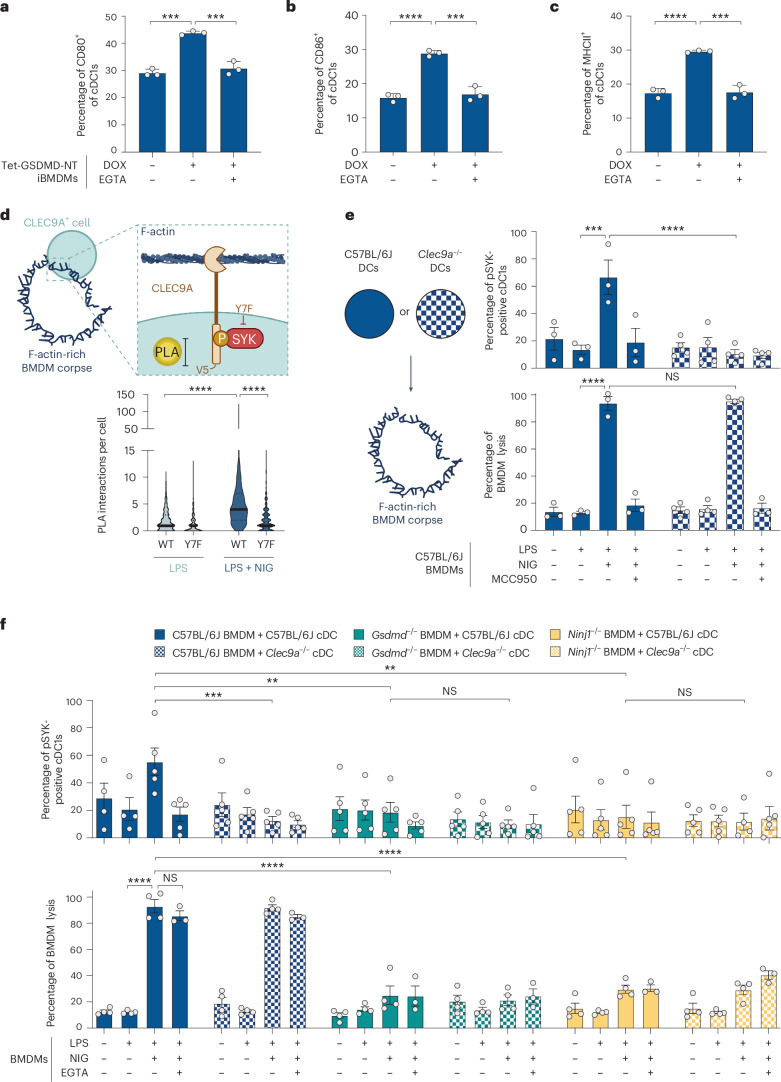
While apoptosis dismantles the cell to enforce immunological silence, pyroptotic cell death provokes inflammation. Little is known of the structural architecture of cells undergoing pyroptosis, and whether pyroptotic corpses are immunogenic. Here we report that inflammasomes trigger the Gasdermin-D- and calcium-dependent eruption of filopodia from the plasma membrane minutes before pyroptotic cell rupture, to crown the resultant corpse with filopodia. As a rich store of F-actin, pyroptotic filopodia are recognized by dendritic cells through the F-actin receptor, CLEC9A (DNGR1). We propose that cells assemble filopodia before cell rupture to serve as a posthumous mark for a cell that has died by gasdermin-induced pyroptosis, or MLKL-induced necroptosis, for recognition by dendritic cells. This study reveals the spectacular morphology of pyroptosis and identifies a mechanism by which inflammasomes induce pyroptotic cells to construct a de novo alarmin that activates dendritic cells via CLEC9A, which coordinates the transition from innate to adaptive immunity1,2.


Conflict of interest statement

Competing interests: K.S., M.H.L. and J.C.K. declare the following competing interests: K.S. is a coinventor on patent applications for NLRP3 inhibitors that have been licensed to Inflazome Ltd. K.S. served on the Scientific Advisory Board of Inflazome (2016–2017) and Quench Bio, USA (2018–2021) and serves on a Scientific Advisory Board for Novartis, Switzerland (since 2020). M.H.L. is an inventor on patents relating to CLEC9A antibodies. J.C.K. consults and holds equity in Corner Therapeutics, Larkspur Biosciences, MindImmune Therapeutics and Neumora Therapeutics; none of these relationships affected this study. The other authors declare no competing interests.

Figures

Fig. 1
Fig. 1. NLRP3 and CASP11 inflammasome activators trigger the extrusion of F-actin-rich filopodia.
a,b, Live fast Airyscan confocal imaging of BMDMs expressing the PLCδ-PH-GFP PIP2 probe and labeled with 1 µM SiR-actin. Macrophages were primed for 4 h with LPS and stimulated with nigericin (NIG) (a) or primed with PAM3CSK4 (PAM, 16 h) and transfected with LPS using FuGENE HD (FuG) (b). Images are MIP of Z-stack acquisitions, and representative of n = 3 independent biological experiments. c, Quantification of filopodia per cell in each condition of a and b using manual counting (n = 25 per condition), analyzed using the Mann–Whitney two-sided test. d, Airyscan confocal imaging of pyroptotic projections (phalloidin, α-MYO10) for nigericin-stimulated macrophages. Plots of mean fluorescence intensity (MFI) in boxed regions are displayed below. Images are single Z-planes and representative of n = 3 independent biological experiments. e, BMDM ectopically expressing PLCδ-PH-GFP (cell membrane) were grown in suspension. 3D cell surface rendering of BMDM and F-actin (SiR-actin) remodeling when pyroptosis was activated (LPS + NIG). fh, Quantification of filopodia per cell from HBEC (f), BMDMs (g) or BMDCs (h) treated as indicated to induce pyroptosis (LPS + NIG (nigericin), PAM + LPS transfection) or sublytic inflammasome signaling (LPS + PGPC). Protrusions from 25–130 randomly chosen cells with filopodia were counted per condition, and analyzed by a Mann–Whitney two-sided test with Bonferroni correction. ij, WT and Gsdmd−/− mice (9–10 female mice per condition) were intraperitoneally (i.p.) challenged with LPS (or two mice per genotype for PBS) for 4 h, 3 days after 2% thioglycollate exposure. The peritoneal lavage cells were labeled with phalloidin and DAPI. i, The percentage of cells with filopodia per field of view (FOV) (×40 magnification) was enumerated, with at least 100–300 cells recorded from each mouse (3–5 randomly acquired fields of view), analyzed by Mann–Whitney two-sided test. j, Images are Z-stack MIPs and representative of n = 9–10 mice from two independent experiments. Scale bars, 10 µm (a,b,j), 2 μm (d), 5 µm (e). Violin plots show mean (solid line) and first and third quartiles (dotted lines). Statistical significance: *P ≤ 0.05; **P ≤ 0.01; ***P ≤ 0.001; ****P ≤ 0.0001.
Fig. 2
Fig. 2. GSDMD-NT is sufficient for calcium-induced pyroptotic filopodia, which sprout independently of cell rupture.
a,b, Quantification of filopodia per cell from macrophages in which pyroptosis was stimulated (LPS + NIG, a; PAM + LPS, b). Data were analyzed using a Kruskal–Wallis test with Dunn’s multiple testing correction (n = 75 cells per condition from three independent biological experiments). c, Quantification of Fluo-4 (Ca2+ reporter) intensity extracted from a 45 min acquisition following nigericin-induced pyroptosis in BMDM, relative to the first frame in which the cells become positive for SiR-actin (time 0 min). A total of 72 cells per condition were analyzed pooled from three independent biological experiments. Data are mean intensity (in arbitrary units, a.u.) ± s.e.m. d, Spinning disk confocal imaging of macrophages incubated with Fluo-4 and SiR-actin. WT or Gsdmd−/− LPS-primed BMDM were left untreated or exposed to nigericin. Yellow arrows indicate cells with a spike in calcium that precedes cell rupture. Images are representative of n = 3 independent biological experiments. e, Quantification of filopodia from macrophages pretreated with 2 mM EGTA 1 h before nigericin in Extended Data Fig. 5c. Data were analyzed using a Kruskal–Wallis test with Dunn’s multiple testing correction (n = 75 cells per condition from three independent biological experiments). f, Live fast Airyscan confocal imaging of WT versus Ninj1−/− LPS-primed BMDM expressing the PLCδ-PH-GFP probe, labeled with SiR-actin and stimulated with nigericin for up to 30 min. Images are Z-stack MIPs and representative of n = 3 independent biological experiments, analyzed by an unpaired two-sided Mann–Whitney test. g, Quantification of filopodia from nigericin-treated BMDM. Tile scan images were collected between 20–30 min post-NLRP3 activation from n = 3 independent biological experiments. Filopodia were counted in SiR-actin-positive cells. h,i, LPS-primed iBMDM stably expressing Tet-GSDMD-NT were exposed to doxycycline ± EGTA-AM, and analyzed for cell lysis, presented as mean of technical replicates (h) or filopodia (i). Filopodia were quantified from 40 randomly chosen cells per condition and time point, corresponding to Extended Data Fig. 5d, and analyzed by a Mann–Whitney two-sided test with a false discovery rate multiple testing correction. Scale bars, 10 µm. Violin plots show mean (solid line) and first and third quartiles (dotted lines). Statistical significance ****P ≤ 0.0001.
Fig. 3
Fig. 3. Diverse effectors of lytic cell death induce filopodial assembly.
a, Schematic of experimental protocol for cell death induction by death effector-encoding mRNAs. bl, WT BMDMs were transfected with 5-methoxyuridine mRNA encoding GSDMD-NT (bd), GSDMA3-NT (eg), GSDME-NT (eg), MLKL-4HB (hj) or tBID (k,l). Cells were analyzed 4 h after mRNA transfection. For GSDMD, cells were treated with or without LPS for 4 h before analysis. Data are from n = 3 independent biological experiments. b,e,h,k, LDH release assay. Data were verified for normality, and analyzed by one-way analysis of variance (ANOVA). c,f,i, Quantification of filopodial projections. For each condition, random fields of view were selected and lysed cells were identified and assessed for the presence of filopodia (n = 9–13). Data were analyzed with a Kruskal–Wallis test with Dunn’s multiple testing correction or a Mann–Whitney two-sided test. d,g,j,l, Fixed Airyscan confocal imaging of cells labeled with F-actin phalloidin (green) and DAPI (gray). Images are Z-stack MIPs and are representative of n = 3 independent biological experiments. m, Confocal imaging of fixed WT and Gsdmd−/− macrophages labeled with F-actin phalloidin (green) and α-cleaved caspase-3 antibody (magenta). Magnified insets of inverted phalloidin (green) and cleaved caspase-3 (magenta) are shown in gray. Images are Z-stack MIPs, and are representative of n = 3 independent biological experiments. n, SEM of macrophage corpses produced by intrinsic apoptosis (0.5 µM ABT-737 + S63845 for 2 h; representative of n = 2 independent experiments). Scale bars, 10 µm, except where indicated otherwise. Violin plots show the mean (solid line) and first and third quartiles (dotted lines). Statistical significance: *P ≤ 0.05; **P ≤ 0.01; ***P ≤ 0.001; ****P ≤ 0.0001.
Fig. 4
Fig. 4. Asymmetric rupture preserves filopodia and corpse remnants.
a, Lattice light-sheet imaging of macrophage expressing PLCδ-PH-GFP (green) and incubated with 1 µM SiR-actin (magenta). Primed macrophages were stimulated with nigericin for the time indicated in each panel. Cells in examples (i) and (ii) are displayed on a shifted axis (indicated in top right of example (i)) to highlight the 3D morphology of macrophages undergoing pyroptosis. Images were processed in Arivis 4D and represented as volume renderings. Each channel was nonlinearly adjusted (gamma, 2) to represent cell features across a wide dynamic range. b, (i) LLAMA segmentation of the SiR-actin signal of lattice light-sheet imaging, analyzing nigericin-stimulated cells. Cell body (green), filopodia (magenta) and pyroptotic blisters (blue) were segmented by machine learning and are displayed as volumetric projections. b, (ii) Line scans (indicated in yellow on the rotated MIP panel) relative to (i) are displayed as orthogonal slice views to represent the spatial distribution of pyroptotic cell features. Orthogonal slices were processed using Fiji. c,d, SEM of macrophage corpses produced by NLRP3- or CASP11-activating stimuli (nigericin, c; cytosolic LPS, d). Scale as indicated and magnified insets are to the right of each panel. e, Quantification of the cell and corpse area of WT LPS-primed BMDM stimulated with nigericin with or without EGTA. Phalloidin-labeled footprints of intact cells containing ASC specks (left), and cells that had undergone PMR and lost the bulk of cell mass (right) were hand-segmented in Fiji. Examples are included in Extended Data Fig. 5c. The area of thresholded phalloidin staining was quantified per cell, and analyzed by an unpaired two-sided Mann–Whitney test. f, Schematic view of F-actin remodeling to generate filopodia-rich corpses via GSDMD-dependent Ca2+ influx. Scale bars, 10 µm except where indicated otherwise, and data are representative of three independent biological replicates. Violin plots show mean (solid line) and first and third quartiles (dotted lines). Statistical significance ****P ≤ 0.0001.
Fig. 5
Fig. 5. F-actin-rich filopodia from pyroptotic corpses are sensed by CLEC9A, triggering signaling to SYK.
ac, iBMDM stably expressing Tet-GSDMD-NT were exposed to doxycycline in the presence or absence of EGTA-AM, and incubated with murine dendritic cells. Cell surface expression of DC activation markers CD80 (a), CD86 (b) and MHCII (c) in the cDC1 population (CD11c+/CD24+/SIRPA) was assessed by flow cytometry (n = 3 independent biological experiments). Data are mean ± s.e.m., were verified for normality and analyzed by unpaired two-sided t-test. d, Experimental method for quantifying phospho-SYK interactions with V5-C-terminally tagged CLEC9A by (PLA in RAW264.7 cells stably expressing murine CLEC9A (WT or Y7F signal-deficient mutant). LPS-primed macrophages, and nigericin-induced macrophage corpses, were incubated with CLEC9A-expressing RAW264.7 cells in the presence of 50 µM pervanadate. Quantification of PLA signal maxima for manually segmented RAW264.7 cells from Airyscan confocal images of macrophages (representative images shown in Extended Data Fig. 9b). Data were analyzed using a Kruskal–Wallis test with Dunn’s multiple testing correction (n > 260 cells per condition pooled from three independent biological experiments). e, Unprimed or LPS-primed WT macrophages were left untreated, or exposed to nigericin with or without MCC950 (10 µM) added 1 h before nigericin. BMDM lysis was measured by LDH release (lower panel). WT or Clec9a−/− dendritic cells were then added to macrophage cultures, and the percentage of the cDC1 population (XCR1+/CD24+) that was positive for p-SYK was quantified by flow cytometry (upper panel). Data are mean ± s.e.m. and were analyzed by two-way ANOVA with Bonferroni correction (data points graphed are independent biological experiments). f, Unprimed or LPS-primed WT, Gsdmd−/− or Ninj1−/− macrophages were left untreated or exposed to nigericin with or without EGTA-AM (10 µM) added 1 h before nigericin. BMDM lysis was measured by LDH release (lower panel). WT or Clec9a−/− dendritic cells were then added to macrophage cultures, and the percentage of the cDC1 population (XCR1+/CD24+) that was positive for p-SYK was quantified by flow cytometry (upper panel). Data are mean ± s.e.m. and were analyzed by two-way ANOVA with Bonferroni correction (data points graphed are independent biological experiments). Statistical significance: **P ≤ 0.01; ***P ≤ 0.001; ****P ≤ 0.0001.
Extended Data Fig. 1
Extended Data Fig. 1. Inflammasomes trigger the eruption of F-actin projections in macrophages.
a-b, Live fast Airyscan confocal imaging of macrophages from mice expressing the LifeAct- peptide fused to eGFP (green) a, primed for 4 h with 100 ng ml−1 ultrapure E. coli LPS and stimulated with 5 µM nigericin, or b, primed for 16 h with 1 µg ml−1 PAM3CSK4 and then transfected with 2 µg ml−1 ultrapure E. coli LPS delivered using FuGENE HD, for the time indicated in each panel. Macrophages were incubated with 150 nM Sytox-red (magenta) during imaging. LifeAct-eGFP insets are displayed in grey within each panel. c-d, Airyscan confocal imaging of fixed macrophages labelled with DAPI nuclear stain (grey), phalloidin F-actin stain (green, and grey inverted insets in the lower right of panels), and α-ASC antibody (magenta, circular inset). Macrophages were c, unstimulated, primed with LPS, or LPS-primed for 4 h and stimulated for 30 min with nigericin, or d, mock transfected with FuGENE HD with or without prior priming with PAM3CSK4 for 16 h, or PAM3CSK4-primed and stimulated for 2 h with intracellular LPS packaged with FuGENE HD. a-d, Images are maximum intensity projections of Z-stack acquisitions, and representative of n = 3 independent biological experiments. e, Confocal imaging of fixed macrophages labelled with phalloidin (green), DAPI (grey), and α-ASC antibody (magenta). Macrophages were primed with LPS for 4 h and stimulated with 1.25 mM ATP for 1 h, or 5 µM nigericin for 30 min, in the presence or absence of 10 µM MCC950 added 30 min before ATP or nigericin. Unprimed macrophages were stimulated with 250 ng ml−1 PA and 125 ng ml−1 Fla1-LFn (PA-FlaTox) for 1 h to induce NLRC4 signalling. Images are maximum intensity projections of Z-stack acquisitions. f, LDH release of e, plotted as mean of technical duplicates. g, Airyscan confocal imaging of pyroptotic projections labelled with phalloidin (green) and α-MYO10 antibody (magenta). Plots of mean fluorescence intensity (MFI) in regions outlined by dashed yellow rectangles (upper) are displayed in lower panels. Primed macrophages were stimulated with cytosolic LPS, as described earlier. Images are single Z-planes and representative of n = 3 independent biological experiments. h, Fixed Airyscan confocal imaging of human monocyte-derived macrophages (HMDM), labelled with F-actin stain phalloidin (green), MYO10 (magenta) and DAPI (grey). HMDM were LPS primed or co-administered LPS plus nigericin (10 µM), or 250 ng ml−1 PA plus 20 ng ml−1 PrgI-LFn (PA-PrgI) to induce NLRC4 signalling. Images are maximum intensity projections of Z-stack acquisitions and representative of n = 3 independent biological experiments. All scale bars = 10 µm except where indicated.
Extended Data Fig. 2
Extended Data Fig. 2. Nigericin stimulates the assembly of filopodia in suspended macrophages.
BMDM expressing PLCδ-PH-GFP (cell membrane, green) were grown in suspension on PLL-g-PEG passivated glass and pyroptosis was activated (LPS plus nigericin). Maximum intensity projections time-series of BMDM clusters labelled with cell membrane PLCδ-PH-GFP (green) and F-actin (SiR-actin, magenta). Upon induction of pyroptosis, cell membrane rupture occurs as observed by the loss of green signal (cell membrane PLCδ-PH-GFP, 8 min) and increased positive staining for F-actin (SiR-actin, magenta, 18 min). Data are representative of three independent biological replicates. Scale bars = 10 µm.
Extended Data Fig. 3
Extended Data Fig. 3. Inflammasome activators induce filopodia under non-lytic conditions, and in non-myeloid cells.
a, Fixed Airyscan confocal imaging of human bronchial epithelial cells (HBEC), labelled with F-actin stain phalloidin (green), Myo10 (magenta) and DAPI (grey). Cells were primed for 16 h with 1 µg ml−1 PAM3CSK4 (PAM), and CASP4 was activated with LPS transfection for 5.5 hours. b-c, Representative immunofluorescence images of BMDMs or e-f, BMDCs primed with LPS and treated with nigericin or PGPC for 0.5 to 6 h to induce pyroptosis or hyperactivation and filopodia formation. b, e, Insets depict filopodia. Cells were labelled with F-actin stain phalloidin (green), ASC (magenta) and DAPI (grey). c, f, Representative Airyscan immunofluorescence images of filopodia in pyroptotic or hyperactive BMDMs or BMDCs (2 h stimulation). Plots of MFI in regions outlined by dashed yellow rectangles are displayed in lower panels. Cells were labelled with F-actin stain phalloidin (green) and Myo10 (magenta). d, g, Quantification of branched projections per cell from BMDMs or BMDCs treated as indicated to induce pyroptosis or sub-lytic inflammasome signalling. Protrusions from 40 randomly chosen cells with filopodia were counted per condition and time point to assess the percentage of projections that were branched. Data were analysed using a Kruskal Wallis test with Dunn’s multiple testing correction (n = 25–72 from three independent biological experiments). All images are maximum intensity projections of Z-stack acquisitions and representative of n = 3 independent biological experiments. All scale bars = 10 µm. Violin plots show mean (solid line) and first and third quartiles (dotted lines). Statistical significance: *** p ≤ 0.001; **** p ≤ 0.0001.
Extended Data Fig. 4
Extended Data Fig. 4. GSDMD is required for the assembly of pyroptotic filopodia.
a, Fast Airyscan confocal imaging of WT, Casp1C284A or Gsdmd−/− macrophages labelled with DAPI (grey), F-actin phalloidin (green), and α-ASC antibody (magenta). LPS-primed macrophages stimulated with nigericin. Images are maximum intensity projections of Z-stack acquisitions and representative of n = 3 independent biological experiments. b, LDH release data (mean + SEM from n = 3 independent biological experiments; verified for normality and analysed by one-way ANOVA with Dunnett’s multiple testing correction) from experiments shown in Extended Data Fig. 4a. c, Fast Airyscan confocal imaging of PAM-primed macrophages stimulated with cytosolic LPS, labelled with DAPI (grey), F-actin phalloidin (green), and anti-ASC antibody (magenta). Images are maximum intensity projections of Z-stack acquisitions and are representative of n = 3 independent biological experiments. d, LDH release data (mean + SEM from n = 3 independent biological experiments; verified for normality and analysed by one-way ANOVA with Dunnett’s multiple testing correction) from experiments shown in Extended Data Fig. 4c. All scale bars = 10 µm.
Extended Data Fig. 5
Extended Data Fig. 5. GSDMD-dependent Ca2+ influx is sufficient for filopodial assembly.
a, Representation of an individual LPS-primed wild-type BMDM stimulated with nigericin, showcasing the Ca2+ elevation oscillations (Fluo-4 intensity) that precede membrane rupture (15 min timeframes extracted from 45 min of imaging). Data are representative of three independent biological replicates. b, LDH release data (mean of n = 2 independent experiments) corresponding to Extended Data Fig. 5c data. c, Fast Airyscan confocal imaging of macrophages labelled with DAPI (grey), phalloidin (green), and α-ASC antibody (magenta). LPS-primed macrophages were treated with or without nigericin as described earlier, in the presence or absence of 2 mM EGTA added to the cell culture media 30 min before nigericin. Magnified insets of inverted phalloidin are displayed to the right of each panel (grey). Images are maximum intensity projections of Z-stack acquisitions and are representative of n = 3 independent biological experiments. d, Representative Airyscan immunofluorescence images of iBMDM+Tet-GsdmD-NT cells treated with doxycycline (Dox) in the presence or absence of EGTA-AM for indicated times. Cells were labelled with DAPI (grey) and phalloidin (green). Data are representative of three independent biological replicates. All scale bars: 10 µm.
Extended Data Fig. 6
Extended Data Fig. 6. Correlative light and scanning electron microscopy monitors filopodial assembly over a time course of nigericin stimulation.
a, LDH release data (mean of technical replicates from a single experiment, representative of n = 2 independent biological experiments) and NT-GSDMD cleavage immunoblot analysis of cell extracts to accompany panels b-e over time. b-f, Scanning EM of LPS primed macrophage stimulated with nigericin to assess filopodia formation at the indicated time points. Scale bars are as indicated, and magnified inserts are shown to the right. All western blots and images are representative of n = 2 independent biological experiments. Source data
Extended Data Fig. 7
Extended Data Fig. 7. Correlative light and scanning electron microscopy monitors filopodial assembly over a time course of cytosolic LPS stimulation.
a, LDH release data (mean of technical replicates from a single experiment, representative of n = 2 independent biological experiments) and NT-GSDMD cleavage immunoblot analysis of cell extracts to accompany panels b-e over time. b-f, Scanning EM of PAM-primed macrophages transfected with LPS for the indicated time points. Scale bars are as indicated, and magnified inserts are shown to the right. All western blots and images are representative of n = 2 independent biological experiments. Source data
Extended Data Fig. 8
Extended Data Fig. 8. Inflammasome agonists generate stable caches of F-actin within filopodia.
a-e, Microscopy of macrophage corpses that were generated by exposing primed macrophages to a,c,e nigericin (45 mins or as indicated), or b,d, cytosolic LPS (2 h). Panels a-b show cells imaged with correlative light and electron microscopy to colocalise actin (phalloidin, green). c-e, Representative Airyscan immunofluorescence images of cells labelled with DAPI (grey) and phalloidin (green). Images are maximum intensity projections of Z-stack acquisitions. Cells in panel e were cultured for up to 24 h post-nigericin to assess filopodia stability over time. All scale bars = 10 µm unless otherwise indicated, and all images are representative images of n = 3 independent biological experiments.
Extended Data Fig. 9
Extended Data Fig. 9. Filopodia from pyroptotic corpses activate CLEC9A.
a, Gating strategy to identify cDC1s positive for p-SYK upon dendritic cell incubation with macrophages. b, Airyscan confocal images of macrophages (primed live cells, versus pyroptotic corpses generated with nigericin) incubated in the presence 50 µM pervanadate with RAW264.7 cells stably expressing murine CLEC9A (wildtype or Y7F signal-deficient mutant) with a V5 tag conjugated to the cytosolic C-terminus. Cells were labelled with phalloidin (green), DAPI (grey), α-V5 antibody (blue), and the proximity ligation assay (PLA) reaction produced puncta when α-V5 and α-p-SYK antibodies co-located (magenta). Data are representative of three independent biological replicates. c, Immunoblot of HEK293T cells ectopically expressing the indicated pEF6-CLEC9A-V5 constructs for 16 h versus pEF6 empty vector (EV), from a single experiment. CLEC9A is 25 kDa, and predicted to be 28-29 kDa with the V5 tag and linker. GAPDH is 37 kDa. d, Confocal imaging of fixed HEK293T cells expressing the indicated pEF6- CLEC9A-V5 plasmids, from a single experiment. Cells were labelled with phalloidin (green), DAPI (grey), and α-V5 antibody (magenta in left panels, inverted grey in right panels). e, Gating strategy to identify cDC1s and their activation by incubation with macrophage pyroptotic corpses. All images are maximum intensity projections of Z-stack acquisitions, with 10 µm scale bars. Source data

References

    1. Sancho, D. et al. Identification of a dendritic cell receptor that couples sensing of necrosis to immunity. Nature458, 899–903 (2009). - PMC - PubMed
    1. Cueto, F. J., Del Fresno, C. & Sancho, D. DNGR-1, a dendritic cell-specific sensor of tissue damage that dually modulates immunity and inflammation. Front. Immunol.10, 3146 (2019). - PMC - PubMed
    1. Emming, S. & Schroder, K. Tiered DNA sensors for escalating responses. Science365, 1375–1376 (2019). - PubMed
    1. Deets, K. A. & Vance, R. E. Inflammasomes and adaptive immune responses. Nat. Immunol.22, 412–422 (2021). - PubMed
    1. Evavold, C. L. & Kagan, J. C. How inflammasomes inform adaptive immunity. J. Mol. Biol.430, 217–237 (2018). - PMC - PubMed

MeSH terms

LinkOut - more resources